
By InvestMacro | COT | Data Tables | COT Leaders | Downloads | COT Newsletter
Here are the latest charts and statistics for the Commitment of Traders (COT) data published by the Commodities Futures Trading Commission (CFTC).
The latest COT data is updated through Tuesday January 11th 2022 and shows a quick view of how large traders (for-profit speculators and commercial entities) were positioned in the futures markets.
Highlighting the COT energy data is the rebound in the WTI Crude Oil futures bets. The speculative net position in the WTI Crude Oil futures rose this week following eight straight weeks of declines that had brought the overall net position to its lowest level in the past 149 weeks, dating all the way back to March 5th of 2019. This week’s rebound (+27,680 contracts) for speculators marked the largest one-week gain in just over a year and steadied the net position back above the +350,000 level. The WTI price has been on a higher trajectory in the past month and closed the week right around the $84 per barrel level.
Joining WTI Crude Oil (27,680 contracts) with speculator gains this week were Natural Gas (19,343 contracts) and Heating Oil (8,383 contracts) while lower bets were seen in Brent Crude Oil (-5,436 contracts), Gasoline (-4,815 contracts) and the Bloomberg Commodity Index (-5,088 contracts).
| Jan-11-2022 | OI | OI-Index | Spec-Net | Spec-Index | Com-Net | COM-Index | Smalls-Net | Smalls-Index |
|---|---|---|---|---|---|---|---|---|
| WTI Crude | 1,966,615 | 15 | 360,505 | 24 | -396,940 | 68 | 36,435 | 66 |
| Gold | 546,516 | 32 | 199,737 | 51 | -225,073 | 49 | 25,336 | 36 |
| Silver | 144,442 | 11 | 27,548 | 50 | -37,360 | 62 | 9,812 | 0 |
| Copper | 189,678 | 19 | 16,706 | 54 | -22,541 | 44 | 5,835 | 59 |
| Palladium | 9,110 | 12 | -2,978 | 4 | 3,292 | 96 | -314 | 26 |
| Platinum | 59,061 | 20 | 5,289 | 10 | -10,952 | 93 | 5,663 | 41 |
| Natural Gas | 1,136,714 | 6 | -122,564 | 42 | 95,136 | 61 | 27,428 | 48 |
| Brent | 215,266 | 51 | -16,691 | 90 | 13,101 | 11 | 3,590 | 58 |
| Heating Oil | 356,728 | 35 | 15,875 | 66 | -39,484 | 29 | 23,609 | 80 |
| Soybeans | 678,613 | 17 | 138,272 | 65 | -104,896 | 41 | -33,376 | 16 |
| Corn | 1,504,234 | 22 | 407,492 | 82 | -366,833 | 20 | -40,659 | 20 |
| Coffee | 265,514 | 33 | 60,168 | 92 | -63,594 | 10 | 3,426 | 12 |
| Sugar | 883,009 | 14 | 122,925 | 62 | -134,491 | 43 | 11,566 | 22 |
| Wheat | 369,218 | 18 | -1,466 | 46 | 12,111 | 53 | -10,645 | 51 |
Free Reports:
 Sign Up for Our Stock Market Newsletter – Get updated on News, Charts & Rankings of Public Companies when you join our Stocks Newsletter
 Get our Weekly Commitment of Traders Reports - See where the biggest traders (Hedge Funds and Commercial Hedgers) are positioned in the futures markets on a weekly basis.
WTI Crude Oil Futures:
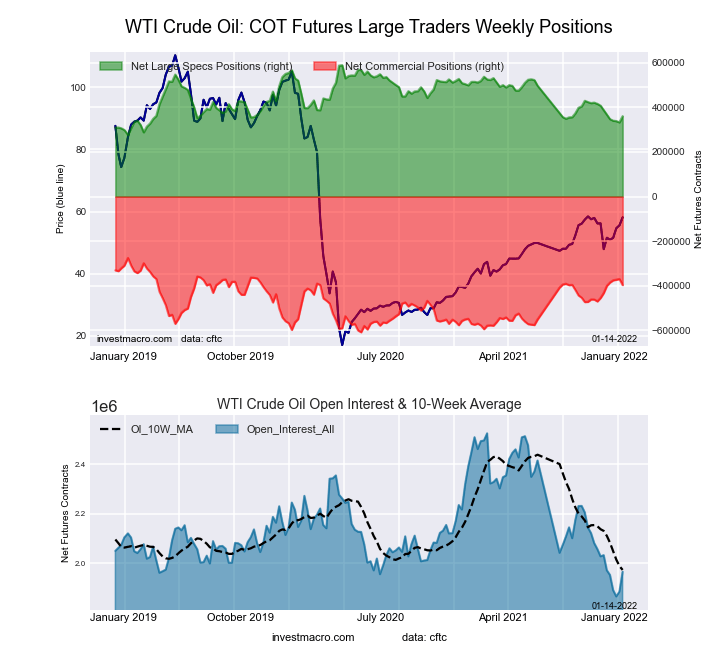 The WTI Crude Oil Futures large speculator standing this week reached a net position of 360,505 contracts in the data reported through Tuesday. This was a weekly gain of 27,680 contracts from the previous week which had a total of 332,825 net contracts.
This week’s current strength score (the trader positioning range over the past three years, measured from 0 to 100) shows the speculators are currently Bearish with a score of 24.0 percent. The commercials are Bullish with a score of 68.3 percent and the small traders (not shown in chart) are Bullish with a score of 66.4 percent.
| WTI Crude Oil Futures Statistics | SPECULATORS | COMMERCIALS | SMALL TRADERS |
| – Percent of Open Interest Longs: | 24.6 | 36.9 | 4.6 |
| – Percent of Open Interest Shorts: | 6.3 | 57.1 | 2.8 |
| – Net Position: | 360,505 | -396,940 | 36,435 |
| – Gross Longs: | 484,370 | 726,296 | 91,354 |
| – Gross Shorts: | 123,865 | 1,123,236 | 54,919 |
| – Long to Short Ratio: | 3.9 to 1 | 0.6 to 1 | 1.7 to 1 |
| NET POSITION TREND: | |||
| – Strength Index Score (3 Year Range Pct): | 24.0 | 68.3 | 66.4 |
| – Strength Index Reading (3 Year Range): | Bearish | Bullish | Bullish |
| NET POSITION MOVEMENT INDEX: | |||
| – 6-Week Change in Strength Index: | -8.9 | 11.6 | -13.0 |
Brent Crude Oil Futures:
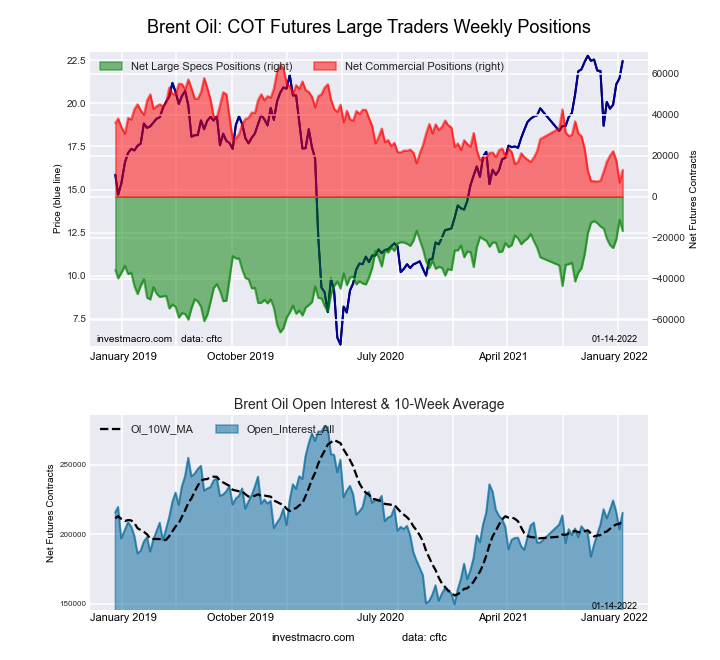 The Brent Crude Oil Futures large speculator standing this week reached a net position of -16,691 contracts in the data reported through Tuesday. This was a weekly reduction of -5,436 contracts from the previous week which had a total of -11,255 net contracts.
This week’s current strength score (the trader positioning range over the past three years, measured from 0 to 100) shows the speculators are currently Bullish-Extreme with a score of 90.1 percent. The commercials are Bearish-Extreme with a score of 10.7 percent and the small traders (not shown in chart) are Bullish with a score of 57.8 percent.
| Brent Crude Oil Futures Statistics | SPECULATORS | COMMERCIALS | SMALL TRADERS |
| – Percent of Open Interest Longs: | 21.1 | 43.2 | 3.4 |
| – Percent of Open Interest Shorts: | 28.9 | 37.1 | 1.7 |
| – Net Position: | -16,691 | 13,101 | 3,590 |
| – Gross Longs: | 45,528 | 93,021 | 7,325 |
| – Gross Shorts: | 62,219 | 79,920 | 3,735 |
| – Long to Short Ratio: | 0.7 to 1 | 1.2 to 1 | 2.0 to 1 |
| NET POSITION TREND: | |||
| – Strength Index Score (3 Year Range Pct): | 90.1 | 10.7 | 57.8 |
| – Strength Index Reading (3 Year Range): | Bullish-Extreme | Bearish-Extreme | Bullish |
| NET POSITION MOVEMENT INDEX: | |||
| – 6-Week Change in Strength Index: | -2.2 | 1.6 | 4.2 |
Natural Gas Futures:
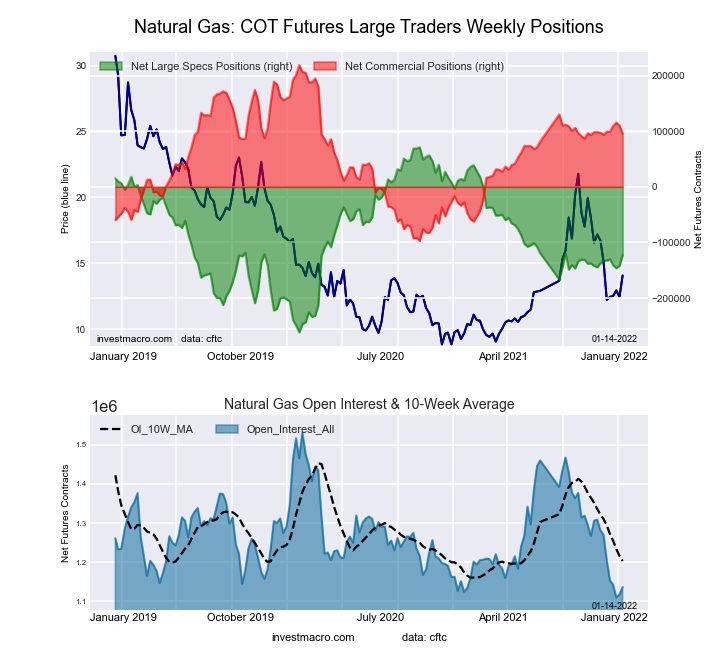 The Natural Gas Futures large speculator standing this week reached a net position of -122,564 contracts in the data reported through Tuesday. This was a weekly advance of 19,343 contracts from the previous week which had a total of -141,907 net contracts.
This week’s current strength score (the trader positioning range over the past three years, measured from 0 to 100) shows the speculators are currently Bearish with a score of 41.8 percent. The commercials are Bullish with a score of 60.9 percent and the small traders (not shown in chart) are Bearish with a score of 48.5 percent.
| Natural Gas Futures Statistics | SPECULATORS | COMMERCIALS | SMALL TRADERS |
| – Percent of Open Interest Longs: | 19.5 | 42.7 | 4.6 |
| – Percent of Open Interest Shorts: | 30.3 | 34.3 | 2.2 |
| – Net Position: | -122,564 | 95,136 | 27,428 |
| – Gross Longs: | 221,396 | 484,896 | 52,328 |
| – Gross Shorts: | 343,960 | 389,760 | 24,900 |
| – Long to Short Ratio: | 0.6 to 1 | 1.2 to 1 | 2.1 to 1 |
| NET POSITION TREND: | |||
| – Strength Index Score (3 Year Range Pct): | 41.8 | 60.9 | 48.5 |
| – Strength Index Reading (3 Year Range): | Bearish | Bullish | Bearish |
| NET POSITION MOVEMENT INDEX: | |||
| – 6-Week Change in Strength Index: | 3.0 | 0.5 | -29.6 |
Gasoline Blendstock Futures:
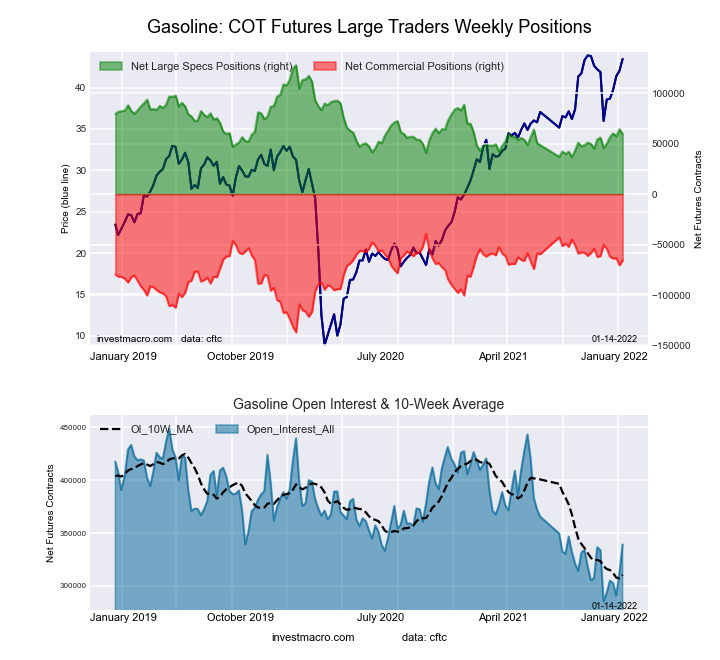 The Gasoline Blendstock Futures large speculator standing this week reached a net position of 59,502 contracts in the data reported through Tuesday. This was a weekly decrease of -4,815 contracts from the previous week which had a total of 64,317 net contracts.
This week’s current strength score (the trader positioning range over the past three years, measured from 0 to 100) shows the speculators are currently Bearish with a score of 30.7 percent. The commercials are Bullish with a score of 71.4 percent and the small traders (not shown in chart) are Bearish with a score of 47.7 percent.
| Nasdaq Mini Futures Statistics | SPECULATORS | COMMERCIALS | SMALL TRADERS |
| – Percent of Open Interest Longs: | 30.0 | 48.6 | 6.0 |
| – Percent of Open Interest Shorts: | 12.4 | 67.9 | 4.2 |
| – Net Position: | 59,502 | -65,555 | 6,053 |
| – Gross Longs: | 101,661 | 164,923 | 20,449 |
| – Gross Shorts: | 42,159 | 230,478 | 14,396 |
| – Long to Short Ratio: | 2.4 to 1 | 0.7 to 1 | 1.4 to 1 |
| NET POSITION TREND: | |||
| – Strength Index Score (3 Year Range Pct): | 30.7 | 71.4 | 47.7 |
| – Strength Index Reading (3 Year Range): | Bearish | Bullish | Bearish |
| NET POSITION MOVEMENT INDEX: | |||
| – 6-Week Change in Strength Index: | 14.1 | -15.4 | 9.0 |
#2 Heating Oil NY-Harbor Futures:
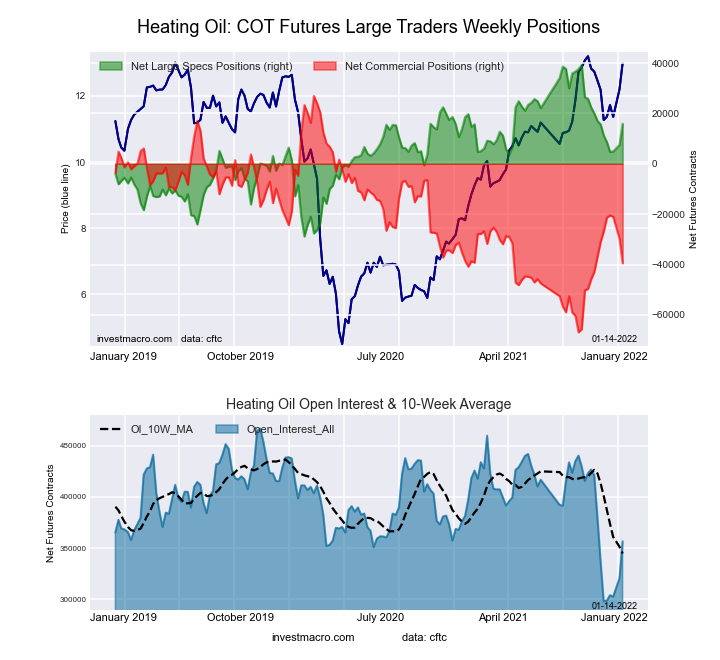 The #2 Heating Oil NY-Harbor Futures large speculator standing this week reached a net position of 15,875 contracts in the data reported through Tuesday. This was a weekly increase of 8,383 contracts from the previous week which had a total of 7,492 net contracts.
This week’s current strength score (the trader positioning range over the past three years, measured from 0 to 100) shows the speculators are currently Bullish with a score of 65.8 percent. The commercials are Bearish with a score of 29.2 percent and the small traders (not shown in chart) are Bullish-Extreme with a score of 80.1 percent.
| Heating Oil Futures Statistics | SPECULATORS | COMMERCIALS | SMALL TRADERS |
| – Percent of Open Interest Longs: | 15.7 | 50.8 | 13.3 |
| – Percent of Open Interest Shorts: | 11.2 | 61.9 | 6.6 |
| – Net Position: | 15,875 | -39,484 | 23,609 |
| – Gross Longs: | 55,887 | 181,172 | 47,269 |
| – Gross Shorts: | 40,012 | 220,656 | 23,660 |
| – Long to Short Ratio: | 1.4 to 1 | 0.8 to 1 | 2.0 to 1 |
| NET POSITION TREND: | |||
| – Strength Index Score (3 Year Range Pct): | 65.8 | 29.2 | 80.1 |
| – Strength Index Reading (3 Year Range): | Bullish | Bearish | Bullish-Extreme |
| NET POSITION MOVEMENT INDEX: | |||
| – 6-Week Change in Strength Index: | 6.8 | -13.5 | 27.7 |
Bloomberg Commodity Index Futures:
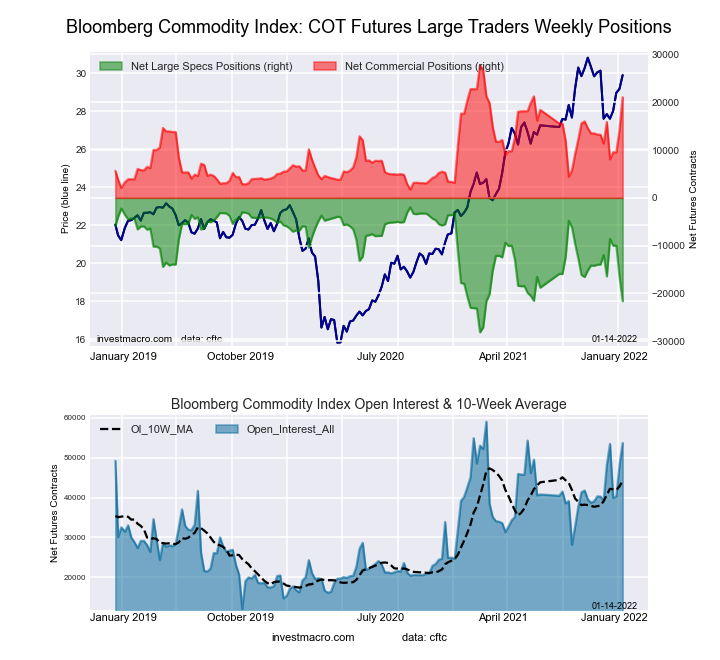 The Bloomberg Commodity Index Futures large speculator standing this week reached a net position of -21,605 contracts in the data reported through Tuesday. This was a weekly fall of -5,088 contracts from the previous week which had a total of -16,517 net contracts.
This week’s current strength score (the trader positioning range over the past three years, measured from 0 to 100) shows the speculators are currently Bearish with a score of 24.8 percent. The commercials are Bullish with a score of 74.2 percent and the small traders (not shown in chart) are Bearish with a score of 39.3 percent.
| Bloomberg Index Futures Statistics | SPECULATORS | COMMERCIALS | SMALL TRADERS |
| – Percent of Open Interest Longs: | 56.6 | 40.3 | 1.1 |
| – Percent of Open Interest Shorts: | 96.8 | 1.1 | 0.0 |
| – Net Position: | -21,605 | 21,047 | 558 |
| – Gross Longs: | 30,391 | 21,647 | 580 |
| – Gross Shorts: | 51,996 | 600 | 22 |
| – Long to Short Ratio: | 0.6 to 1 | 36.1 to 1 | 26.4 to 1 |
| NET POSITION TREND: | |||
| – Strength Index Score (3 Year Range Pct): | 24.8 | 74.2 | 39.3 |
| – Strength Index Reading (3 Year Range): | Bearish | Bullish | Bearish |
| NET POSITION MOVEMENT INDEX: | |||
| – 6-Week Change in Strength Index: | -36.9 | 37.2 | -0.4 |
Article By InvestMacro – Receive our weekly COT Reports by Email
*COT Report: The COT data, released weekly to the public each Friday, is updated through the most recent Tuesday (data is 3 days old) and shows a quick view of how large speculators or non-commercials (for-profit traders) were positioned in the futures markets.
The CFTC categorizes trader positions according to commercial hedgers (traders who use futures contracts for hedging as part of the business), non-commercials (large traders who speculate to realize trading profits) and nonreportable traders (usually small traders/speculators) as well as their open interest (contracts open in the market at time of reporting).See CFTC criteria here.

- The US introduces new import tariffs for 60 countries. Brent crude surpasses $100 per barrel Jul 24, 2026
- USD/JPY Breaks Records: Nothing Slows the Yen’s Decline Jul 24, 2026
- Oil prices reached a 6‑week high. The AUD strengthened on the back of a strong labor‑market report Jul 23, 2026
- EUR/USD Recovers as Dollar Weakens Jul 23, 2026
- Bitcoin rose to $66,000. The New Zealand dollar continues to strengthen Jul 22, 2026
- Inflationary pressure is easing in Canada. In New Zealand, on the contrary, inflation is rising Jul 21, 2026
- GBP/USD Falls After Cabinet Changes Jul 21, 2026
- Geopolitical and macroeconomic conditions continue to pressure market sentiment Jul 20, 2026
- USD/JPY Poised to Continue Gains as Expensive Oil and Lack of Support Weigh on Yen Jul 20, 2026
- COT Metals Charts: Weekly Speculator Bets led by Copper & Steel Jul 18, 2026