
By InvestMacro | COT | Data Tables | COT Leaders | Downloads | COT Newsletter
Here are the latest charts and statistics for the Commitment of Traders (COT) data published by the Commodities Futures Trading Commission (CFTC).
The latest COT data is updated through Tuesday January 11th 2022 and shows a quick view of how large traders (for-profit speculators and commercial entities) were positioned in the futures markets.
Highlighting the COT soft commodities data is the recent sharp declines in the Sugar futures positions. The speculative net position in Sugar futures has dropped for two consecutive weeks and also for six out of the past seven weeks. Bullish bets have now decreased by a total of -126,701 contracts over the past seven weeks and has brought the current bullish position down to its lowest level since June 16th of 2020, a span of 82 weeks. Despite the selloff, Sugar bets remain in bullish territory with a total of 122,925 contracts.
The soft commodities that saw higher bets this week were Coffee (5,603 contracts), Soybeans (7,716 contracts), Soybean Oil (203 contracts) and Cocoa (8,464 contracts) while markets with lower speculator positions were Sugar (-50,062 contracts), Corn (-37,989 contracts), Soybean Meal (-1,855 contracts), Live Cattle (-10,059 contracts), Lean Hogs (-5,735 contracts), Cotton (-3,669 contracts) and Wheat (-5,546 contracts).
| Jan-11-2022 | OI | OI-Index | Spec-Net | Spec-Index | Com-Net | COM-Index | Smalls-Net | Smalls-Index |
|---|---|---|---|---|---|---|---|---|
| WTI Crude | 1,966,615 | 15 | 360,505 | 24 | -396,940 | 68 | 36,435 | 66 |
| Gold | 546,516 | 32 | 199,737 | 51 | -225,073 | 49 | 25,336 | 36 |
| Silver | 144,442 | 11 | 27,548 | 50 | -37,360 | 62 | 9,812 | 0 |
| Copper | 189,678 | 19 | 16,706 | 54 | -22,541 | 44 | 5,835 | 59 |
| Palladium | 9,110 | 12 | -2,978 | 4 | 3,292 | 96 | -314 | 26 |
| Platinum | 59,061 | 20 | 5,289 | 10 | -10,952 | 93 | 5,663 | 41 |
| Natural Gas | 1,136,714 | 6 | -122,564 | 42 | 95,136 | 61 | 27,428 | 48 |
| Brent | 215,266 | 51 | -16,691 | 90 | 13,101 | 11 | 3,590 | 58 |
| Heating Oil | 356,728 | 35 | 15,875 | 66 | -39,484 | 29 | 23,609 | 80 |
| Soybeans | 678,613 | 17 | 138,272 | 65 | -104,896 | 41 | -33,376 | 16 |
| Corn | 1,504,234 | 22 | 407,492 | 82 | -366,833 | 20 | -40,659 | 20 |
| Coffee | 265,514 | 33 | 60,168 | 92 | -63,594 | 10 | 3,426 | 12 |
| Sugar | 883,009 | 14 | 122,925 | 62 | -134,491 | 43 | 11,566 | 22 |
| Wheat | 369,218 | 18 | -1,466 | 46 | 12,111 | 53 | -10,645 | 51 |
Free Reports:
 Sign Up for Our Stock Market Newsletter – Get updated on News, Charts & Rankings of Public Companies when you join our Stocks Newsletter
 Get our Weekly Commitment of Traders Reports - See where the biggest traders (Hedge Funds and Commercial Hedgers) are positioned in the futures markets on a weekly basis.
CORN Futures:
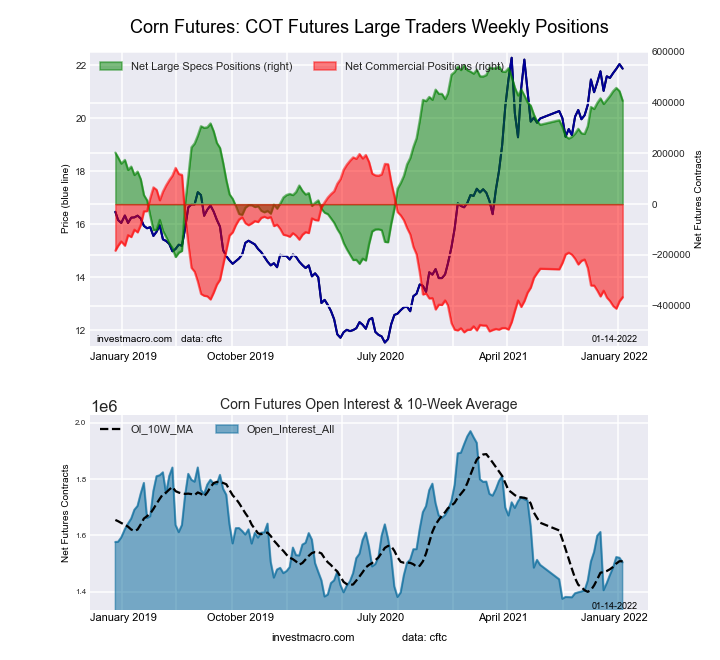 The CORN large speculator standing this week came in at a net position of 407,492 contracts in the data reported through Tuesday. This was a weekly lowering of -37,989 contracts from the previous week which had a total of 445,481 net contracts.
This week’s current strength score (the trader positioning range over the past three years, measured from 0 to 100) shows the speculators are currently Bullish-Extreme with a score of 82.1 percent. The commercials are Bearish-Extreme with a score of 19.7 percent and the small traders (not shown in chart) are Bearish-Extreme with a score of 19.6 percent.
| CORN Futures Statistics | SPECULATORS | COMMERCIALS | SMALL TRADERS |
| – Percent of Open Interest Longs: | 32.7 | 45.6 | 9.2 |
| – Percent of Open Interest Shorts: | 5.6 | 70.0 | 11.9 |
| – Net Position: | 407,492 | -366,833 | -40,659 |
| – Gross Longs: | 491,328 | 686,116 | 138,699 |
| – Gross Shorts: | 83,836 | 1,052,949 | 179,358 |
| – Long to Short Ratio: | 5.9 to 1 | 0.7 to 1 | 0.8 to 1 |
| NET POSITION TREND: | |||
| – Strength Index Score (3 Year Range Pct): | 82.1 | 19.7 | 19.6 |
| – Strength Index Reading (3 Year Range): | Bullish-Extreme | Bearish-Extreme | Bearish-Extreme |
| NET POSITION MOVEMENT INDEX: | |||
| – 6-Week Change in Strength Index: | 1.6 | -3.7 | 7.6 |
SUGAR Futures:
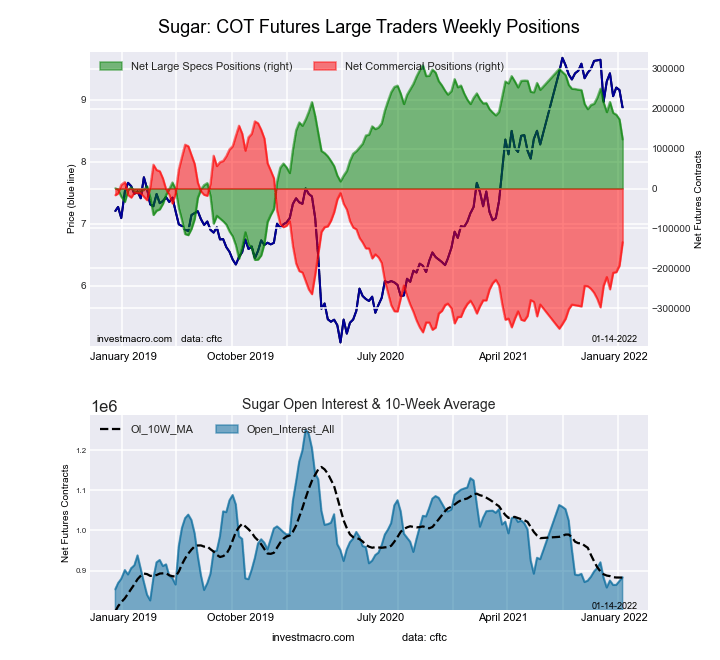 The SUGAR large speculator standing this week came in at a net position of 122,925 contracts in the data reported through Tuesday. This was a weekly reduction of -50,062 contracts from the previous week which had a total of 172,987 net contracts.
This week’s current strength score (the trader positioning range over the past three years, measured from 0 to 100) shows the speculators are currently Bullish with a score of 61.9 percent. The commercials are Bearish with a score of 42.7 percent and the small traders (not shown in chart) are Bearish with a score of 22.2 percent.
| SUGAR Futures Statistics | SPECULATORS | COMMERCIALS | SMALL TRADERS |
| – Percent of Open Interest Longs: | 23.9 | 52.9 | 8.6 |
| – Percent of Open Interest Shorts: | 10.0 | 68.2 | 7.3 |
| – Net Position: | 122,925 | -134,491 | 11,566 |
| – Gross Longs: | 211,346 | 467,336 | 75,986 |
| – Gross Shorts: | 88,421 | 601,827 | 64,420 |
| – Long to Short Ratio: | 2.4 to 1 | 0.8 to 1 | 1.2 to 1 |
| NET POSITION TREND: | |||
| – Strength Index Score (3 Year Range Pct): | 61.9 | 42.7 | 22.2 |
| – Strength Index Reading (3 Year Range): | Bullish | Bearish | Bearish |
| NET POSITION MOVEMENT INDEX: | |||
| – 6-Week Change in Strength Index: | -18.9 | 20.6 | -20.2 |
COFFEE Futures:
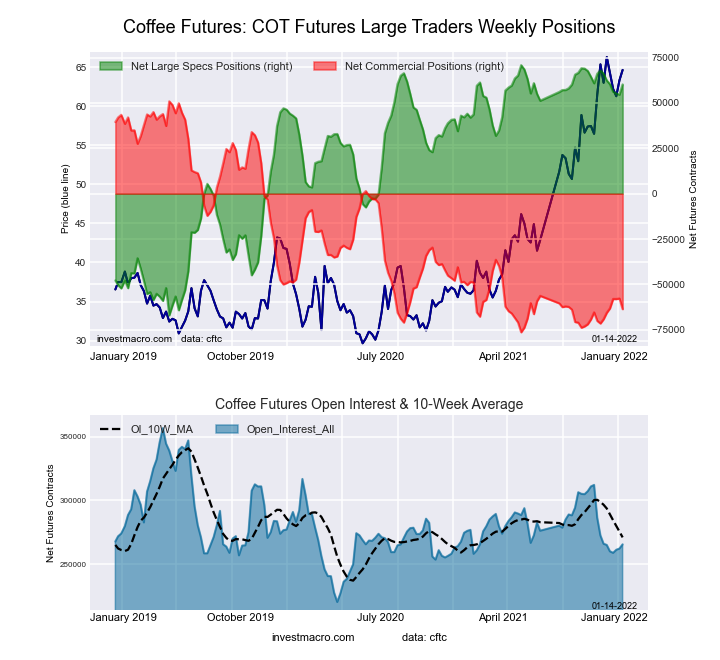 The COFFEE large speculator standing this week came in at a net position of 60,168 contracts in the data reported through Tuesday. This was a weekly boost of 5,603 contracts from the previous week which had a total of 54,565 net contracts.
This week’s current strength score (the trader positioning range over the past three years, measured from 0 to 100) shows the speculators are currently Bullish-Extreme with a score of 92.3 percent. The commercials are Bearish-Extreme with a score of 10.0 percent and the small traders (not shown in chart) are Bearish-Extreme with a score of 12.0 percent.
| COFFEE Futures Statistics | SPECULATORS | COMMERCIALS | SMALL TRADERS |
| – Percent of Open Interest Longs: | 27.1 | 45.2 | 3.8 |
| – Percent of Open Interest Shorts: | 4.4 | 69.2 | 2.5 |
| – Net Position: | 60,168 | -63,594 | 3,426 |
| – Gross Longs: | 71,875 | 120,077 | 10,072 |
| – Gross Shorts: | 11,707 | 183,671 | 6,646 |
| – Long to Short Ratio: | 6.1 to 1 | 0.7 to 1 | 1.5 to 1 |
| NET POSITION TREND: | |||
| – Strength Index Score (3 Year Range Pct): | 92.3 | 10.0 | 12.0 |
| – Strength Index Reading (3 Year Range): | Bullish-Extreme | Bearish-Extreme | Bearish-Extreme |
| NET POSITION MOVEMENT INDEX: | |||
| – 6-Week Change in Strength Index: | -4.3 | 4.4 | 2.1 |
SOYBEANS Futures:
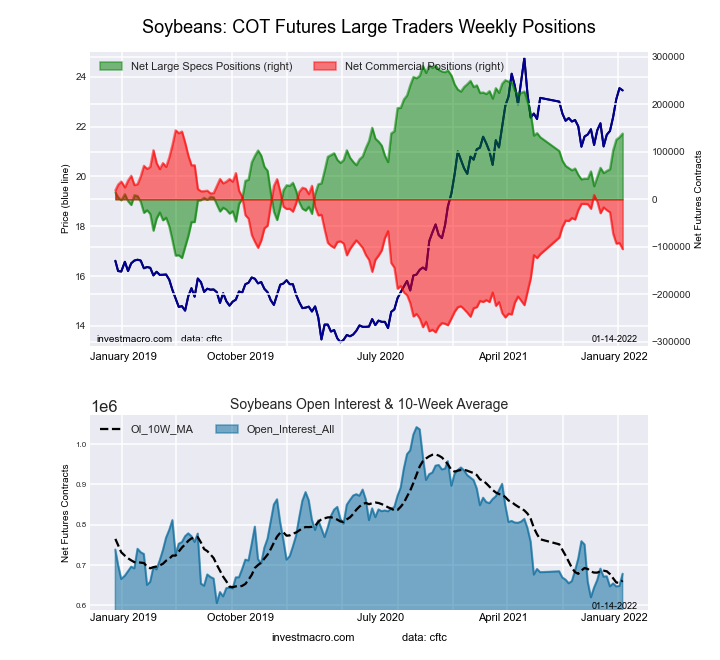 The SOYBEANS large speculator standing this week came in at a net position of 138,272 contracts in the data reported through Tuesday. This was a weekly increase of 7,716 contracts from the previous week which had a total of 130,556 net contracts.
This week’s current strength score (the trader positioning range over the past three years, measured from 0 to 100) shows the speculators are currently Bullish with a score of 64.5 percent. The commercials are Bearish with a score of 41.1 percent and the small traders (not shown in chart) are Bearish-Extreme with a score of 16.3 percent.
| SOYBEANS Futures Statistics | SPECULATORS | COMMERCIALS | SMALL TRADERS |
| – Percent of Open Interest Longs: | 26.8 | 51.7 | 7.2 |
| – Percent of Open Interest Shorts: | 6.4 | 67.2 | 12.2 |
| – Net Position: | 138,272 | -104,896 | -33,376 |
| – Gross Longs: | 181,722 | 350,999 | 49,108 |
| – Gross Shorts: | 43,450 | 455,895 | 82,484 |
| – Long to Short Ratio: | 4.2 to 1 | 0.8 to 1 | 0.6 to 1 |
| NET POSITION TREND: | |||
| – Strength Index Score (3 Year Range Pct): | 64.5 | 41.1 | 16.3 |
| – Strength Index Reading (3 Year Range): | Bullish | Bearish | Bearish-Extreme |
| NET POSITION MOVEMENT INDEX: | |||
| – 6-Week Change in Strength Index: | 20.5 | -20.7 | 8.2 |
SOYBEAN MEAL Futures:
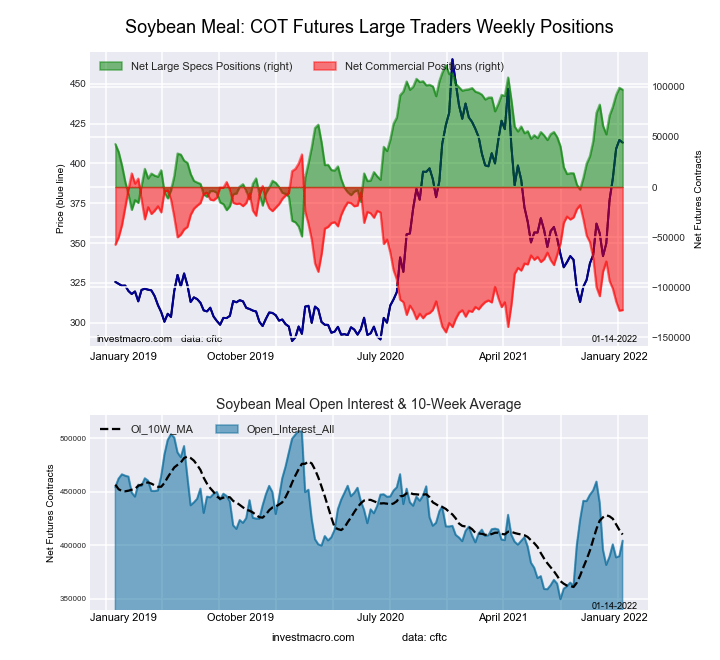 The SOYBEAN MEAL large speculator standing this week came in at a net position of 97,174 contracts in the data reported through Tuesday. This was a weekly decrease of -1,855 contracts from the previous week which had a total of 99,029 net contracts.
This week’s current strength score (the trader positioning range over the past three years, measured from 0 to 100) shows the speculators are currently Bullish-Extreme with a score of 85.7 percent. The commercials are Bearish-Extreme with a score of 12.5 percent and the small traders (not shown in chart) are Bullish with a score of 73.5 percent.
| SOYBEAN MEAL Futures Statistics | SPECULATORS | COMMERCIALS | SMALL TRADERS |
| – Percent of Open Interest Longs: | 29.1 | 45.6 | 11.8 |
| – Percent of Open Interest Shorts: | 5.1 | 76.0 | 5.4 |
| – Net Position: | 97,174 | -122,834 | 25,660 |
| – Gross Longs: | 117,747 | 184,194 | 47,671 |
| – Gross Shorts: | 20,573 | 307,028 | 22,011 |
| – Long to Short Ratio: | 5.7 to 1 | 0.6 to 1 | 2.2 to 1 |
| NET POSITION TREND: | |||
| – Strength Index Score (3 Year Range Pct): | 85.7 | 12.5 | 73.5 |
| – Strength Index Reading (3 Year Range): | Bullish-Extreme | Bearish-Extreme | Bullish |
| NET POSITION MOVEMENT INDEX: | |||
| – 6-Week Change in Strength Index: | 21.1 | -21.7 | 9.6 |
LIVE CATTLE Futures:
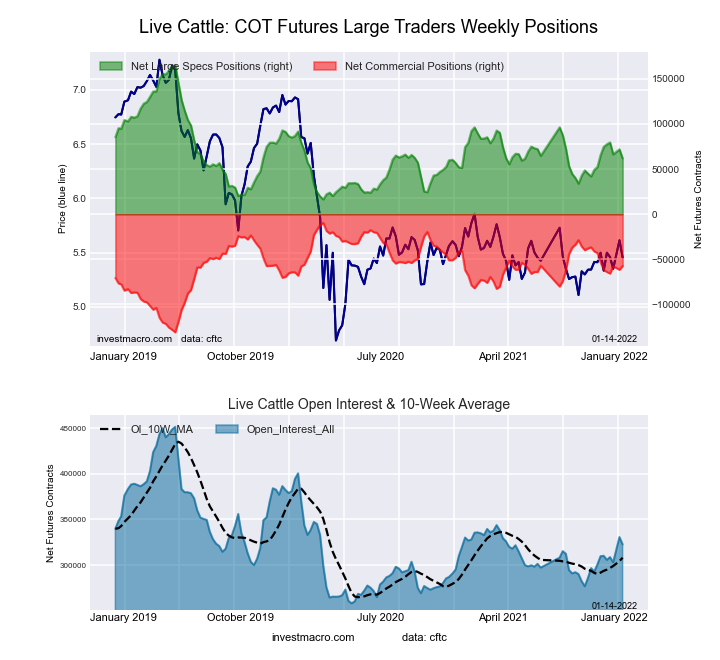 The LIVE CATTLE large speculator standing this week came in at a net position of 61,820 contracts in the data reported through Tuesday. This was a weekly reduction of -10,059 contracts from the previous week which had a total of 71,879 net contracts.
This week’s current strength score (the trader positioning range over the past three years, measured from 0 to 100) shows the speculators are currently Bearish with a score of 30.5 percent. The commercials are Bullish with a score of 60.7 percent and the small traders (not shown in chart) are Bullish with a score of 76.2 percent.
| LIVE CATTLE Futures Statistics | SPECULATORS | COMMERCIALS | SMALL TRADERS |
| – Percent of Open Interest Longs: | 33.9 | 37.7 | 11.3 |
| – Percent of Open Interest Shorts: | 14.8 | 55.5 | 12.7 |
| – Net Position: | 61,820 | -57,315 | -4,505 |
| – Gross Longs: | 109,427 | 121,792 | 36,522 |
| – Gross Shorts: | 47,607 | 179,107 | 41,027 |
| – Long to Short Ratio: | 2.3 to 1 | 0.7 to 1 | 0.9 to 1 |
| NET POSITION TREND: | |||
| – Strength Index Score (3 Year Range Pct): | 30.5 | 60.7 | 76.2 |
| – Strength Index Reading (3 Year Range): | Bearish | Bullish | Bullish |
| NET POSITION MOVEMENT INDEX: | |||
| – 6-Week Change in Strength Index: | -8.6 | 3.7 | 20.3 |
LEAN HOGS Futures:
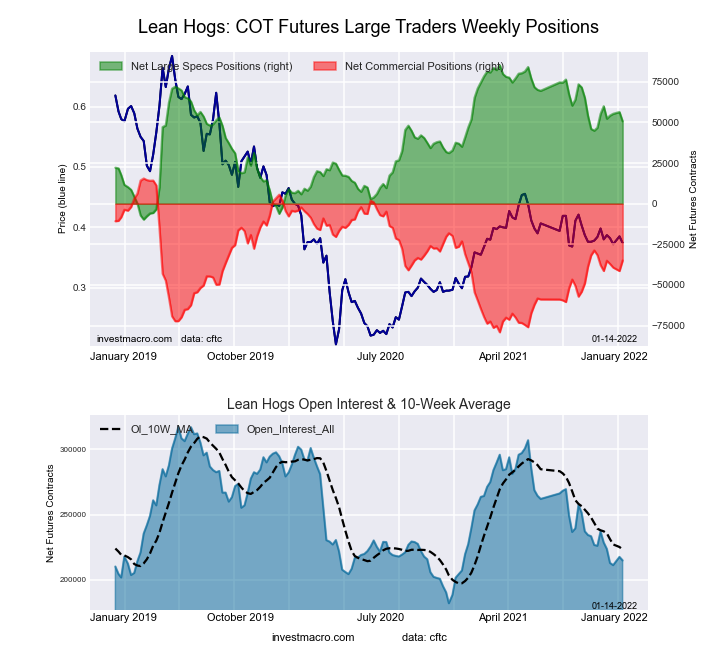 The LEAN HOGS large speculator standing this week came in at a net position of 50,654 contracts in the data reported through Tuesday. This was a weekly fall of -5,735 contracts from the previous week which had a total of 56,389 net contracts.
This week’s current strength score (the trader positioning range over the past three years, measured from 0 to 100) shows the speculators are currently Bullish with a score of 63.4 percent. The commercials are Bearish with a score of 46.7 percent and the small traders (not shown in chart) are Bearish-Extreme with a score of 12.3 percent.
| LEAN HOGS Futures Statistics | SPECULATORS | COMMERCIALS | SMALL TRADERS |
| – Percent of Open Interest Longs: | 38.7 | 37.1 | 8.1 |
| – Percent of Open Interest Shorts: | 15.1 | 53.4 | 15.5 |
| – Net Position: | 50,654 | -34,939 | -15,715 |
| – Gross Longs: | 83,199 | 79,836 | 17,516 |
| – Gross Shorts: | 32,545 | 114,775 | 33,231 |
| – Long to Short Ratio: | 2.6 to 1 | 0.7 to 1 | 0.5 to 1 |
| NET POSITION TREND: | |||
| – Strength Index Score (3 Year Range Pct): | 63.4 | 46.7 | 12.3 |
| – Strength Index Reading (3 Year Range): | Bullish | Bearish | Bearish-Extreme |
| NET POSITION MOVEMENT INDEX: | |||
| – 6-Week Change in Strength Index: | -9.7 | 6.8 | 12.3 |
COTTON Futures:
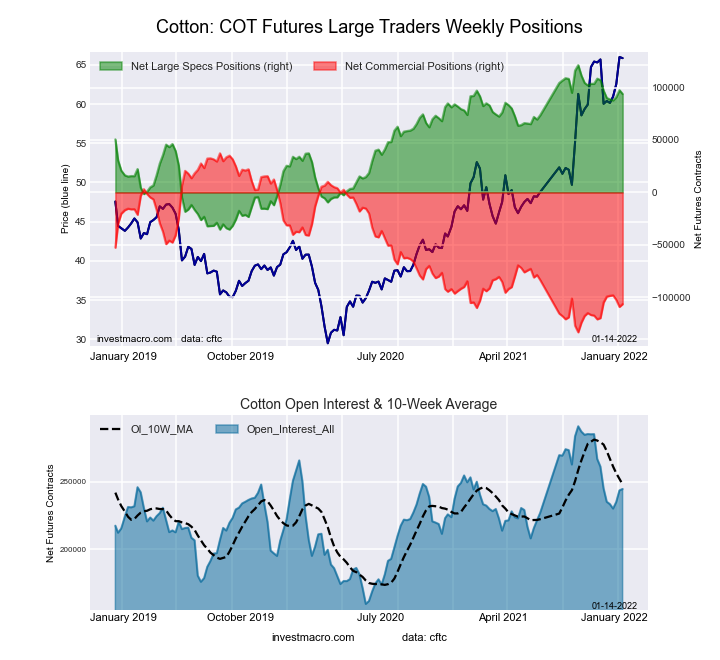 The COTTON large speculator standing this week came in at a net position of 93,822 contracts in the data reported through Tuesday. This was a weekly lowering of -3,669 contracts from the previous week which had a total of 97,491 net contracts.
This week’s current strength score (the trader positioning range over the past three years, measured from 0 to 100) shows the speculators are currently Bullish-Extreme with a score of 82.5 percent. The commercials are Bearish-Extreme with a score of 15.7 percent and the small traders (not shown in chart) are Bullish-Extreme with a score of 92.5 percent.
| COTTON Futures Statistics | SPECULATORS | COMMERCIALS | SMALL TRADERS |
| – Percent of Open Interest Longs: | 43.2 | 33.7 | 8.3 |
| – Percent of Open Interest Shorts: | 4.8 | 77.2 | 3.1 |
| – Net Position: | 93,822 | -106,469 | 12,647 |
| – Gross Longs: | 105,640 | 82,317 | 20,226 |
| – Gross Shorts: | 11,818 | 188,786 | 7,579 |
| – Long to Short Ratio: | 8.9 to 1 | 0.4 to 1 | 2.7 to 1 |
| NET POSITION TREND: | |||
| – Strength Index Score (3 Year Range Pct): | 82.5 | 15.7 | 92.5 |
| – Strength Index Reading (3 Year Range): | Bullish-Extreme | Bearish-Extreme | Bullish-Extreme |
| NET POSITION MOVEMENT INDEX: | |||
| – 6-Week Change in Strength Index: | -2.0 | -0.9 | 29.7 |
COCOA Futures:
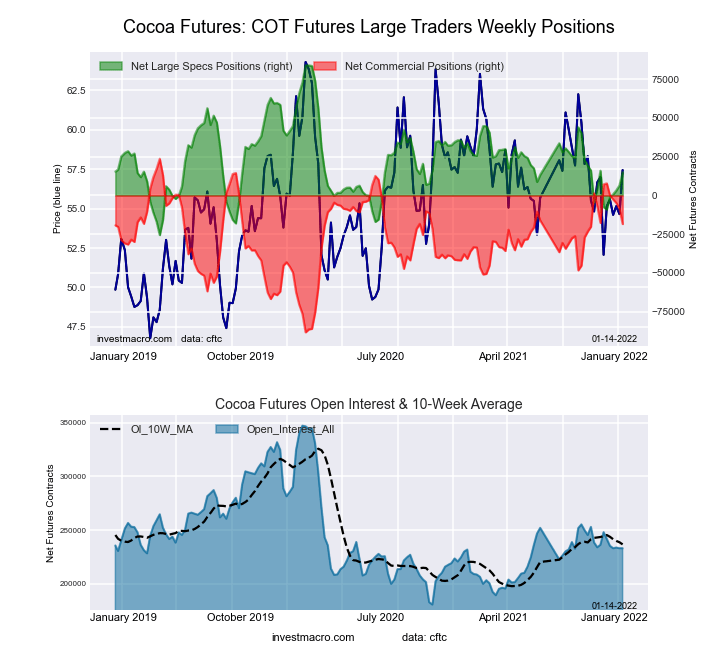 The COCOA large speculator standing this week came in at a net position of 14,933 contracts in the data reported through Tuesday. This was a weekly lift of 8,464 contracts from the previous week which had a total of 6,469 net contracts.
This week’s current strength score (the trader positioning range over the past three years, measured from 0 to 100) shows the speculators are currently Bearish with a score of 36.9 percent. The commercials are Bullish with a score of 62.4 percent and the small traders (not shown in chart) are Bearish with a score of 48.3 percent.
| COCOA Futures Statistics | SPECULATORS | COMMERCIALS | SMALL TRADERS |
| – Percent of Open Interest Longs: | 25.8 | 51.5 | 5.3 |
| – Percent of Open Interest Shorts: | 19.4 | 59.4 | 3.8 |
| – Net Position: | 14,933 | -18,436 | 3,503 |
| – Gross Longs: | 60,198 | 120,080 | 12,262 |
| – Gross Shorts: | 45,265 | 138,516 | 8,759 |
| – Long to Short Ratio: | 1.3 to 1 | 0.9 to 1 | 1.4 to 1 |
| NET POSITION TREND: | |||
| – Strength Index Score (3 Year Range Pct): | 36.9 | 62.4 | 48.3 |
| – Strength Index Reading (3 Year Range): | Bearish | Bullish | Bearish |
| NET POSITION MOVEMENT INDEX: | |||
| – 6-Week Change in Strength Index: | 20.5 | -22.9 | 35.8 |
WHEAT Futures:
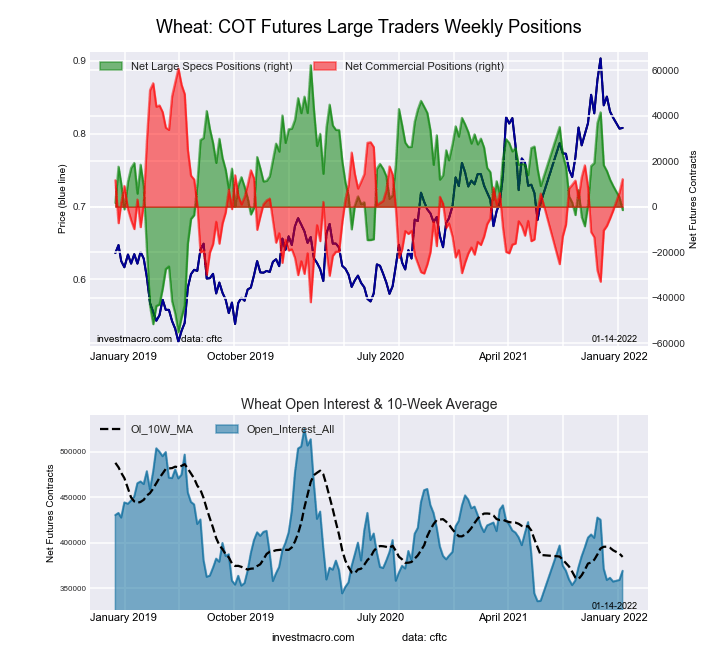 The WHEAT large speculator standing this week came in at a net position of -1,466 contracts in the data reported through Tuesday. This was a weekly decline of -5,546 contracts from the previous week which had a total of 4,080 net contracts.
This week’s current strength score (the trader positioning range over the past three years, measured from 0 to 100) shows the speculators are currently Bearish with a score of 45.8 percent. The commercials are Bullish with a score of 52.6 percent and the small traders (not shown in chart) are Bullish with a score of 50.7 percent.
| WHEAT Futures Statistics | SPECULATORS | COMMERCIALS | SMALL TRADERS |
| – Percent of Open Interest Longs: | 27.2 | 41.4 | 7.9 |
| – Percent of Open Interest Shorts: | 27.6 | 38.2 | 10.8 |
| – Net Position: | -1,466 | 12,111 | -10,645 |
| – Gross Longs: | 100,415 | 152,998 | 29,242 |
| – Gross Shorts: | 101,881 | 140,887 | 39,887 |
| – Long to Short Ratio: | 1.0 to 1 | 1.1 to 1 | 0.7 to 1 |
| NET POSITION TREND: | |||
| – Strength Index Score (3 Year Range Pct): | 45.8 | 52.6 | 50.7 |
| – Strength Index Reading (3 Year Range): | Bearish | Bullish | Bullish |
| NET POSITION MOVEMENT INDEX: | |||
| – 6-Week Change in Strength Index: | -16.8 | 21.9 | -13.3 |
Article By InvestMacro – Receive our weekly COT Reports by Email
*COT Report: The COT data, released weekly to the public each Friday, is updated through the most recent Tuesday (data is 3 days old) and shows a quick view of how large speculators or non-commercials (for-profit traders) were positioned in the futures markets.
The CFTC categorizes trader positions according to commercial hedgers (traders who use futures contracts for hedging as part of the business), non-commercials (large traders who speculate to realize trading profits) and nonreportable traders (usually small traders/speculators) as well as their open interest (contracts open in the market at time of reporting).See CFTC criteria here.

- The US introduces new import tariffs for 60 countries. Brent crude surpasses $100 per barrel Jul 24, 2026
- USD/JPY Breaks Records: Nothing Slows the Yen’s Decline Jul 24, 2026
- Oil prices reached a 6‑week high. The AUD strengthened on the back of a strong labor‑market report Jul 23, 2026
- EUR/USD Recovers as Dollar Weakens Jul 23, 2026
- Bitcoin rose to $66,000. The New Zealand dollar continues to strengthen Jul 22, 2026
- Inflationary pressure is easing in Canada. In New Zealand, on the contrary, inflation is rising Jul 21, 2026
- GBP/USD Falls After Cabinet Changes Jul 21, 2026
- Geopolitical and macroeconomic conditions continue to pressure market sentiment Jul 20, 2026
- USD/JPY Poised to Continue Gains as Expensive Oil and Lack of Support Weigh on Yen Jul 20, 2026
- COT Metals Charts: Weekly Speculator Bets led by Copper & Steel Jul 18, 2026