
By InvestMacro | COT | Data Tables | COT Leaders | Downloads | COT Newsletter
Here are the latest charts and statistics for the Commitment of Traders (COT) data published by the Commodities Futures Trading Commission (CFTC). The latest release was delayed by the CFTC due to the Christmas holiday.
The latest COT data is updated through Tuesday December 21st 2021 and shows a quick view of how large traders (for-profit speculators and commercial entities) were positioned in the futures markets.
Highlighting the COT stock market data is the decreasing VIX Volatility futures bearish bets. The speculative net position in the VIX futures saw bearish bets drop by more than 13,000 contracts for the fourth time out of the past six weeks and VIX bearish bets have now fallen for four straight weeks (by a total of 50,327 contracts over that time-frame). Overall, the VIX net speculator position (currently sitting at -31,609 contracts) is at the least bearish level since May 5th of 2020, a span of eighty-five weeks.
The stock markets that saw higher speculator bets this week were VIX (13,341 contracts), Russell 2000 Mini (15,541 contracts), Nikkei 225 USD (352 contracts) and the MSCI EAFE Mini (6,589 contracts).
The markets with lower speculator bets this week were the S&P500 Mini (-31,393 contracts), Dow Jones Industrial Average Mini (-2,588 contracts), Nasdaq Mini (-8,103 contracts) and the MSCI Emerging Markets Mini (-2,219 contracts).
Free Reports:
 Get our Weekly Commitment of Traders Reports - See where the biggest traders (Hedge Funds and Commercial Hedgers) are positioned in the futures markets on a weekly basis.
 Download Our Metatrader 4 Indicators – Put Our Free MetaTrader 4 Custom Indicators on your charts when you join our Weekly Newsletter
| Dec-21-2021 | OI | OI-Index | Spec-Net | Spec-Index | Com-Net | COM-Index | Smalls-Net | Smalls-Index |
|---|---|---|---|---|---|---|---|---|
| S&P500-Mini | 2,262,123 | 0 | 136,381 | 91 | -177,187 | 34 | 40,806 | 35 |
| Nikkei 225 | 15,333 | 3 | -7,462 | 31 | 6,657 | 75 | 805 | 37 |
| Nasdaq-Mini | 208,070 | 18 | 25,360 | 89 | -27,271 | 10 | 1,911 | 48 |
| DowJones-Mini | 91,384 | 58 | -9,265 | 24 | 4,786 | 68 | 4,479 | 62 |
| VIX | 289,170 | 24 | -31,609 | 72 | 40,247 | 31 | -8,638 | 24 |
| Nikkei 225 Yen | 42,400 | 18 | 5,172 | 35 | 12,908 | 69 | -18,080 | 43 |
VIX Volatility Futures:
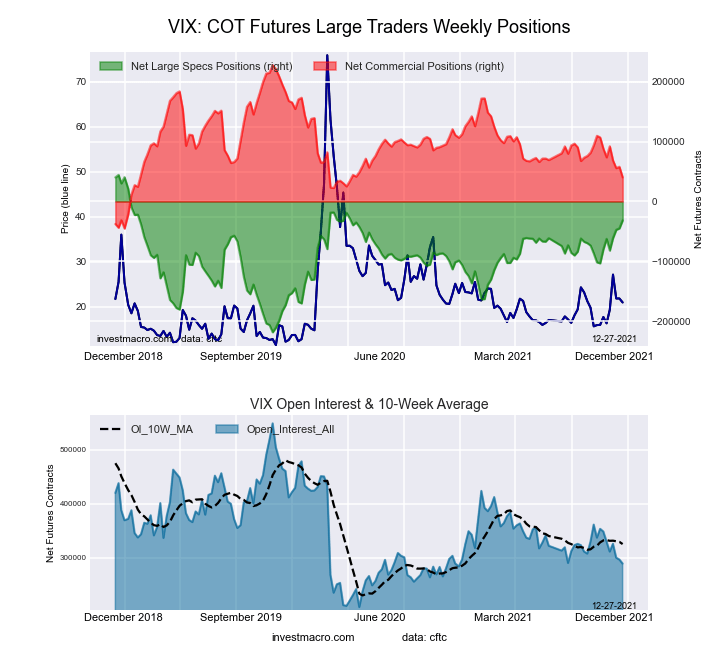 The VIX Volatility large speculator standing this week resulted in a net position of -31,609 contracts in the data reported through Tuesday. This was a weekly boost of 13,341 contracts from the previous week which had a total of -44,950 net contracts.
This week’s current strength score (the trader positioning range over the past three years, measured from 0 to 100) shows the speculators are currently Bullish with a score of 72.2 percent. The commercials are Bearish with a score of 31.3 percent and the small traders (not shown in chart) are Bearish with a score of 23.6 percent.
| VIX Volatility Futures Statistics | SPECULATORS | COMMERCIALS | SMALL TRADERS |
| – Percent of Open Interest Longs: | 23.7 | 47.4 | 6.5 |
| – Percent of Open Interest Shorts: | 34.6 | 33.5 | 9.5 |
| – Net Position: | -31,609 | 40,247 | -8,638 |
| – Gross Longs: | 68,394 | 137,135 | 18,761 |
| – Gross Shorts: | 100,003 | 96,888 | 27,399 |
| – Long to Short Ratio: | 0.7 to 1 | 1.4 to 1 | 0.7 to 1 |
| NET POSITION TREND: | |||
| – Strength Index Score (3 Year Range Pct): | 72.2 | 31.3 | 23.6 |
| – Strength Index Reading (3 Year Range): | Bullish | Bearish | Bearish |
| NET POSITION MOVEMENT INDEX: | |||
| – 6-Week Change in Strength Index: | 18.7 | -17.5 | -1.9 |
S&P500 Mini Futures:
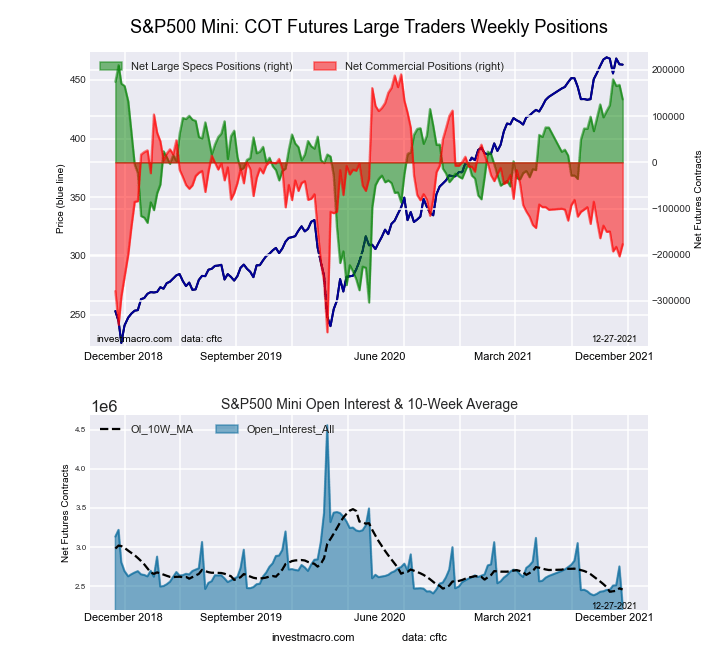 The S&P500 Mini large speculator standing this week resulted in a net position of 136,381 contracts in the data reported through Tuesday. This was a weekly reduction of -31,393 contracts from the previous week which had a total of 167,774 net contracts.
This week’s current strength score (the trader positioning range over the past three years, measured from 0 to 100) shows the speculators are currently Bullish-Extreme with a score of 91.0 percent. The commercials are Bearish with a score of 34.2 percent and the small traders (not shown in chart) are Bearish with a score of 34.9 percent.
| S&P500 Mini Futures Statistics | SPECULATORS | COMMERCIALS | SMALL TRADERS |
| – Percent of Open Interest Longs: | 18.3 | 68.0 | 11.7 |
| – Percent of Open Interest Shorts: | 12.3 | 75.8 | 9.9 |
| – Net Position: | 136,381 | -177,187 | 40,806 |
| – Gross Longs: | 414,346 | 1,538,034 | 265,524 |
| – Gross Shorts: | 277,965 | 1,715,221 | 224,718 |
| – Long to Short Ratio: | 1.5 to 1 | 0.9 to 1 | 1.2 to 1 |
| NET POSITION TREND: | |||
| – Strength Index Score (3 Year Range Pct): | 91.0 | 34.2 | 34.9 |
| – Strength Index Reading (3 Year Range): | Bullish-Extreme | Bearish | Bearish |
| NET POSITION MOVEMENT INDEX: | |||
| – 6-Week Change in Strength Index: | 8.0 | -7.2 | 0.3 |
Dow Jones Mini Futures:
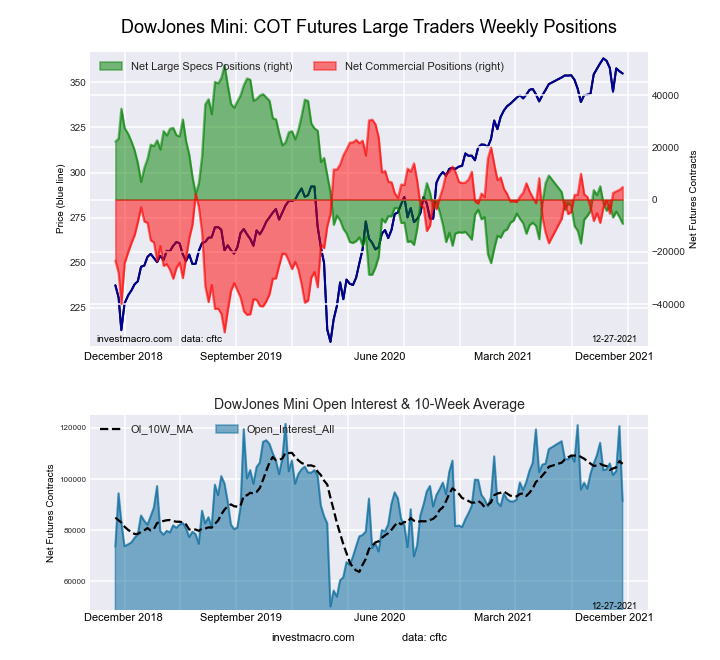 The Dow Jones Mini large speculator standing this week resulted in a net position of -9,265 contracts in the data reported through Tuesday. This was a weekly decline of -2,588 contracts from the previous week which had a total of -6,677 net contracts.
This week’s current strength score (the trader positioning range over the past three years, measured from 0 to 100) shows the speculators are currently Bearish with a score of 24.3 percent. The commercials are Bullish with a score of 68.3 percent and the small traders (not shown in chart) are Bullish with a score of 62.4 percent.
| Dow Jones Mini Futures Statistics | SPECULATORS | COMMERCIALS | SMALL TRADERS |
| – Percent of Open Interest Longs: | 29.9 | 51.8 | 17.6 |
| – Percent of Open Interest Shorts: | 40.1 | 46.6 | 12.7 |
| – Net Position: | -9,265 | 4,786 | 4,479 |
| – Gross Longs: | 27,362 | 47,350 | 16,117 |
| – Gross Shorts: | 36,627 | 42,564 | 11,638 |
| – Long to Short Ratio: | 0.7 to 1 | 1.1 to 1 | 1.4 to 1 |
| NET POSITION TREND: | |||
| – Strength Index Score (3 Year Range Pct): | 24.3 | 68.3 | 62.4 |
| – Strength Index Reading (3 Year Range): | Bearish | Bullish | Bullish |
| NET POSITION MOVEMENT INDEX: | |||
| – 6-Week Change in Strength Index: | -9.8 | 9.6 | 0.4 |
Nasdaq Mini Futures:
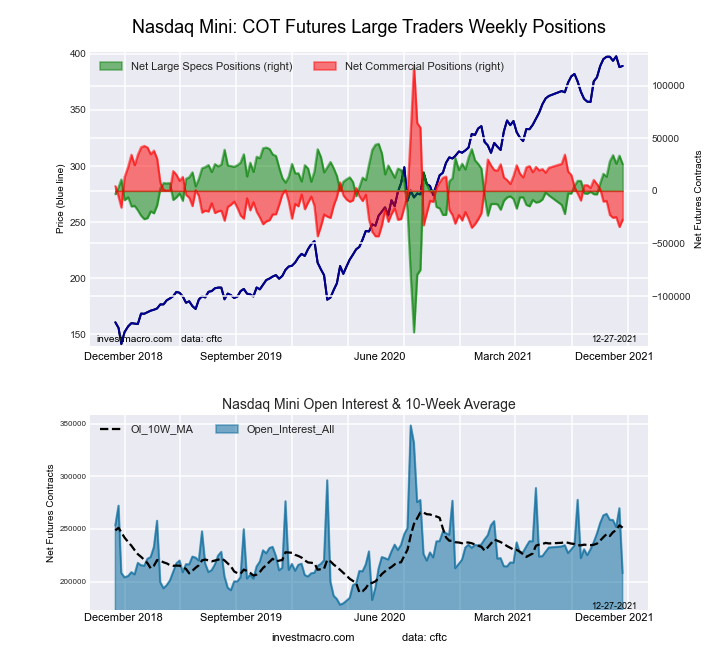 The Nasdaq Mini large speculator standing this week resulted in a net position of 25,360 contracts in the data reported through Tuesday. This was a weekly decrease of -8,103 contracts from the previous week which had a total of 33,463 net contracts.
This week’s current strength score (the trader positioning range over the past three years, measured from 0 to 100) shows the speculators are currently Bullish-Extreme with a score of 89.2 percent. The commercials are Bearish-Extreme with a score of 9.7 percent and the small traders (not shown in chart) are Bearish with a score of 48.3 percent.
| Nasdaq Mini Futures Statistics | SPECULATORS | COMMERCIALS | SMALL TRADERS |
| – Percent of Open Interest Longs: | 34.6 | 46.3 | 18.1 |
| – Percent of Open Interest Shorts: | 22.4 | 59.4 | 17.2 |
| – Net Position: | 25,360 | -27,271 | 1,911 |
| – Gross Longs: | 71,976 | 96,389 | 37,621 |
| – Gross Shorts: | 46,616 | 123,660 | 35,710 |
| – Long to Short Ratio: | 1.5 to 1 | 0.8 to 1 | 1.1 to 1 |
| NET POSITION TREND: | |||
| – Strength Index Score (3 Year Range Pct): | 89.2 | 9.7 | 48.3 |
| – Strength Index Reading (3 Year Range): | Bullish-Extreme | Bearish-Extreme | Bearish |
| NET POSITION MOVEMENT INDEX: | |||
| – 6-Week Change in Strength Index: | 5.1 | -10.6 | 18.1 |
Russell 2000 Mini Futures:
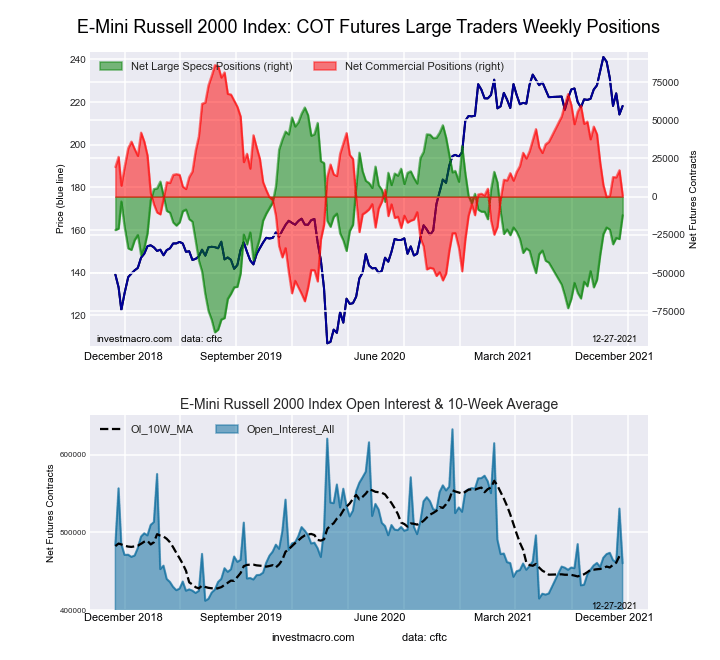 The Russell 2000 Mini large speculator standing this week resulted in a net position of -12,173 contracts in the data reported through Tuesday. This was a weekly lift of 15,541 contracts from the previous week which had a total of -27,714 net contracts.
This week’s current strength score (the trader positioning range over the past three years, measured from 0 to 100) shows the speculators are currently Bullish with a score of 52.1 percent. The commercials are Bearish with a score of 44.7 percent and the small traders (not shown in chart) are Bullish with a score of 65.5 percent.
| Russell 2000 Mini Futures Statistics | SPECULATORS | COMMERCIALS | SMALL TRADERS |
| – Percent of Open Interest Longs: | 16.4 | 76.2 | 6.6 |
| – Percent of Open Interest Shorts: | 19.0 | 76.1 | 4.1 |
| – Net Position: | -12,173 | 682 | 11,491 |
| – Gross Longs: | 75,484 | 350,828 | 30,154 |
| – Gross Shorts: | 87,657 | 350,146 | 18,663 |
| – Long to Short Ratio: | 0.9 to 1 | 1.0 to 1 | 1.6 to 1 |
| NET POSITION TREND: | |||
| – Strength Index Score (3 Year Range Pct): | 52.1 | 44.7 | 65.5 |
| – Strength Index Reading (3 Year Range): | Bullish | Bearish | Bullish |
| NET POSITION MOVEMENT INDEX: | |||
| – 6-Week Change in Strength Index: | 8.4 | -4.4 | -15.5 |
Nikkei Stock Average (USD) Futures:
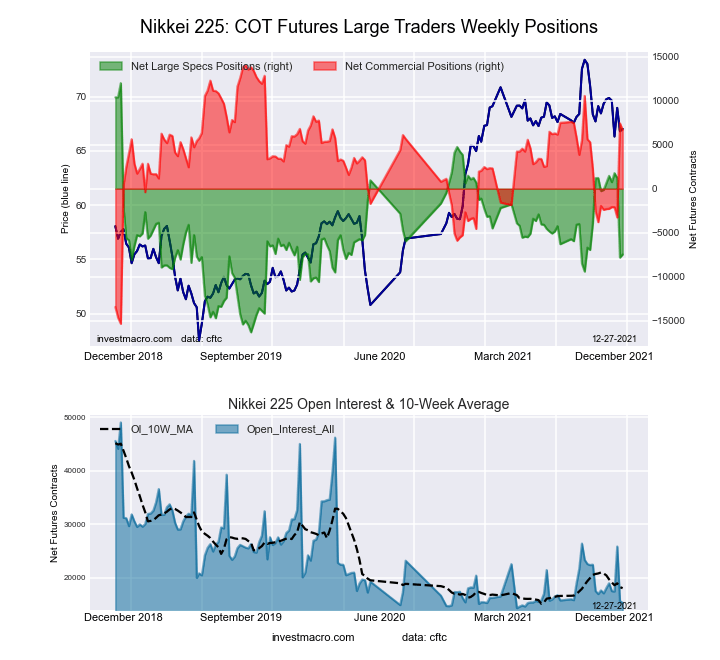 The Nikkei Stock Average (USD) large speculator standing this week resulted in a net position of -7,462 contracts in the data reported through Tuesday. This was a weekly lift of 352 contracts from the previous week which had a total of -7,814 net contracts.
This week’s current strength score (the trader positioning range over the past three years, measured from 0 to 100) shows the speculators are currently Bearish with a score of 31.2 percent. The commercials are Bullish with a score of 74.9 percent and the small traders (not shown in chart) are Bearish with a score of 37.1 percent.
| Nikkei Stock Average Futures Statistics | SPECULATORS | COMMERCIALS | SMALL TRADERS |
| – Percent of Open Interest Longs: | 10.7 | 63.2 | 26.0 |
| – Percent of Open Interest Shorts: | 59.3 | 19.8 | 20.7 |
| – Net Position: | -7,462 | 6,657 | 805 |
| – Gross Longs: | 1,633 | 9,686 | 3,985 |
| – Gross Shorts: | 9,095 | 3,029 | 3,180 |
| – Long to Short Ratio: | 0.2 to 1 | 3.2 to 1 | 1.3 to 1 |
| NET POSITION TREND: | |||
| – Strength Index Score (3 Year Range Pct): | 31.2 | 74.9 | 37.1 |
| – Strength Index Reading (3 Year Range): | Bearish | Bullish | Bearish |
| NET POSITION MOVEMENT INDEX: | |||
| – 6-Week Change in Strength Index: | -28.7 | 30.5 | -10.8 |
MSCI EAFE Mini Futures:
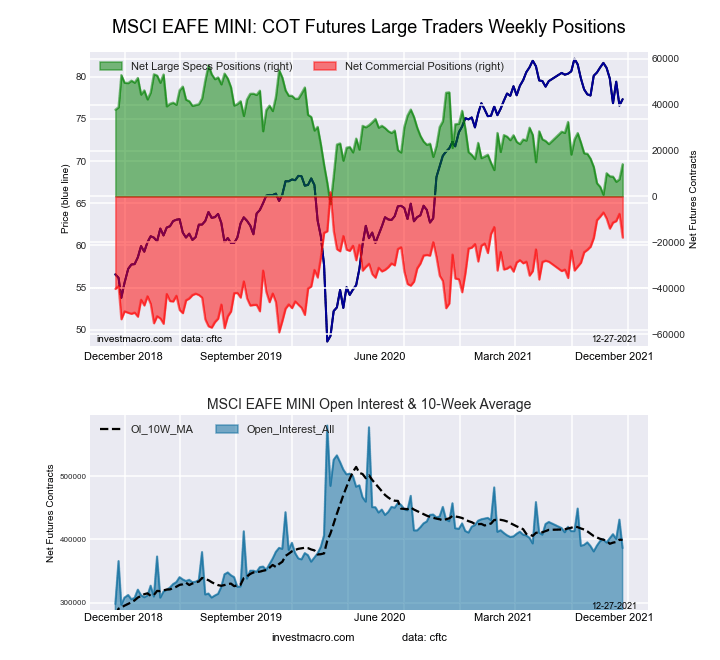 The MSCI EAFE Mini large speculator standing this week resulted in a net position of 14,069 contracts in the data reported through Tuesday. This was a weekly boost of 6,589 contracts from the previous week which had a total of 7,480 net contracts.
This week’s current strength score (the trader positioning range over the past three years, measured from 0 to 100) shows the speculators are currently Bearish with a score of 28.8 percent. The commercials are Bullish with a score of 67.6 percent and the small traders (not shown in chart) are Bullish with a score of 50.9 percent.
| MSCI EAFE Mini Futures Statistics | SPECULATORS | COMMERCIALS | SMALL TRADERS |
| – Percent of Open Interest Longs: | 6.6 | 90.4 | 2.6 |
| – Percent of Open Interest Shorts: | 2.9 | 95.0 | 1.6 |
| – Net Position: | 14,069 | -17,928 | 3,859 |
| – Gross Longs: | 25,328 | 348,940 | 10,059 |
| – Gross Shorts: | 11,259 | 366,868 | 6,200 |
| – Long to Short Ratio: | 2.2 to 1 | 1.0 to 1 | 1.6 to 1 |
| NET POSITION TREND: | |||
| – Strength Index Score (3 Year Range Pct): | 28.8 | 67.6 | 50.9 |
| – Strength Index Reading (3 Year Range): | Bearish | Bullish | Bullish |
| NET POSITION MOVEMENT INDEX: | |||
| – 6-Week Change in Strength Index: | 22.0 | -17.9 | -21.5 |
Article By InvestMacro – Receive our weekly COT Reports by Email
*COT Report: The COT data, released weekly to the public each Friday, is updated through the most recent Tuesday (data is 3 days old) and shows a quick view of how large speculators or non-commercials (for-profit traders) were positioned in the futures markets.
The CFTC categorizes trader positions according to commercial hedgers (traders who use futures contracts for hedging as part of the business), non-commercials (large traders who speculate to realize trading profits) and nonreportable traders (usually small traders/speculators) as well as their open interest (contracts open in the market at time of reporting).See CFTC criteria here.

- The US introduces new import tariffs for 60 countries. Brent crude surpasses $100 per barrel Jul 24, 2026
- USD/JPY Breaks Records: Nothing Slows the Yen’s Decline Jul 24, 2026
- Oil prices reached a 6‑week high. The AUD strengthened on the back of a strong labor‑market report Jul 23, 2026
- EUR/USD Recovers as Dollar Weakens Jul 23, 2026
- Bitcoin rose to $66,000. The New Zealand dollar continues to strengthen Jul 22, 2026
- Inflationary pressure is easing in Canada. In New Zealand, on the contrary, inflation is rising Jul 21, 2026
- GBP/USD Falls After Cabinet Changes Jul 21, 2026
- Geopolitical and macroeconomic conditions continue to pressure market sentiment Jul 20, 2026
- USD/JPY Poised to Continue Gains as Expensive Oil and Lack of Support Weigh on Yen Jul 20, 2026
- COT Metals Charts: Weekly Speculator Bets led by Copper & Steel Jul 18, 2026