Here are the latest charts and statistics for the Commitment of Traders (COT) data published by the Commodities Futures Trading Commission (CFTC).
The latest COT data is updated through Tuesday November 30th 2021 and shows a quick view of how large traders (for-profit speculators and commercial entities) were positioned in the futures markets.
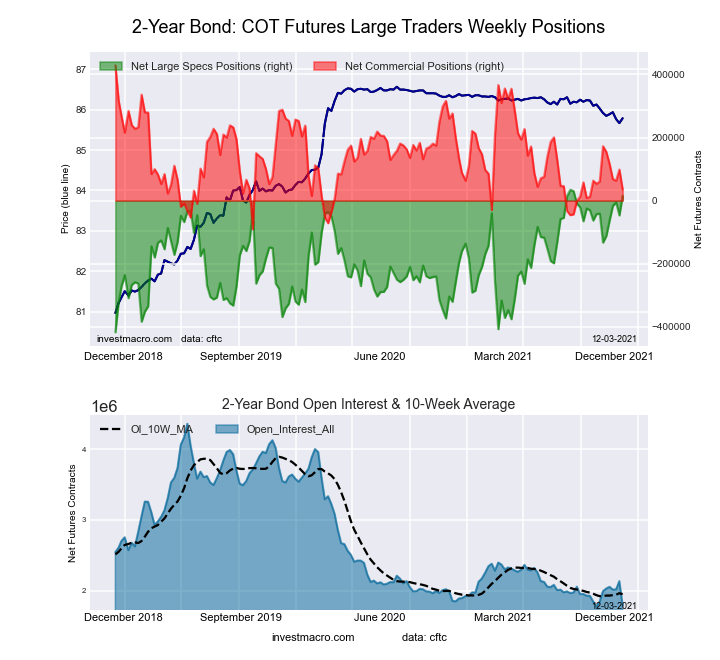
Highlighting this week’s COT bonds data is the 2-Year Bond speculators bets that rose for the fifth time in the past six weeks. Bond speculators have been improving their bets for the 2-Year steadily and have also pushed their bets higher for seven out of the past nine weeks and by a total of +78,499 contracts over that period. This improving sentiment has brought the current net position standing into a bullish level for the first time since August 17th, a span of fifteen weeks. The 2-Year Treasury Note is now one of the only two bond instruments (the other is the Ultra 10-Year U.S. T-Note) in our tracking that have bullish net positions at the moment.
| Nov-30-2021 | OI | OI-Index | Spec-Net | Spec-Index | Com-Net | COM-Index | Smalls-Net | Smalls-Index |
|---|---|---|---|---|---|---|---|---|
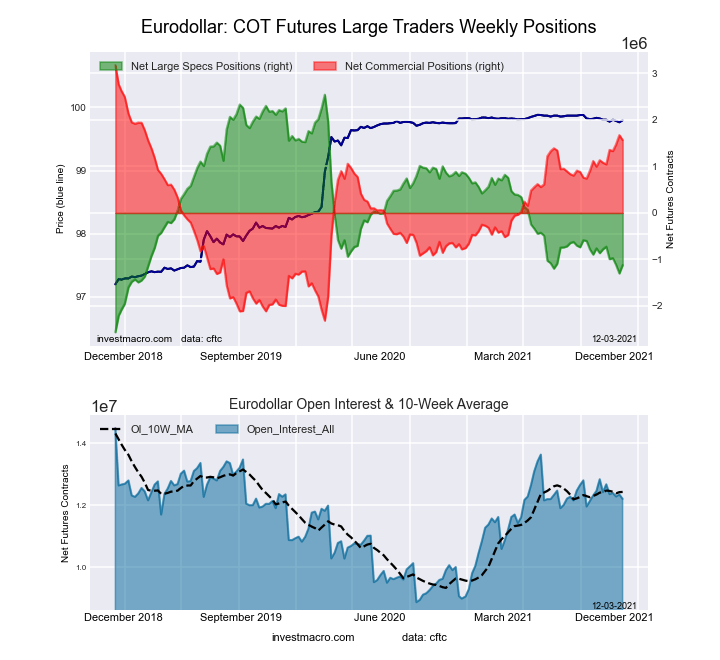
| Eurodollar | 12,207,541 | 59 | -1,121,656 | 28 | 1,568,222 | 71 | -446,566 | 28 |
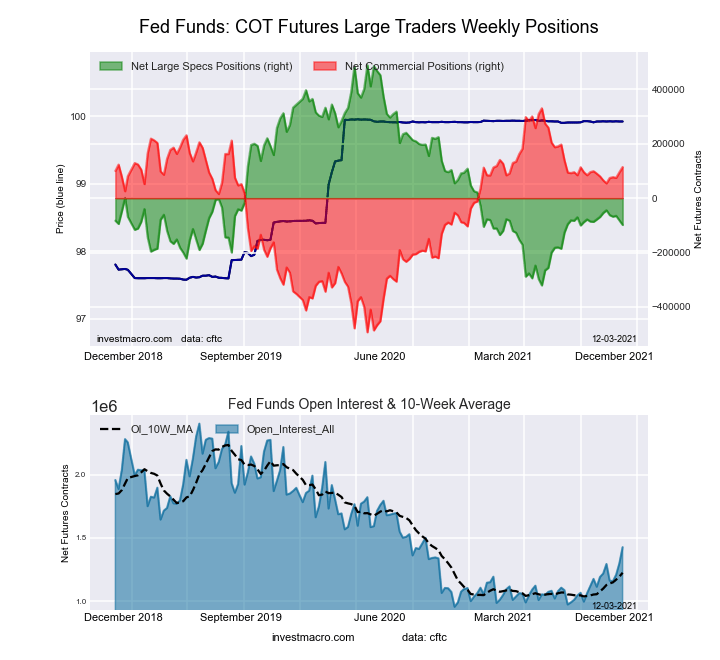
| FedFunds | 1,426,038 | 33 | -98,478 | 27 | 114,396 | 74 | -15,918 | 31 |
| 2-Year | 1,789,196 | 1 | 15,670 | 96 | 35,095 | 24 | -50,765 | 4 |
| Long T-Bond | 1,219,181 | 52 | -49,640 | 76 | 29,588 | 30 | 20,052 | 68 |
| 10-Year | 3,803,125 | 51 | -313,371 | 24 | 567,638 | 93 | -254,267 | 19 |
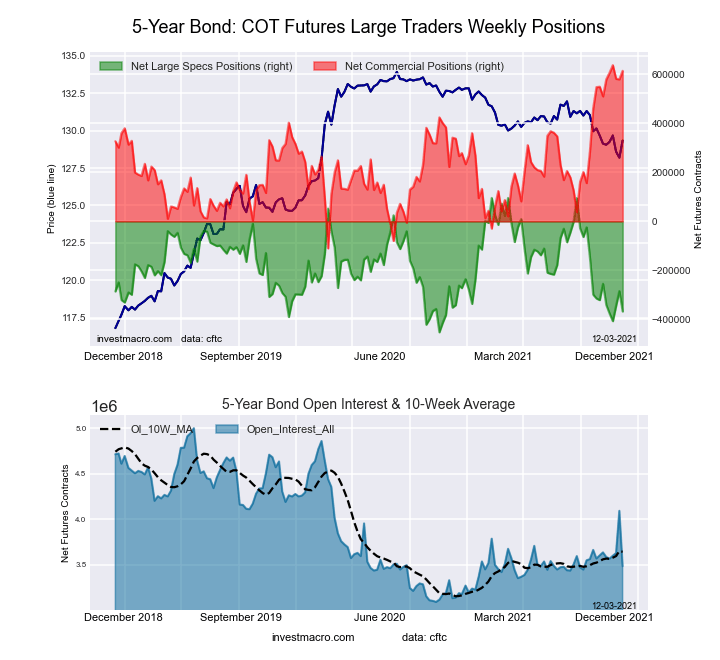
| 5-Year | 3,486,538 | 21 | -367,832 | 16 | 614,453 | 97 | -246,621 | 13 |
This week’s current strength score (the trader positioning range over the past three years, measured from 0 to 100) shows the speculators are currently Bearish with a score of 28.3 percent. The commercials are Bullish with a score of 70.7 percent and the small traders (not shown in chart) are Bearish with a score of 27.9 percent.
Free Reports:
| 3-Month Eurodollars Statistics | SPECULATORS | COMMERCIALS | SMALL TRADERS |
| – Percent of Open Interest Longs: | 12.4 | 66.3 | 3.7 |
| – Percent of Open Interest Shorts: | 21.6 | 53.4 | 7.4 |
| – Net Position: | -1,121,656 | 1,568,222 | -446,566 |
| – Gross Longs: | 1,515,247 | 8,091,297 | 451,347 |
| – Gross Shorts: | 2,636,903 | 6,523,075 | 897,913 |
| – Long to Short Ratio: | 0.6 to 1 | 1.2 to 1 | 0.5 to 1 |
| NET POSITION TREND: | |||
| – COT Index Score (3 Year Range Pct): | 28.3 | 70.7 | 27.9 |
| – COT Index Reading (3 Year Range): | Bearish | Bullish | Bearish |
| NET POSITION MOVEMENT INDEX: | |||
| – 6-Week Change in Strength Index: | -6.7 | 8.9 | -24.9 |
This week’s current strength score (the trader positioning range over the past three years, measured from 0 to 100) shows the speculators are currently Bearish with a score of 27.5 percent. The commercials are Bullish with a score of 73.8 percent and the small traders (not shown in chart) are Bearish with a score of 30.8 percent.
| 30-Day Federal Funds Statistics | SPECULATORS | COMMERCIALS | SMALL TRADERS |
| – Percent of Open Interest Longs: | 3.7 | 81.6 | 1.3 |
| – Percent of Open Interest Shorts: | 10.6 | 73.6 | 2.4 |
| – Net Position: | -98,478 | 114,396 | -15,918 |
| – Gross Longs: | 52,431 | 1,163,989 | 18,288 |
| – Gross Shorts: | 150,909 | 1,049,593 | 34,206 |
| – Long to Short Ratio: | 0.3 to 1 | 1.1 to 1 | 0.5 to 1 |
| NET POSITION TREND: | |||
| – COT Index Score (3 Year Range Pct): | 27.5 | 73.8 | 30.8 |
| – COT Index Reading (3 Year Range): | Bearish | Bullish | Bearish |
| NET POSITION MOVEMENT INDEX: | |||
| – 6-Week Change in Strength Index: | -5.4 | 5.9 | -10.7 |
This week’s current strength score (the trader positioning range over the past three years, measured from 0 to 100) shows the speculators are currently Bullish-Extreme with a score of 95.8 percent. The commercials are Bearish with a score of 24.2 percent and the small traders (not shown in chart) are Bearish-Extreme with a score of 4.0 percent.
| 2-Year Treasury Note Statistics | SPECULATORS | COMMERCIALS | SMALL TRADERS |
| – Percent of Open Interest Longs: | 16.2 | 73.0 | 7.0 |
| – Percent of Open Interest Shorts: | 15.3 | 71.0 | 9.9 |
| – Net Position: | 15,670 | 35,095 | -50,765 |
| – Gross Longs: | 289,388 | 1,306,141 | 125,667 |
| – Gross Shorts: | 273,718 | 1,271,046 | 176,432 |
| – Long to Short Ratio: | 1.1 to 1 | 1.0 to 1 | 0.7 to 1 |
| NET POSITION TREND: | |||
| – COT Index Score (3 Year Range Pct): | 95.8 | 24.2 | 4.0 |
| – COT Index Reading (3 Year Range): | Bullish-Extreme | Bearish | Bearish-Extreme |
| NET POSITION MOVEMENT INDEX: | |||
| – 6-Week Change in Strength Index: | 32.9 | -26.4 | -6.1 |
This week’s current strength score (the trader positioning range over the past three years, measured from 0 to 100) shows the speculators are currently Bearish-Extreme with a score of 15.5 percent. The commercials are Bullish-Extreme with a score of 96.9 percent and the small traders (not shown in chart) are Bearish-Extreme with a score of 13.3 percent.
| 5-Year Treasury Note Statistics | SPECULATORS | COMMERCIALS | SMALL TRADERS |
| – Percent of Open Interest Longs: | 7.0 | 82.0 | 7.4 |
| – Percent of Open Interest Shorts: | 17.6 | 64.4 | 14.5 |
| – Net Position: | -367,832 | 614,453 | -246,621 |
| – Gross Longs: | 244,895 | 2,859,429 | 258,648 |
| – Gross Shorts: | 612,727 | 2,244,976 | 505,269 |
| – Long to Short Ratio: | 0.4 to 1 | 1.3 to 1 | 0.5 to 1 |
| NET POSITION TREND: | |||
| – COT Index Score (3 Year Range Pct): | 15.5 | 96.9 | 13.3 |
| – COT Index Reading (3 Year Range): | Bearish-Extreme | Bullish-Extreme | Bearish-Extreme |
| NET POSITION MOVEMENT INDEX: | |||
| – 6-Week Change in Strength Index: | -20.5 | 13.9 | 2.3 |
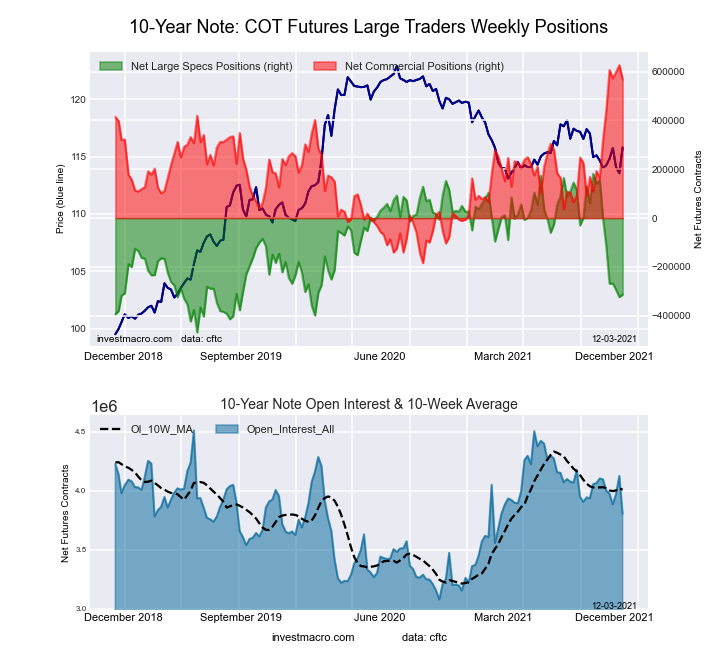
This week’s current strength score (the trader positioning range over the past three years, measured from 0 to 100) shows the speculators are currently Bearish with a score of 23.8 percent. The commercials are Bullish-Extreme with a score of 92.8 percent and the small traders (not shown in chart) are Bearish-Extreme with a score of 19.5 percent.
| 10-Year Treasury Note Statistics | SPECULATORS | COMMERCIALS | SMALL TRADERS |
| – Percent of Open Interest Longs: | 11.1 | 78.4 | 7.8 |
| – Percent of Open Interest Shorts: | 19.3 | 63.5 | 14.5 |
| – Net Position: | -313,371 | 567,638 | -254,267 |
| – Gross Longs: | 420,694 | 2,982,808 | 297,942 |
| – Gross Shorts: | 734,065 | 2,415,170 | 552,209 |
| – Long to Short Ratio: | 0.6 to 1 | 1.2 to 1 | 0.5 to 1 |
| NET POSITION TREND: | |||
| – COT Index Score (3 Year Range Pct): | 23.8 | 92.8 | 19.5 |
| – COT Index Reading (3 Year Range): | Bearish | Bullish-Extreme | Bearish-Extreme |
| NET POSITION MOVEMENT INDEX: | |||
| – 6-Week Change in Strength Index: | -48.2 | 30.6 | 15.0 |
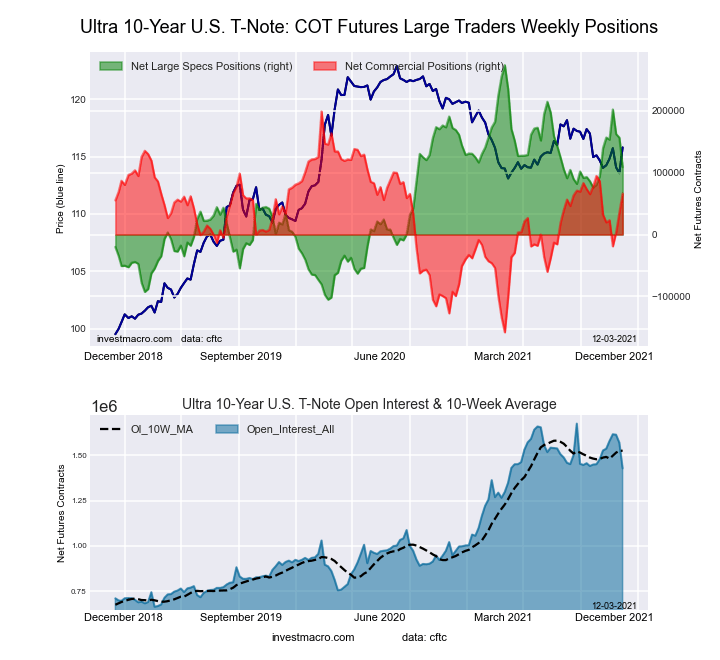
This week’s current strength score (the trader positioning range over the past three years, measured from 0 to 100) shows the speculators are currently Bullish with a score of 56.5 percent. The commercials are Bullish with a score of 62.8 percent and the small traders (not shown in chart) are Bearish-Extreme with a score of 10.2 percent.
| Ultra 10-Year Notes Statistics | SPECULATORS | COMMERCIALS | SMALL TRADERS |
| – Percent of Open Interest Longs: | 17.5 | 72.1 | 7.3 |
| – Percent of Open Interest Shorts: | 9.9 | 67.5 | 19.5 |
| – Net Position: | 108,880 | 66,179 | -175,059 |
| – Gross Longs: | 250,436 | 1,030,621 | 104,031 |
| – Gross Shorts: | 141,556 | 964,442 | 279,090 |
| – Long to Short Ratio: | 1.8 to 1 | 1.1 to 1 | 0.4 to 1 |
| NET POSITION TREND: | |||
| – COT Index Score (3 Year Range Pct): | 56.5 | 62.8 | 10.2 |
| – COT Index Reading (3 Year Range): | Bullish | Bullish | Bearish-Extreme |
| NET POSITION MOVEMENT INDEX: | |||
| – 6-Week Change in Strength Index: | -8.1 | 9.5 | -2.0 |
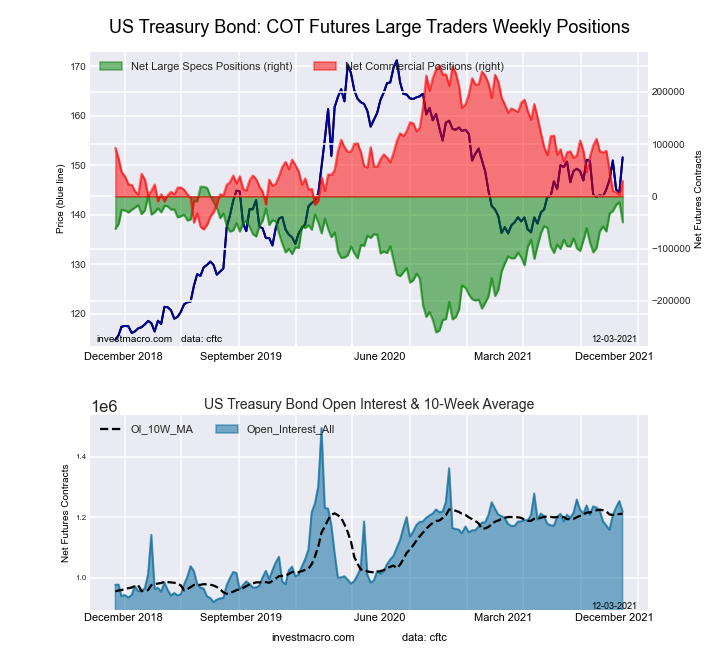
This week’s current strength score (the trader positioning range over the past three years, measured from 0 to 100) shows the speculators are currently Bullish with a score of 75.6 percent. The commercials are Bearish with a score of 29.6 percent and the small traders (not shown in chart) are Bullish with a score of 68.5 percent.
| US Treasury Bonds Statistics | SPECULATORS | COMMERCIALS | SMALL TRADERS |
| – Percent of Open Interest Longs: | 10.5 | 72.6 | 14.9 |
| – Percent of Open Interest Shorts: | 14.6 | 70.2 | 13.2 |
| – Net Position: | -49,640 | 29,588 | 20,052 |
| – Gross Longs: | 127,915 | 885,731 | 181,245 |
| – Gross Shorts: | 177,555 | 856,143 | 161,193 |
| – Long to Short Ratio: | 0.7 to 1 | 1.0 to 1 | 1.1 to 1 |
| NET POSITION TREND: | |||
| – COT Index Score (3 Year Range Pct): | 75.6 | 29.6 | 68.5 |
| – COT Index Reading (3 Year Range): | Bullish | Bearish | Bullish |
| NET POSITION MOVEMENT INDEX: | |||
| – 6-Week Change in Strength Index: | 2.9 | -17.3 | 36.7 |
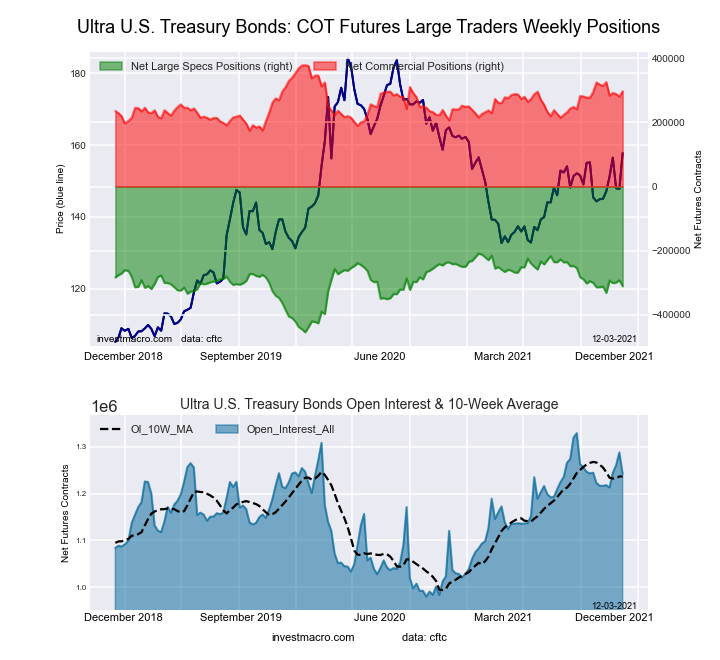
This week’s current strength score (the trader positioning range over the past three years, measured from 0 to 100) shows the speculators are currently Bullish with a score of 58.5 percent. The commercials are Bullish with a score of 60.1 percent and the small traders (not shown in chart) are Bearish with a score of 38.2 percent.
| Ultra US Treasury Bonds Statistics | SPECULATORS | COMMERCIALS | SMALL TRADERS |
| – Percent of Open Interest Longs: | 5.6 | 80.5 | 12.0 |
| – Percent of Open Interest Shorts: | 30.6 | 56.6 | 10.9 |
| – Net Position: | -310,496 | 296,670 | 13,826 |
| – Gross Longs: | 69,305 | 1,000,175 | 149,596 |
| – Gross Shorts: | 379,801 | 703,505 | 135,770 |
| – Long to Short Ratio: | 0.2 to 1 | 1.4 to 1 | 1.1 to 1 |
| NET POSITION TREND: | |||
| – COT Index Score (3 Year Range Pct): | 58.5 | 60.1 | 38.2 |
| – COT Index Reading (3 Year Range): | Bullish | Bullish | Bearish |
| NET POSITION MOVEMENT INDEX: | |||
| – 6-Week Change in Strength Index: | 0.5 | -8.4 | 11.4 |
Article By InvestMacro – Receive our weekly COT Reports by Email
*COT Report: The COT data, released weekly to the public each Friday, is updated through the most recent Tuesday (data is 3 days old) and shows a quick view of how large speculators or non-commercials (for-profit traders) were positioned in the futures markets.
The CFTC categorizes trader positions according to commercial hedgers (traders who use futures contracts for hedging as part of the business), non-commercials (large traders who speculate to realize trading profits) and nonreportable traders (usually small traders/speculators) as well as their open interest (contracts open in the market at time of reporting).See CFTC criteria here.
By Analytical Department RoboForex Gold fell to 4,033 USD per ounce on Thursday, extending its…
By JustMarkets By the end of the day, the Dow Jones Index (US30) rose by…
By JustMarkets On Tuesday, the US stock indices finished the session in the green, supported…
By Analytical Department RoboForex GBP/USD rose to 1.3403 on Wednesday, with British politics taking centre…
By Analytical Department RoboForex USD/JPY ended Tuesday at 162.27, with the Japanese yen remaining near…
By JustMarkets On Friday, the Dow Jones Index (US30) rose by 0.29% (weekly: -0.36%). The…
This website uses cookies.