
By InvestMacro | COT | Data Tables | COT Leaders | Downloads | COT Newsletter
Here are the latest charts and statistics for the Commitment of Traders (COT) data published by the Commodities Futures Trading Commission (CFTC).
The latest COT data is updated through Tuesday November 16th 2021 and shows a quick view of how large traders (for-profit speculators and commercial entities) were positioned in the futures markets.
Highlighting the COT Metals data this week is the recent increase in Silver speculator positions. Bullish bets by speculators in favor of Silver rose this week for a second straight week and have now climbed for five out of the past six weeks (adding a total of 29,246 contracts to the net standing). This bullishness has pushed the overall speculative net position in Silver over the +45,000 net contract threshold and to its highest level of the past twenty-two weeks, dating back to June 15th when the net position totaled 52,064 contracts.
| Nov-16-2021 | OI | OI-Index | Spec-Net | Spec-Index | Com-Net | COM-Index | Smalls-Net | Smalls-Index |
|---|---|---|---|---|---|---|---|---|
| WTI Crude | 2,057,633 | 18 | 415,785 | 44 | -470,324 | 41 | 54,539 | 92 |
| Gold | 612,612 | 54 | 259,780 | 73 | -287,539 | 27 | 27,759 | 48 |
| Silver | 152,404 | 18 | 45,625 | 68 | -66,148 | 34 | 20,523 | 61 |
| Copper | 208,066 | 32 | 20,337 | 57 | -30,805 | 38 | 10,468 | 86 |
| Palladium | 11,840 | 24 | -2,038 | 7 | 1,976 | 91 | 62 | 48 |
| Platinum | 62,284 | 26 | 21,013 | 33 | -28,225 | 69 | 7,212 | 63 |
| Natural Gas | 1,308,708 | 45 | -144,620 | 35 | 98,415 | 62 | 46,205 | 96 |
| Brent | 199,930 | 39 | -12,900 | 98 | 7,412 | 0 | 5,488 | 94 |
| Heating Oil | 380,887 | 26 | 17,029 | 67 | -37,010 | 32 | 19,981 | 68 |
| Soybeans | 662,972 | 13 | 46,917 | 42 | -4,927 | 65 | -41,990 | 2 |
| Corn | 1,598,926 | 38 | 399,186 | 81 | -340,672 | 23 | -58,514 | 9 |
| Coffee | 286,343 | 48 | 66,081 | 97 | -70,075 | 5 | 3,994 | 16 |
| Sugar | 906,385 | 21 | 227,389 | 83 | -276,185 | 16 | 48,796 | 68 |
| Wheat | 427,786 | 49 | 36,761 | 78 | -27,999 | 14 | -8,762 | 60 |
Gold Comex Futures:
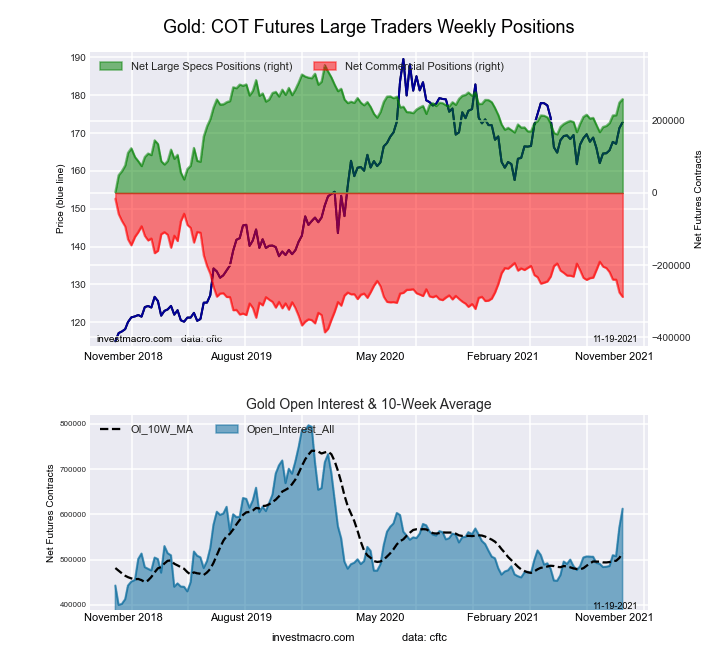 The Gold Comex Futures large speculator standing this week recorded a net position of 259,780 contracts in the data reported through Tuesday. This was a weekly boost of 9,599 contracts from the previous week which had a total of 250,181 net contracts.
Free Reports:
 Sign Up for Our Stock Market Newsletter – Get updated on News, Charts & Rankings of Public Companies when you join our Stocks Newsletter
 Get our Weekly Commitment of Traders Reports - See where the biggest traders (Hedge Funds and Commercial Hedgers) are positioned in the futures markets on a weekly basis.
This week’s current strength score (the trader positioning range over the past three years, measured from 0 to 100) shows the speculators are currently Bullish with a score of 73.3 percent. The commercials are Bearish with a score of 26.5 percent and the small traders (not shown in chart) are Bearish with a score of 48.0 percent.
| Gold Futures Statistics | SPECULATORS | COMMERCIALS | SMALL TRADERS |
| – Percent of Open Interest Longs: | 58.9 | 20.5 | 8.5 |
| – Percent of Open Interest Shorts: | 16.4 | 67.5 | 4.0 |
| – Net Position: | 259,780 | -287,539 | 27,759 |
| – Gross Longs: | 360,529 | 125,758 | 52,054 |
| – Gross Shorts: | 100,749 | 413,297 | 24,295 |
| – Long to Short Ratio: | 3.6 to 1 | 0.3 to 1 | 2.1 to 1 |
| NET POSITION TREND: | |||
| – COT Index Score (3 Year Range Pct): | 73.3 | 26.5 | 48.0 |
| – COT Index Reading (3 Year Range): | Bullish | Bearish | Bearish |
| NET POSITION MOVEMENT INDEX: | |||
| – 6-Week Change in Strength Index: | 21.9 | -22.7 | 17.2 |
Silver Comex Futures:
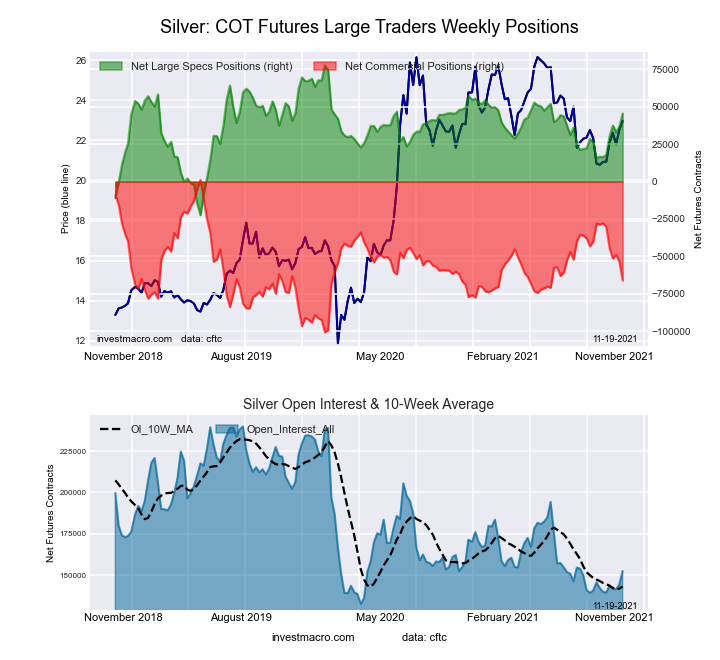 The Silver Comex Futures large speculator standing this week recorded a net position of 45,625 contracts in the data reported through Tuesday. This was a weekly rise of 8,710 contracts from the previous week which had a total of 36,915 net contracts.
This week’s current strength score (the trader positioning range over the past three years, measured from 0 to 100) shows the speculators are currently Bullish with a score of 67.8 percent. The commercials are Bearish with a score of 34.0 percent and the small traders (not shown in chart) are Bullish with a score of 61.0 percent.
| Silver Futures Statistics | SPECULATORS | COMMERCIALS | SMALL TRADERS |
| – Percent of Open Interest Longs: | 48.5 | 26.9 | 20.7 |
| – Percent of Open Interest Shorts: | 18.6 | 70.3 | 7.3 |
| – Net Position: | 45,625 | -66,148 | 20,523 |
| – Gross Longs: | 73,944 | 40,998 | 31,619 |
| – Gross Shorts: | 28,319 | 107,146 | 11,096 |
| – Long to Short Ratio: | 2.6 to 1 | 0.4 to 1 | 2.8 to 1 |
| NET POSITION TREND: | |||
| – COT Index Score (3 Year Range Pct): | 67.8 | 34.0 | 61.0 |
| – COT Index Reading (3 Year Range): | Bullish | Bearish | Bullish |
| NET POSITION MOVEMENT INDEX: | |||
| – 6-Week Change in Strength Index: | 29.2 | -37.7 | 55.1 |
Copper Grade #1 Futures:
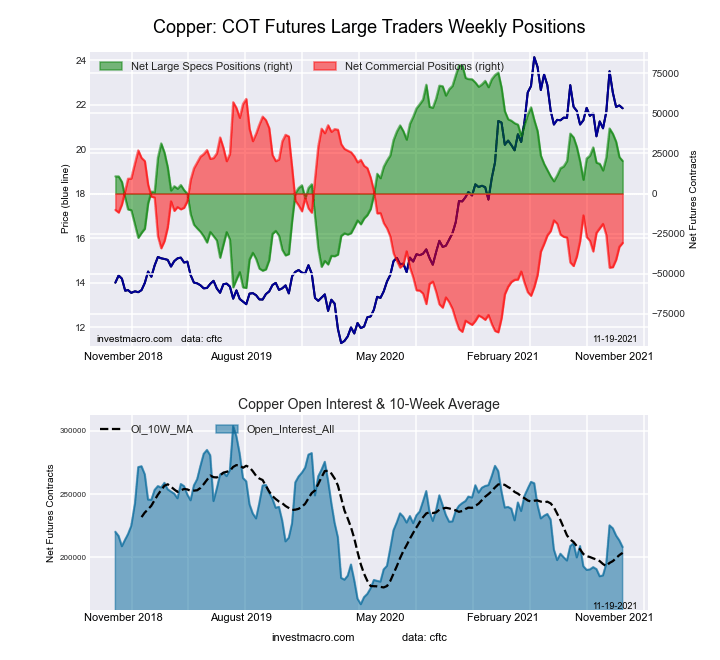 The Copper Grade #1 Futures large speculator standing this week recorded a net position of 20,337 contracts in the data reported through Tuesday. This was a weekly lowering of -2,452 contracts from the previous week which had a total of 22,789 net contracts.
This week’s current strength score (the trader positioning range over the past three years, measured from 0 to 100) shows the speculators are currently Bullish with a score of 57.0 percent. The commercials are Bearish with a score of 38.3 percent and the small traders (not shown in chart) are Bullish-Extreme with a score of 85.8 percent.
| Copper Futures Statistics | SPECULATORS | COMMERCIALS | SMALL TRADERS |
| – Percent of Open Interest Longs: | 39.2 | 38.4 | 10.3 |
| – Percent of Open Interest Shorts: | 29.4 | 53.2 | 5.3 |
| – Net Position: | 20,337 | -30,805 | 10,468 |
| – Gross Longs: | 81,599 | 79,856 | 21,469 |
| – Gross Shorts: | 61,262 | 110,661 | 11,001 |
| – Long to Short Ratio: | 1.3 to 1 | 0.7 to 1 | 2.0 to 1 |
| NET POSITION TREND: | |||
| – COT Index Score (3 Year Range Pct): | 57.0 | 38.3 | 85.8 |
| – COT Index Reading (3 Year Range): | Bullish | Bearish | Bullish-Extreme |
| NET POSITION MOVEMENT INDEX: | |||
| – 6-Week Change in Strength Index: | 4.3 | -8.2 | 34.5 |
Platinum Futures:
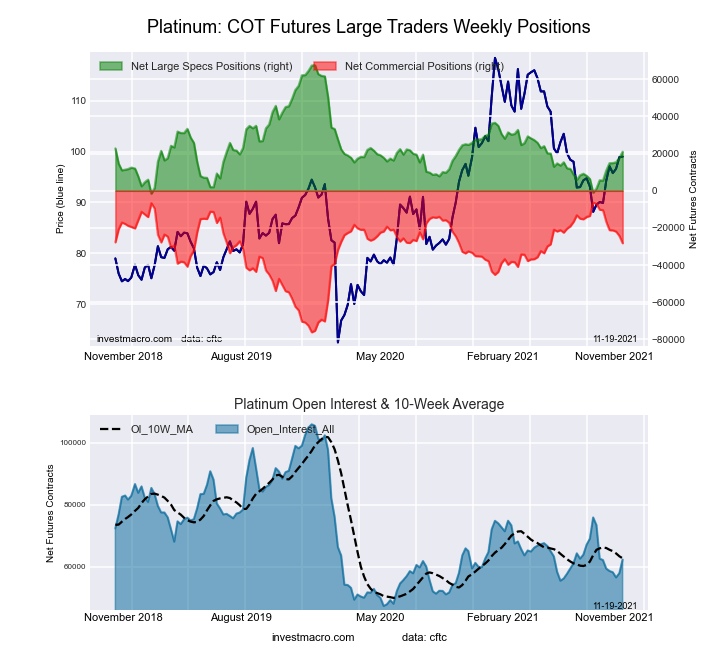 The Platinum Futures large speculator standing this week recorded a net position of 21,013 contracts in the data reported through Tuesday. This was a weekly boost of 3,383 contracts from the previous week which had a total of 17,630 net contracts.
This week’s current strength score (the trader positioning range over the past three years, measured from 0 to 100) shows the speculators are currently Bearish with a score of 32.7 percent. The commercials are Bullish with a score of 68.7 percent and the small traders (not shown in chart) are Bullish with a score of 62.7 percent.
| Platinum Futures Statistics | SPECULATORS | COMMERCIALS | SMALL TRADERS |
| – Percent of Open Interest Longs: | 53.4 | 25.1 | 15.5 |
| – Percent of Open Interest Shorts: | 19.7 | 70.5 | 3.9 |
| – Net Position: | 21,013 | -28,225 | 7,212 |
| – Gross Longs: | 33,266 | 15,658 | 9,668 |
| – Gross Shorts: | 12,253 | 43,883 | 2,456 |
| – Long to Short Ratio: | 2.7 to 1 | 0.4 to 1 | 3.9 to 1 |
| NET POSITION TREND: | |||
| – COT Index Score (3 Year Range Pct): | 32.7 | 68.7 | 62.7 |
| – COT Index Reading (3 Year Range): | Bearish | Bullish | Bullish |
| NET POSITION MOVEMENT INDEX: | |||
| – 6-Week Change in Strength Index: | 22.4 | -25.5 | 32.5 |
Palladium Futures:
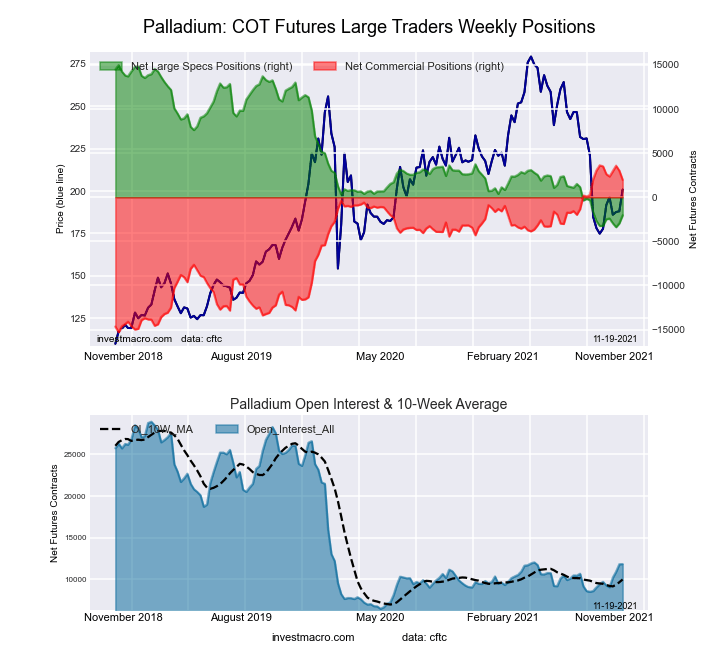 The Palladium Futures large speculator standing this week recorded a net position of -2,038 contracts in the data reported through Tuesday. This was a weekly rise of 916 contracts from the previous week which had a total of -2,954 net contracts.
This week’s current strength score (the trader positioning range over the past three years, measured from 0 to 100) shows the speculators are currently Bearish-Extreme with a score of 7.4 percent. The commercials are Bullish-Extreme with a score of 91.3 percent and the small traders (not shown in chart) are Bearish with a score of 48.3 percent.
| Palladium Futures Statistics | SPECULATORS | COMMERCIALS | SMALL TRADERS |
| – Percent of Open Interest Longs: | 26.3 | 47.8 | 11.8 |
| – Percent of Open Interest Shorts: | 43.5 | 31.1 | 11.3 |
| – Net Position: | -2,038 | 1,976 | 62 |
| – Gross Longs: | 3,108 | 5,656 | 1,400 |
| – Gross Shorts: | 5,146 | 3,680 | 1,338 |
| – Long to Short Ratio: | 0.6 to 1 | 1.5 to 1 | 1.0 to 1 |
| NET POSITION TREND: | |||
| – COT Index Score (3 Year Range Pct): | 7.4 | 91.3 | 48.3 |
| – COT Index Reading (3 Year Range): | Bearish-Extreme | Bullish-Extreme | Bearish |
| NET POSITION MOVEMENT INDEX: | |||
| – 6-Week Change in Strength Index: | 6.5 | -8.1 | 20.1 |
Article By InvestMacro – Receive our weekly COT Reports by Email
*COT Report: The COT data, released weekly to the public each Friday, is updated through the most recent Tuesday (data is 3 days old) and shows a quick view of how large speculators or non-commercials (for-profit traders) were positioned in the futures markets.
The CFTC categorizes trader positions according to commercial hedgers (traders who use futures contracts for hedging as part of the business), non-commercials (large traders who speculate to realize trading profits) and nonreportable traders (usually small traders/speculators) as well as their open interest (contracts open in the market at time of reporting).See CFTC criteria here.

- The Bank of Canada kept its interest rate unchanged. Platinum prices reached a three‑week high Jul 16, 2026
- Stock indices rose after the release of US inflation data. China’s GDP slowed sharply Jul 15, 2026
- GBP/USD Awaits Political News: What Will Happen Next Jul 15, 2026
- USD/JPY Holds at Highs: Pressure Lingers on Yen Jul 14, 2026
- Oil prices jumped 4% amid a new wave of escalation between the US and Iran Jul 13, 2026
- EUR/USD: US Inflation Will Determine Everything Jul 13, 2026
- COT Metals Charts: Weekly Speculator Bets see small gains for Silver & Gold Jul 12, 2026
- COT Bonds Charts: Speculator Bets led by SOFR 3-Months & 2-Year Bonds Jul 12, 2026
- COT Energy Charts: Weekly Speculator Changes led by Brent Oil Jul 12, 2026
- COT Soft Commodities Charts: Weekly Speculator Changes led by Sugar, Corn & Soybeans Jul 12, 2026