
By InvestMacro | COT | Data Tables | COT Leaders | Downloads | COT Newsletter
Here are the latest charts and statistics for the Commitment of Traders (COT) data published by the Commodities Futures Trading Commission (CFTC) on Monday due to the Thanksgiving holiday last week.
The latest COT data is updated through Tuesday November 23rd 2021 and shows a quick view of how large traders (for-profit speculators and commercial entities) were positioned in the futures markets.
| Nov-23-2021 | OI | OI-Index | Spec-Net | Spec-Index | Com-Net | COM-Index | Smalls-Net | Smalls-Index |
|---|---|---|---|---|---|---|---|---|
| S&P500-Mini | 2,455,317 | 3 | 123,814 | 83 | -149,551 | 39 | 25,737 | 32 |
| Nikkei 225 | 17,523 | 9 | 756 | 60 | -2,085 | 45 | 1,329 | 44 |
| Nasdaq-Mini | 258,727 | 47 | 28,014 | 91 | -22,772 | 12 | -5,242 | 32 |
| DowJones-Mini | 106,092 | 78 | -2,151 | 33 | -5,364 | 56 | 7,515 | 79 |
| VIX | 311,412 | 30 | -81,936 | 52 | 92,079 | 50 | -10,143 | 18 |
| Nikkei 225 Yen | 54,780 | 36 | -5,850 | 7 | 26,032 | 94 | -20,182 | 39 |
VIX Volatility Futures:
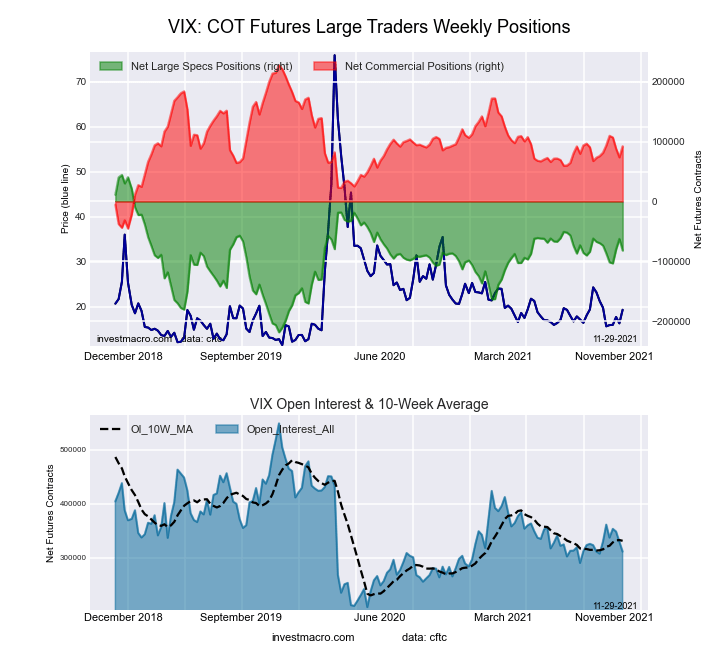 The VIX Volatility large speculator standing this week came in at a net position of -81,936 contracts in the data reported through Tuesday. This was a weekly reduction of -19,449 contracts from the previous week which had a total of -62,487 net contracts.
This week’s current strength score (the trader positioning range over the past three years, measured from 0 to 100) shows the speculators are currently Bullish with a score of 52.0 percent. The commercials are Bullish with a score of 50.3 percent and the small traders (not shown in chart) are Bearish-Extreme with a score of 17.9 percent.
Free Reports:
 Download Our Metatrader 4 Indicators – Put Our Free MetaTrader 4 Custom Indicators on your charts when you join our Weekly Newsletter
 Get our Weekly Commitment of Traders Reports - See where the biggest traders (Hedge Funds and Commercial Hedgers) are positioned in the futures markets on a weekly basis.
| VIX Volatility Futures Statistics | SPECULATORS | COMMERCIALS | SMALL TRADERS |
| – Percent of Open Interest Longs: | 12.8 | 61.2 | 6.5 |
| – Percent of Open Interest Shorts: | 39.1 | 31.7 | 9.8 |
| – Net Position: | -81,936 | 92,079 | -10,143 |
| – Gross Longs: | 39,888 | 190,717 | 20,368 |
| – Gross Shorts: | 121,824 | 98,638 | 30,511 |
| – Long to Short Ratio: | 0.3 to 1 | 1.9 to 1 | 0.7 to 1 |
| NET POSITION TREND: | |||
| – COT Index Score (3 Year Range Pct): | 52.0 | 50.3 | 17.9 |
| – COT Index Reading (3 Year Range): | Bullish | Bullish | Bearish-Extreme |
| NET POSITION MOVEMENT INDEX: | |||
| – 6-Week Change in Strength Index: | -3.2 | 3.9 | -8.7 |
S&P500 Mini Futures:
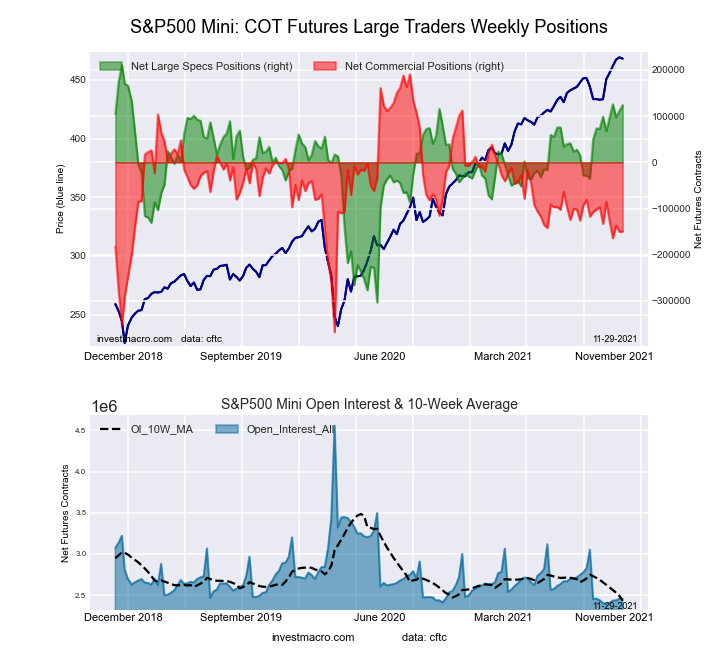 The S&P500 Mini large speculator standing this week came in at a net position of 123,814 contracts in the data reported through Tuesday. This was a weekly gain of 12,662 contracts from the previous week which had a total of 111,152 net contracts.
This week’s current strength score (the trader positioning range over the past three years, measured from 0 to 100) shows the speculators are currently Bullish-Extreme with a score of 83.2 percent. The commercials are Bearish with a score of 39.1 percent and the small traders (not shown in chart) are Bearish with a score of 31.8 percent.
| S&P500 Mini Futures Statistics | SPECULATORS | COMMERCIALS | SMALL TRADERS |
| – Percent of Open Interest Longs: | 15.4 | 70.2 | 11.1 |
| – Percent of Open Interest Shorts: | 10.3 | 76.3 | 10.1 |
| – Net Position: | 123,814 | -149,551 | 25,737 |
| – Gross Longs: | 377,514 | 1,723,316 | 272,632 |
| – Gross Shorts: | 253,700 | 1,872,867 | 246,895 |
| – Long to Short Ratio: | 1.5 to 1 | 0.9 to 1 | 1.1 to 1 |
| NET POSITION TREND: | |||
| – COT Index Score (3 Year Range Pct): | 83.2 | 39.1 | 31.8 |
| – COT Index Reading (3 Year Range): | Bullish-Extreme | Bearish | Bearish |
| NET POSITION MOVEMENT INDEX: | |||
| – 6-Week Change in Strength Index: | 4.9 | -2.9 | -1.8 |
Dow Jones Mini Futures:
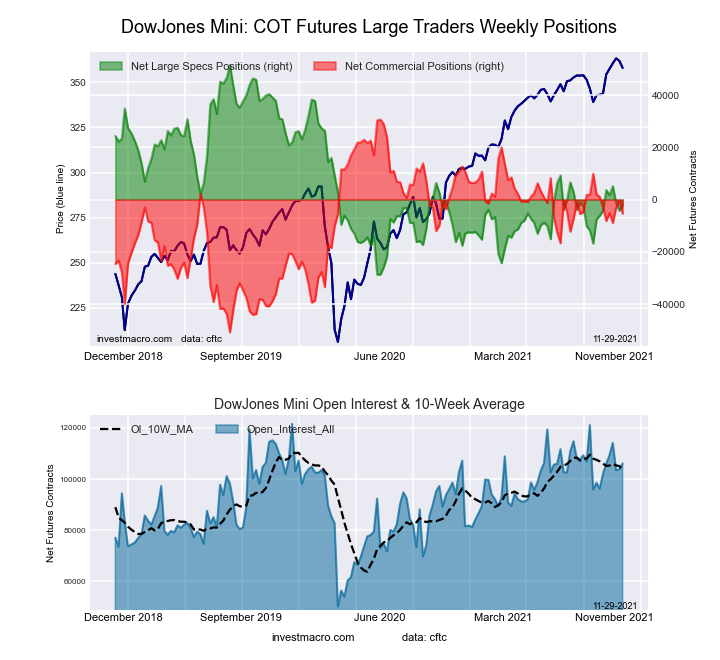 The Dow Jones Mini large speculator standing this week came in at a net position of -2,151 contracts in the data reported through Tuesday. This was a weekly lift of 2,127 contracts from the previous week which had a total of -4,278 net contracts.
This week’s current strength score (the trader positioning range over the past three years, measured from 0 to 100) shows the speculators are currently Bearish with a score of 33.2 percent. The commercials are Bullish with a score of 55.8 percent and the small traders (not shown in chart) are Bullish with a score of 78.7 percent.
| Dow Jones Mini Futures Statistics | SPECULATORS | COMMERCIALS | SMALL TRADERS |
| – Percent of Open Interest Longs: | 36.9 | 43.9 | 18.5 |
| – Percent of Open Interest Shorts: | 38.9 | 48.9 | 11.4 |
| – Net Position: | -2,151 | -5,364 | 7,515 |
| – Gross Longs: | 39,132 | 46,566 | 19,656 |
| – Gross Shorts: | 41,283 | 51,930 | 12,141 |
| – Long to Short Ratio: | 0.9 to 1 | 0.9 to 1 | 1.6 to 1 |
| NET POSITION TREND: | |||
| – COT Index Score (3 Year Range Pct): | 33.2 | 55.8 | 78.7 |
| – COT Index Reading (3 Year Range): | Bearish | Bullish | Bullish |
| NET POSITION MOVEMENT INDEX: | |||
| – 6-Week Change in Strength Index: | 2.7 | -2.8 | 0.6 |
Nasdaq Mini Futures:
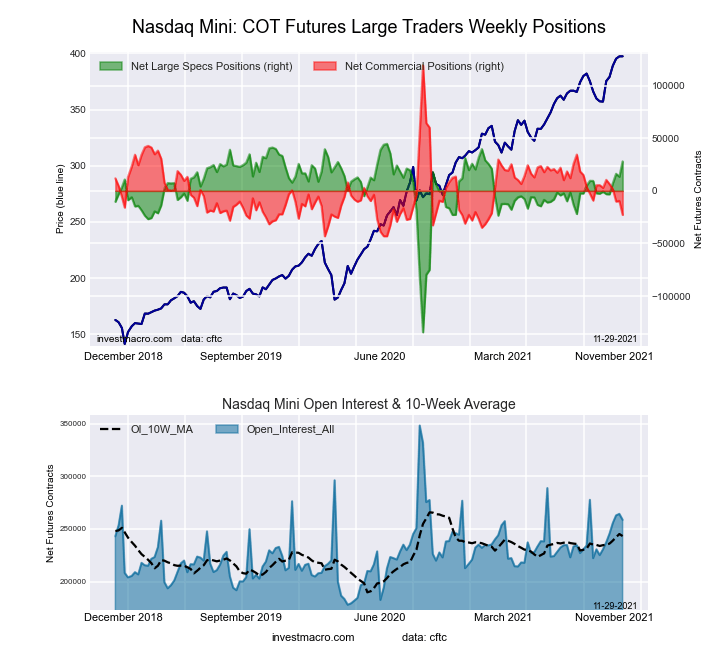 The Nasdaq Mini large speculator standing this week came in at a net position of 28,014 contracts in the data reported through Tuesday. This was a weekly increase of 14,556 contracts from the previous week which had a total of 13,458 net contracts.
This week’s current strength score (the trader positioning range over the past three years, measured from 0 to 100) shows the speculators are currently Bullish-Extreme with a score of 90.7 percent. The commercials are Bearish-Extreme with a score of 12.5 percent and the small traders (not shown in chart) are Bearish with a score of 32.2 percent.
| Nasdaq Mini Futures Statistics | SPECULATORS | COMMERCIALS | SMALL TRADERS |
| – Percent of Open Interest Longs: | 32.3 | 50.5 | 15.5 |
| – Percent of Open Interest Shorts: | 21.5 | 59.3 | 17.6 |
| – Net Position: | 28,014 | -22,772 | -5,242 |
| – Gross Longs: | 83,595 | 130,622 | 40,183 |
| – Gross Shorts: | 55,581 | 153,394 | 45,425 |
| – Long to Short Ratio: | 1.5 to 1 | 0.9 to 1 | 0.9 to 1 |
| NET POSITION TREND: | |||
| – COT Index Score (3 Year Range Pct): | 90.7 | 12.5 | 32.2 |
| – COT Index Reading (3 Year Range): | Bullish-Extreme | Bearish-Extreme | Bearish |
| NET POSITION MOVEMENT INDEX: | |||
| – 6-Week Change in Strength Index: | 16.1 | -15.8 | -7.1 |
Russell 2000 Mini Futures:
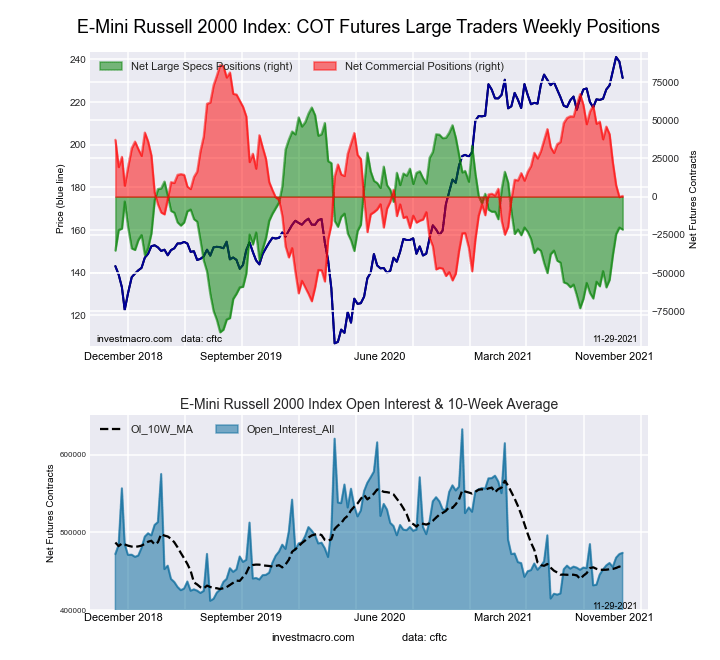 The Russell 2000 Mini large speculator standing this week came in at a net position of -21,538 contracts in the data reported through Tuesday. This was a weekly decline of -1,371 contracts from the previous week which had a total of -20,167 net contracts.
This week’s current strength score (the trader positioning range over the past three years, measured from 0 to 100) shows the speculators are currently Bearish with a score of 45.7 percent. The commercials are Bearish with a score of 44.6 percent and the small traders (not shown in chart) are Bullish-Extreme with a score of 92.5 percent.
| Russell 2000 Mini Futures Statistics | SPECULATORS | COMMERCIALS | SMALL TRADERS |
| – Percent of Open Interest Longs: | 15.4 | 75.2 | 8.5 |
| – Percent of Open Interest Shorts: | 19.9 | 75.1 | 4.0 |
| – Net Position: | -21,538 | 463 | 21,075 |
| – Gross Longs: | 72,793 | 356,171 | 40,089 |
| – Gross Shorts: | 94,331 | 355,708 | 19,014 |
| – Long to Short Ratio: | 0.8 to 1 | 1.0 to 1 | 2.1 to 1 |
| NET POSITION TREND: | |||
| – COT Index Score (3 Year Range Pct): | 45.7 | 44.6 | 92.5 |
| – COT Index Reading (3 Year Range): | Bearish | Bearish | Bullish-Extreme |
| NET POSITION MOVEMENT INDEX: | |||
| – 6-Week Change in Strength Index: | 18.5 | -24.0 | 27.9 |
Nikkei Stock Average (USD) Futures:
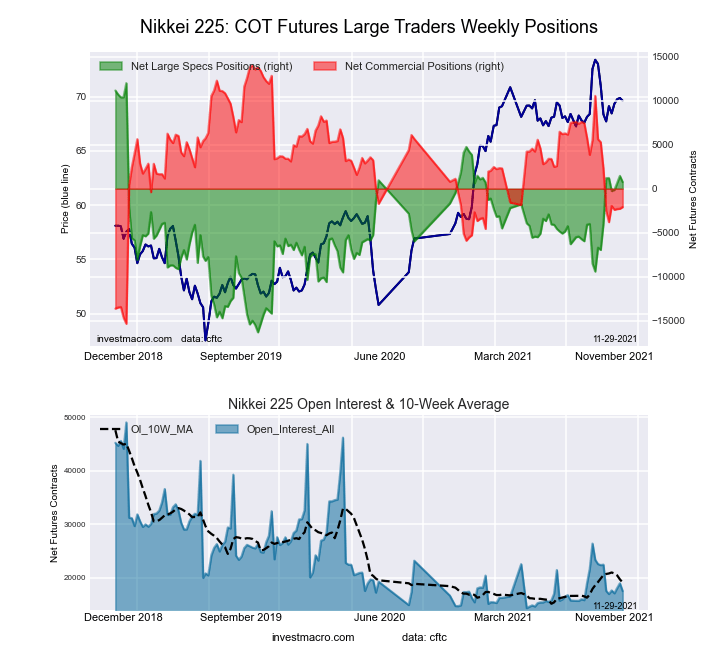 The Nikkei Stock Average (USD) large speculator standing this week came in at a net position of 756 contracts in the data reported through Tuesday. This was a weekly decline of -697 contracts from the previous week which had a total of 1,453 net contracts.
This week’s current strength score (the trader positioning range over the past three years, measured from 0 to 100) shows the speculators are currently Bullish with a score of 60.3 percent. The commercials are Bearish with a score of 45.1 percent and the small traders (not shown in chart) are Bearish with a score of 43.8 percent.
| Nikkei Stock Average Futures Statistics | SPECULATORS | COMMERCIALS | SMALL TRADERS |
| – Percent of Open Interest Longs: | 15.4 | 56.3 | 28.2 |
| – Percent of Open Interest Shorts: | 11.1 | 68.2 | 20.6 |
| – Net Position: | 756 | -2,085 | 1,329 |
| – Gross Longs: | 2,696 | 9,867 | 4,936 |
| – Gross Shorts: | 1,940 | 11,952 | 3,607 |
| – Long to Short Ratio: | 1.4 to 1 | 0.8 to 1 | 1.4 to 1 |
| NET POSITION TREND: | |||
| – COT Index Score (3 Year Range Pct): | 60.3 | 45.1 | 43.8 |
| – COT Index Reading (3 Year Range): | Bullish | Bearish | Bearish |
| NET POSITION MOVEMENT INDEX: | |||
| – 6-Week Change in Strength Index: | -1.5 | 1.5 | -0.2 |
MSCI EAFE Mini Futures:
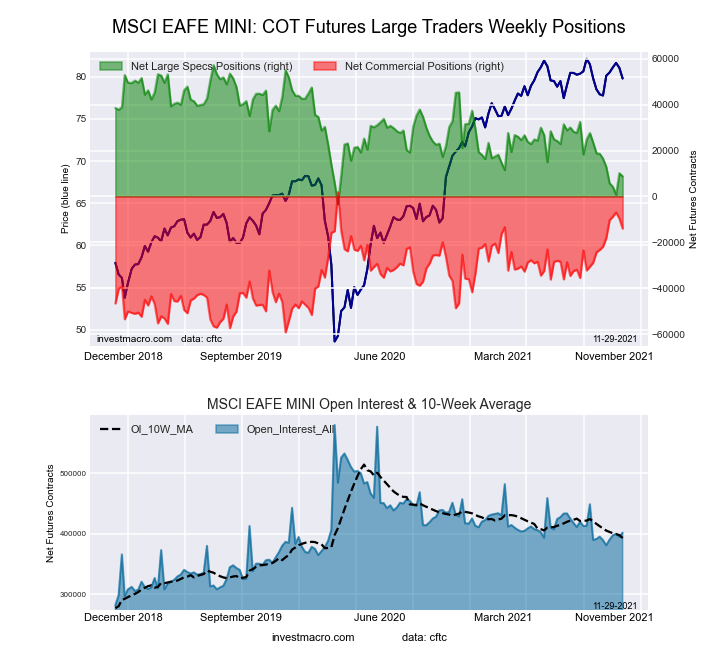 The MSCI EAFE Mini large speculator standing this week came in at a net position of 8,774 contracts in the data reported through Tuesday. This was a weekly lowering of -1,343 contracts from the previous week which had a total of 10,117 net contracts.
This week’s current strength score (the trader positioning range over the past three years, measured from 0 to 100) shows the speculators are currently Bearish with a score of 20.1 percent. The commercials are Bullish with a score of 74.0 percent and the small traders (not shown in chart) are Bullish with a score of 63.2 percent.
| MSCI EAFE Mini Futures Statistics | SPECULATORS | COMMERCIALS | SMALL TRADERS |
| – Percent of Open Interest Longs: | 7.0 | 89.5 | 3.1 |
| – Percent of Open Interest Shorts: | 4.8 | 93.0 | 1.8 |
| – Net Position: | 8,774 | -13,991 | 5,217 |
| – Gross Longs: | 28,146 | 359,654 | 12,497 |
| – Gross Shorts: | 19,372 | 373,645 | 7,280 |
| – Long to Short Ratio: | 1.5 to 1 | 1.0 to 1 | 1.7 to 1 |
| NET POSITION TREND: | |||
| – COT Index Score (3 Year Range Pct): | 20.1 | 74.0 | 63.2 |
| – COT Index Reading (3 Year Range): | Bearish | Bullish | Bullish |
| NET POSITION MOVEMENT INDEX: | |||
| – 6-Week Change in Strength Index: | -12.7 | 12.9 | -2.0 |
Article By InvestMacro – Receive our weekly COT Reports by Email
*COT Report: The COT data, released weekly to the public each Friday, is updated through the most recent Tuesday (data is 3 days old) and shows a quick view of how large speculators or non-commercials (for-profit traders) were positioned in the futures markets.
The CFTC categorizes trader positions according to commercial hedgers (traders who use futures contracts for hedging as part of the business), non-commercials (large traders who speculate to realize trading profits) and nonreportable traders (usually small traders/speculators) as well as their open interest (contracts open in the market at time of reporting).See CFTC criteria here.

- COT Metals Charts: Speculator Bets led by Silver, Gold & Platinum Mar 7, 2026
- COT Bonds Charts: Speculator Bets led by 10-Year Bonds & Fed Funds Mar 7, 2026
- COT Energy Charts: Speculator Bets led by Brent Oil & Heating Oil Mar 7, 2026
- COT Soft Commodities Charts: Speculator Bets led by Corn & Soybean Meal Mar 7, 2026
- Investors run to safe-haven assets amid Middle East escalation Mar 6, 2026
- EUR/USD Under Pressure: Middle East Risks Outweigh All Else Mar 6, 2026
- Bitcoin shows resilience to Middle East events. Oil market stabilizes Mar 5, 2026
- GBP/USD: Market Not Expecting BoE Rate Cut in March Mar 5, 2026
- Brent headed for $100? Mar 4, 2026
- Global stock indices continue sell-off due to Middle East conflict Mar 4, 2026