By InvestMacro | COT | Data Tables | COT Leaders | Downloads | COT Newsletter
Here are the latest charts and statistics for the Commitment of Traders (COT) data published by the Commodities Futures Trading Commission (CFTC).
The latest COT data is updated through Tuesday November 2nd 2021 and shows a quick view of how large traders (for-profit speculators and commercial entities) were positioned in the futures markets.
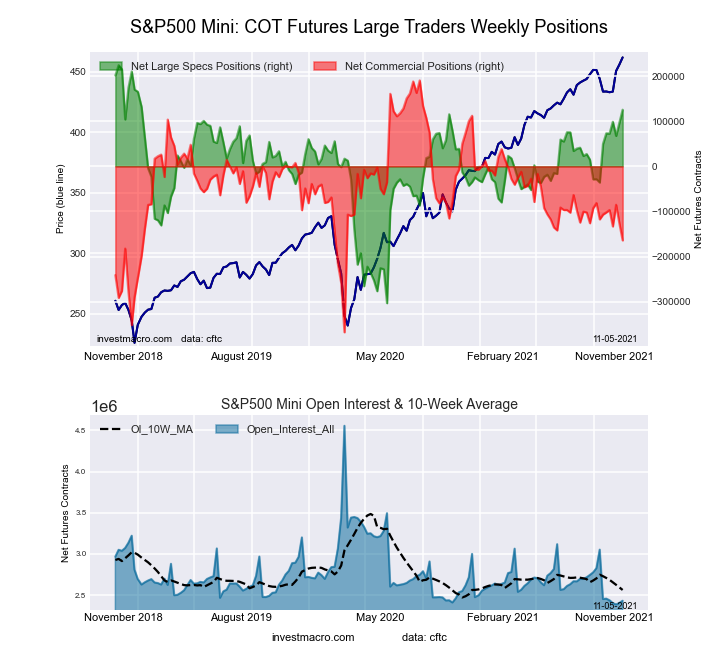
Highlighting this week’s COT Stock Market data is the S&P Mini speculator’s bullish bets. Speculator net positions jumped by 29,014 contracts this week to an overall bullish standing of 125,502 contracts. This marks the highest total net position of the past one hundred and forty-seven weeks, dating back to January of 2019. The S&P Mini contracts have risen by a total of 161,344 contracts in just the past seven weeks, bringing the net position out of negative territory on September 14th to this week’s two and a half year high.
| Nov-02-2021 | OI | OI-Index | Spec-Net | Spec-Index | Com-Net | COM-Index | Smalls-Net | Smalls-Index |
|---|---|---|---|---|---|---|---|---|
| S&P500-Mini | 2,431,931 | 2 | 125,502 | 81 | -164,121 | 36 | 38,619 | 34 |
| Nikkei 225 | 17,113 | 8 | -146 | 57 | -2,393 | 44 | 2,539 | 59 |
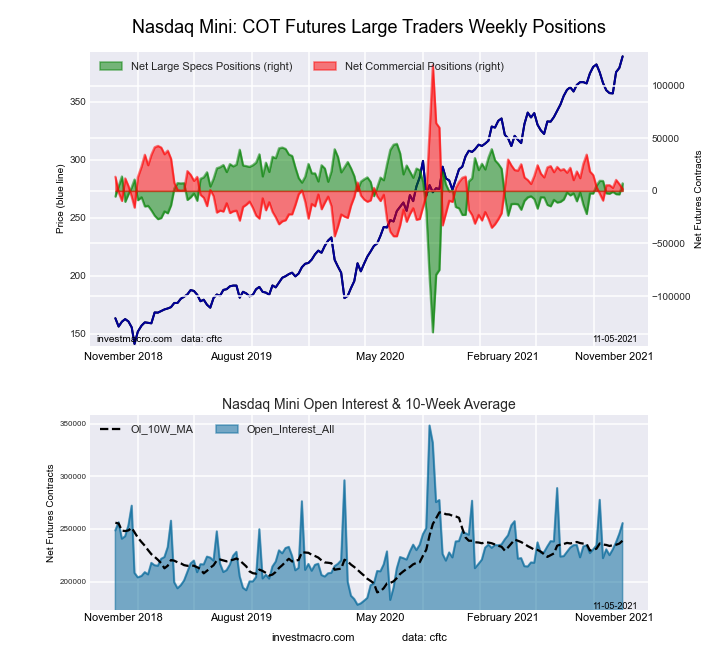
| Nasdaq-Mini | 255,587 | 46 | 7,219 | 79 | 1,761 | 28 | -8,980 | 24 |
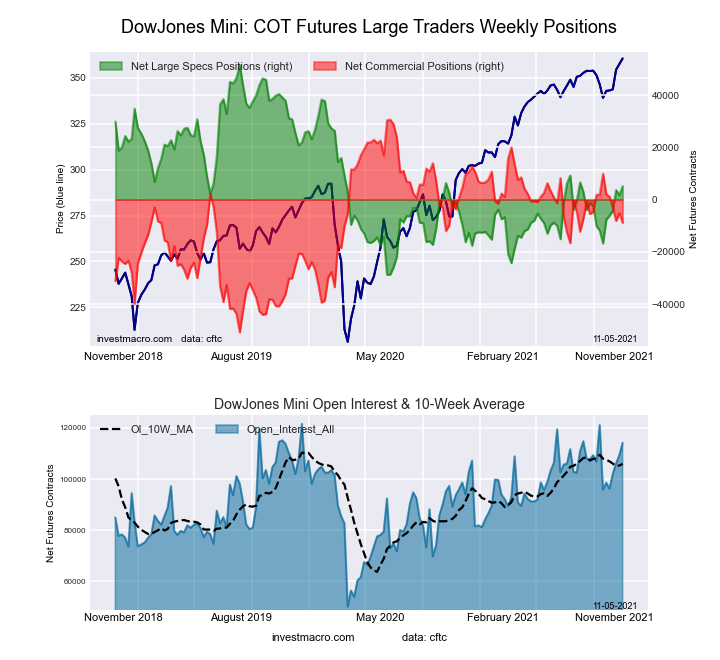
| DowJones-Mini | 114,131 | 90 | 5,088 | 42 | -8,907 | 51 | 3,819 | 59 |
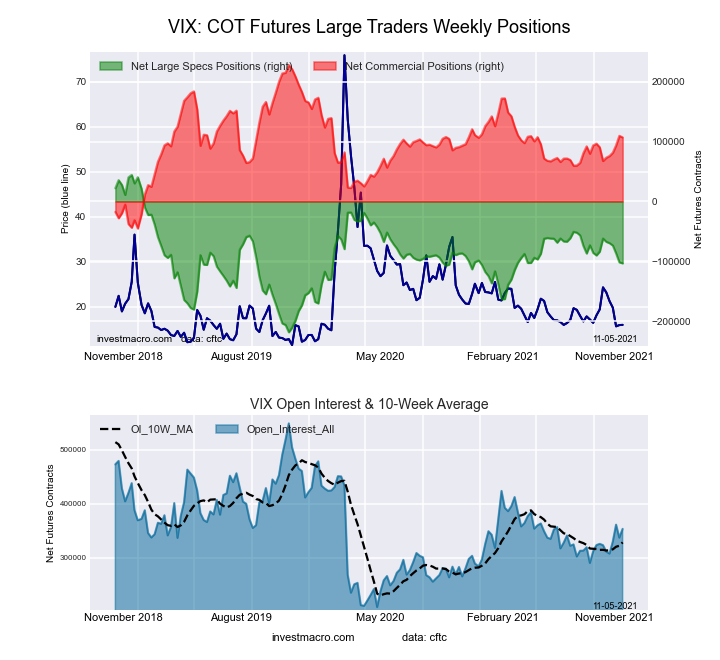
| VIX | 353,549 | 43 | -103,286 | 44 | 106,882 | 56 | -3,596 | 43 |
| Nikkei 225 Yen | 55,756 | 37 | 1,885 | 27 | 27,661 | 98 | -29,546 | 22 |
Free Reports:
This week’s current strength score (the trader positioning range over the past three years, measured from 0 to 100) shows the speculators are currently Bearish with a score of 43.8 percent. The commercials are Bullish with a score of 55.8 percent and the small traders (not shown in chart) are Bearish with a score of 42.8 percent.
| VIX Volatility Futures Statistics | SPECULATORS | COMMERCIALS | SMALL TRADERS |
| – Percent of Open Interest Longs: | 19.4 | 55.3 | 7.3 |
| – Percent of Open Interest Shorts: | 48.6 | 25.1 | 8.3 |
| – Net Position: | -103,286 | 106,882 | -3,596 |
| – Gross Longs: | 68,514 | 195,586 | 25,773 |
| – Gross Shorts: | 171,800 | 88,704 | 29,369 |
| – Long to Short Ratio: | 0.4 to 1 | 2.2 to 1 | 0.9 to 1 |
| NET POSITION TREND: | |||
| – COT Index Score (3 Year Range Pct): | 43.8 | 55.8 | 42.8 |
| – COT Index Reading (3 Year Range): | Bearish | Bullish | Bearish |
| NET POSITION MOVEMENT INDEX: | |||
| – 6-Week Change in Strength Index: | -15.7 | 14.4 | 7.8 |
This week’s current strength score (the trader positioning range over the past three years, measured from 0 to 100) shows the speculators are currently Bullish-Extreme with a score of 81.3 percent. The commercials are Bearish with a score of 36.5 percent and the small traders (not shown in chart) are Bearish with a score of 34.5 percent.
| S&P500 Mini Futures Statistics | SPECULATORS | COMMERCIALS | SMALL TRADERS |
| – Percent of Open Interest Longs: | 15.2 | 70.6 | 11.3 |
| – Percent of Open Interest Shorts: | 10.1 | 77.4 | 9.8 |
| – Net Position: | 125,502 | -164,121 | 38,619 |
| – Gross Longs: | 370,716 | 1,717,083 | 275,903 |
| – Gross Shorts: | 245,214 | 1,881,204 | 237,284 |
| – Long to Short Ratio: | 1.5 to 1 | 0.9 to 1 | 1.2 to 1 |
| NET POSITION TREND: | |||
| – COT Index Score (3 Year Range Pct): | 81.3 | 36.5 | 34.5 |
| – COT Index Reading (3 Year Range): | Bullish-Extreme | Bearish | Bearish |
| NET POSITION MOVEMENT INDEX: | |||
| – 6-Week Change in Strength Index: | 14.3 | -10.2 | -3.9 |
This week’s current strength score (the trader positioning range over the past three years, measured from 0 to 100) shows the speculators are currently Bearish with a score of 42.2 percent. The commercials are Bullish with a score of 51.5 percent and the small traders (not shown in chart) are Bullish with a score of 58.9 percent.
| Dow Jones Mini Futures Statistics | SPECULATORS | COMMERCIALS | SMALL TRADERS |
| – Percent of Open Interest Longs: | 40.2 | 42.2 | 16.0 |
| – Percent of Open Interest Shorts: | 35.8 | 50.0 | 12.6 |
| – Net Position: | 5,088 | -8,907 | 3,819 |
| – Gross Longs: | 45,902 | 48,200 | 18,221 |
| – Gross Shorts: | 40,814 | 57,107 | 14,402 |
| – Long to Short Ratio: | 1.1 to 1 | 0.8 to 1 | 1.3 to 1 |
| NET POSITION TREND: | |||
| – COT Index Score (3 Year Range Pct): | 42.2 | 51.5 | 58.9 |
| – COT Index Reading (3 Year Range): | Bearish | Bullish | Bullish |
| NET POSITION MOVEMENT INDEX: | |||
| – 6-Week Change in Strength Index: | 27.3 | -23.1 | -16.5 |
This week’s current strength score (the trader positioning range over the past three years, measured from 0 to 100) shows the speculators are currently Bullish with a score of 79.1 percent. The commercials are Bearish with a score of 27.6 percent and the small traders (not shown in chart) are Bearish with a score of 23.8 percent.
| Nasdaq Mini Futures Statistics | SPECULATORS | COMMERCIALS | SMALL TRADERS |
| – Percent of Open Interest Longs: | 28.0 | 56.6 | 14.1 |
| – Percent of Open Interest Shorts: | 25.2 | 55.9 | 17.6 |
| – Net Position: | 7,219 | 1,761 | -8,980 |
| – Gross Longs: | 71,515 | 144,589 | 36,010 |
| – Gross Shorts: | 64,296 | 142,828 | 44,990 |
| – Long to Short Ratio: | 1.1 to 1 | 1.0 to 1 | 0.8 to 1 |
| NET POSITION TREND: | |||
| – COT Index Score (3 Year Range Pct): | 79.1 | 27.6 | 23.8 |
| – COT Index Reading (3 Year Range): | Bullish | Bearish | Bearish |
| NET POSITION MOVEMENT INDEX: | |||
| – 6-Week Change in Strength Index: | -1.2 | 6.7 | -19.5 |
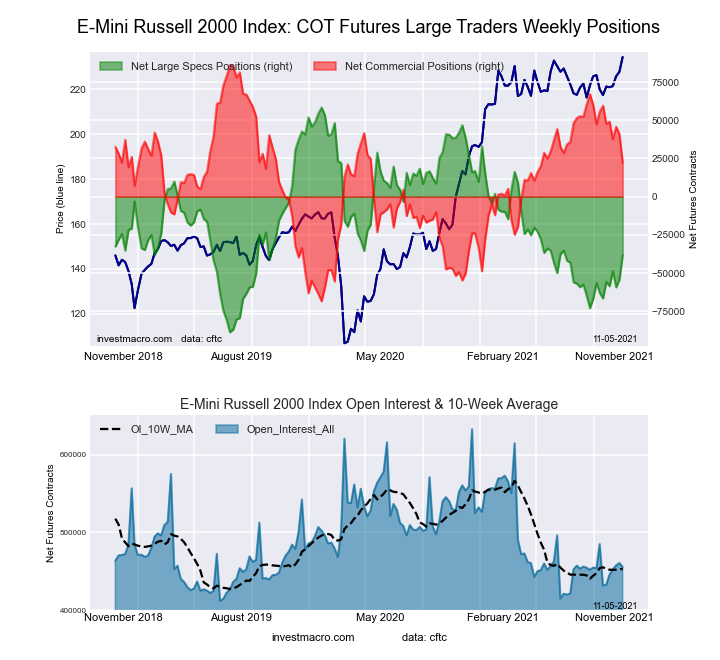
This week’s current strength score (the trader positioning range over the past three years, measured from 0 to 100) shows the speculators are currently Bearish with a score of 34.4 percent. The commercials are Bullish with a score of 58.8 percent and the small traders (not shown in chart) are Bullish with a score of 77.8 percent.
| Russell 2000 Mini Futures Statistics | SPECULATORS | COMMERCIALS | SMALL TRADERS |
| – Percent of Open Interest Longs: | 15.0 | 76.2 | 7.8 |
| – Percent of Open Interest Shorts: | 23.4 | 71.3 | 4.3 |
| – Net Position: | -38,171 | 22,322 | 15,849 |
| – Gross Longs: | 68,416 | 347,055 | 35,461 |
| – Gross Shorts: | 106,587 | 324,733 | 19,612 |
| – Long to Short Ratio: | 0.6 to 1 | 1.1 to 1 | 1.8 to 1 |
| NET POSITION TREND: | |||
| – COT Index Score (3 Year Range Pct): | 34.4 | 58.8 | 77.8 |
| – COT Index Reading (3 Year Range): | Bearish | Bullish | Bullish |
| NET POSITION MOVEMENT INDEX: | |||
| – 6-Week Change in Strength Index: | 19.3 | -24.1 | 24.8 |
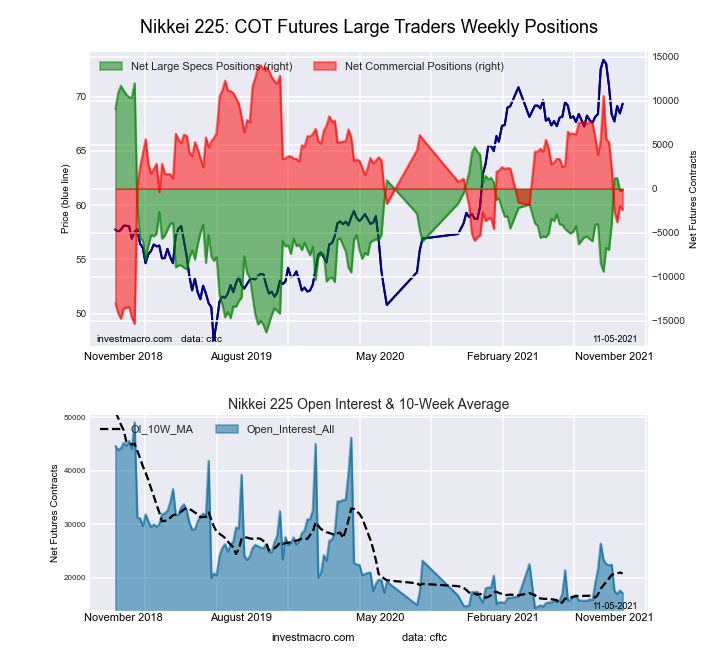
This week’s current strength score (the trader positioning range over the past three years, measured from 0 to 100) shows the speculators are currently Bullish with a score of 57.1 percent. The commercials are Bearish with a score of 44.1 percent and the small traders (not shown in chart) are Bullish with a score of 59.4 percent.
| Nikkei Stock Average Futures Statistics | SPECULATORS | COMMERCIALS | SMALL TRADERS |
| – Percent of Open Interest Longs: | 16.6 | 55.8 | 27.4 |
| – Percent of Open Interest Shorts: | 17.4 | 69.8 | 12.6 |
| – Net Position: | -146 | -2,393 | 2,539 |
| – Gross Longs: | 2,839 | 9,556 | 4,694 |
| – Gross Shorts: | 2,985 | 11,949 | 2,155 |
| – Long to Short Ratio: | 1.0 to 1 | 0.8 to 1 | 2.2 to 1 |
| NET POSITION TREND: | |||
| – COT Index Score (3 Year Range Pct): | 57.1 | 44.1 | 59.4 |
| – COT Index Reading (3 Year Range): | Bullish | Bearish | Bullish |
| NET POSITION MOVEMENT INDEX: | |||
| – 6-Week Change in Strength Index: | 23.1 | -27.3 | 18.9 |
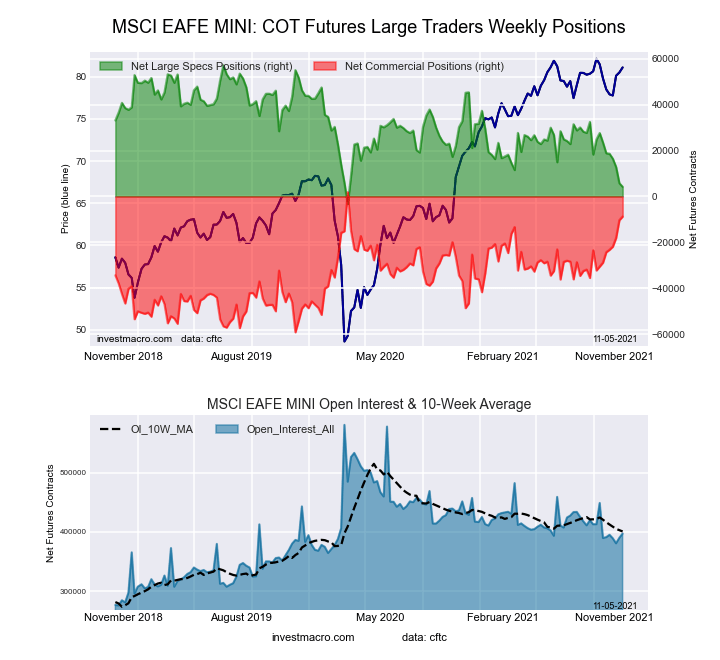
This week’s current strength score (the trader positioning range over the past three years, measured from 0 to 100) shows the speculators are currently Bearish-Extreme with a score of 12.5 percent. The commercials are Bullish-Extreme with a score of 82.5 percent and the small traders (not shown in chart) are Bullish with a score of 57.6 percent.
| MSCI EAFE Mini Futures Statistics | SPECULATORS | COMMERCIALS | SMALL TRADERS |
| – Percent of Open Interest Longs: | 6.7 | 90.3 | 2.6 |
| – Percent of Open Interest Shorts: | 5.7 | 92.6 | 1.5 |
| – Net Position: | 4,194 | -8,795 | 4,601 |
| – Gross Longs: | 26,738 | 358,992 | 10,509 |
| – Gross Shorts: | 22,544 | 367,787 | 5,908 |
| – Long to Short Ratio: | 1.2 to 1 | 1.0 to 1 | 1.8 to 1 |
| NET POSITION TREND: | |||
| – COT Index Score (3 Year Range Pct): | 12.5 | 82.5 | 57.6 |
| – COT Index Reading (3 Year Range): | Bearish-Extreme | Bullish-Extreme | Bullish |
| NET POSITION MOVEMENT INDEX: | |||
| – 6-Week Change in Strength Index: | -31.8 | 32.8 | -7.2 |
Article By InvestMacro – Receive our weekly COT Reports by Email
*COT Report: The COT data, released weekly to the public each Friday, is updated through the most recent Tuesday (data is 3 days old) and shows a quick view of how large speculators or non-commercials (for-profit traders) were positioned in the futures markets.
The CFTC categorizes trader positions according to commercial hedgers (traders who use futures contracts for hedging as part of the business), non-commercials (large traders who speculate to realize trading profits) and nonreportable traders (usually small traders/speculators) as well as their open interest (contracts open in the market at time of reporting).See CFTC criteria here.
By JustMarkets The US stock indices started the week on a downbeat note. By the…
By Analytical Department RoboForex GBP/USD fell to 1.3437 on Tuesday as investors assessed the appointment…
By JustMarkets The US stock indices ended Friday’s session in the red. By the end…
By Analytical Department RoboForex USD/JPY opens the week at 162.36 on Monday. The Japanese yen…
By InvestMacro Here are the latest charts and statistics for the Commitment of Traders (COT)…
By InvestMacro The latest update for the weekly Commitment of Traders (COT) report was released…
This website uses cookies.