By InvestMacro.com COT Home | Data Tables | Data Downloads | Newsletter
Here are the latest charts and statistics for the Commitment of Traders (COT) data published by the Commodities Futures Trading Commission (CFTC).
The latest COT data is updated through Tuesday October 19th 2021 and shows a quick view of how large traders (for-profit speculators and commercial entities) were positioned in the futures markets.
| Oct-19-2021 | OI | OI-Index | Spec-Net | Spec-Index | Com-Net | COM-Index | Smalls-Net | Smalls-Index |
|---|---|---|---|---|---|---|---|---|
| Eurodollar | 12,424,747 | 63 | -781,200 | 35 | 1,080,706 | 60 | -299,506 | 64 |
| FedFunds | 1,217,775 | 18 | -54,484 | 33 | 65,503 | 68 | -11,019 | 42 |
| 2-Year | 1,991,689 | 8 | -132,952 | 63 | 172,598 | 51 | -39,646 | 2 |
| Long T-Bond | 1,186,553 | 48 | -57,571 | 73 | 83,737 | 47 | -26,166 | 32 |
| 10-Year | 4,095,300 | 71 | -544 | 75 | 319,388 | 60 | -318,844 | 4 |
| 5-Year | 3,637,741 | 28 | -255,211 | 47 | 510,373 | 82 | -255,162 | 0 |
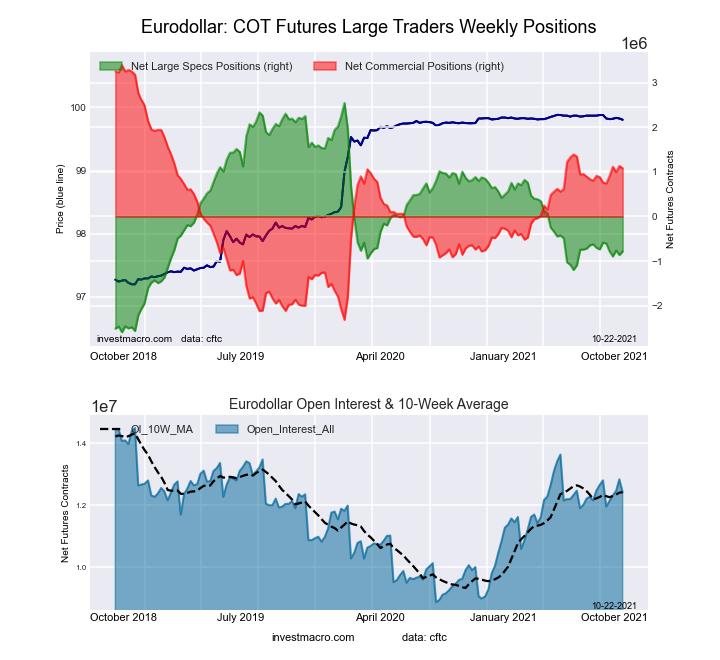
This week’s current strength score (the trader positioning range over the past three years, measured from 0 to 100) shows the speculators are currently Bearish with a score of 35.3 percent. The commercials are Bullish with a score of 59.5 percent and the small traders (not shown in chart) are Bullish with a score of 64.0 percent.
Free Reports:
| 3-Month Eurodollars Statistics | SPECULATORS | COMMERCIALS | SMALL TRADERS |
| – Percent of Open Interest Longs: | 12.6 | 63.4 | 4.5 |
| – Percent of Open Interest Shorts: | 18.9 | 54.7 | 6.9 |
| – Net Position: | -781,200 | 1,080,706 | -299,506 |
| – Gross Longs: | 1,565,312 | 7,876,268 | 563,787 |
| – Gross Shorts: | 2,346,512 | 6,795,562 | 863,293 |
| – Long to Short Ratio: | 0.7 to 1 | 1.2 to 1 | 0.7 to 1 |
| NET POSITION TREND: | |||
| – COT Index Score (3 Year Range Pct): | 35.3 | 59.5 | 64.0 |
| – COT Index Reading (3 Year Range): | Bearish | Bullish | Bullish |
| NET POSITION MOVEMENT INDEX: | |||
| – 6-Week Change in Strength Index: | -3.8 | 5.6 | -16.3 |
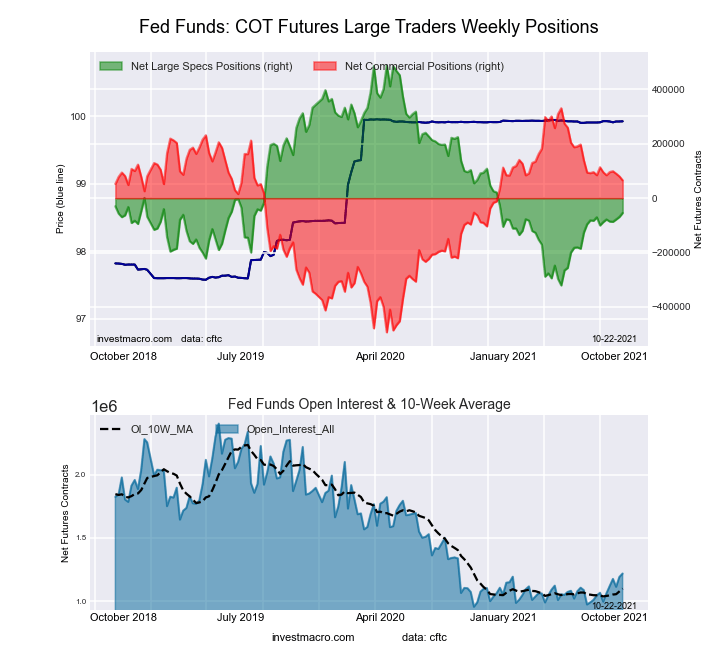
This week’s current strength score (the trader positioning range over the past three years, measured from 0 to 100) shows the speculators are currently Bearish with a score of 32.9 percent. The commercials are Bullish with a score of 67.8 percent and the small traders (not shown in chart) are Bearish with a score of 41.5 percent.
| 30-Day Federal Funds Statistics | SPECULATORS | COMMERCIALS | SMALL TRADERS |
| – Percent of Open Interest Longs: | 6.1 | 77.6 | 1.6 |
| – Percent of Open Interest Shorts: | 10.5 | 72.2 | 2.5 |
| – Net Position: | -54,484 | 65,503 | -11,019 |
| – Gross Longs: | 73,882 | 945,177 | 19,058 |
| – Gross Shorts: | 128,366 | 879,674 | 30,077 |
| – Long to Short Ratio: | 0.6 to 1 | 1.1 to 1 | 0.6 to 1 |
| NET POSITION TREND: | |||
| – COT Index Score (3 Year Range Pct): | 32.9 | 67.8 | 41.5 |
| – COT Index Reading (3 Year Range): | Bearish | Bullish | Bearish |
| NET POSITION MOVEMENT INDEX: | |||
| – 6-Week Change in Strength Index: | 4.1 | -3.6 | -8.2 |
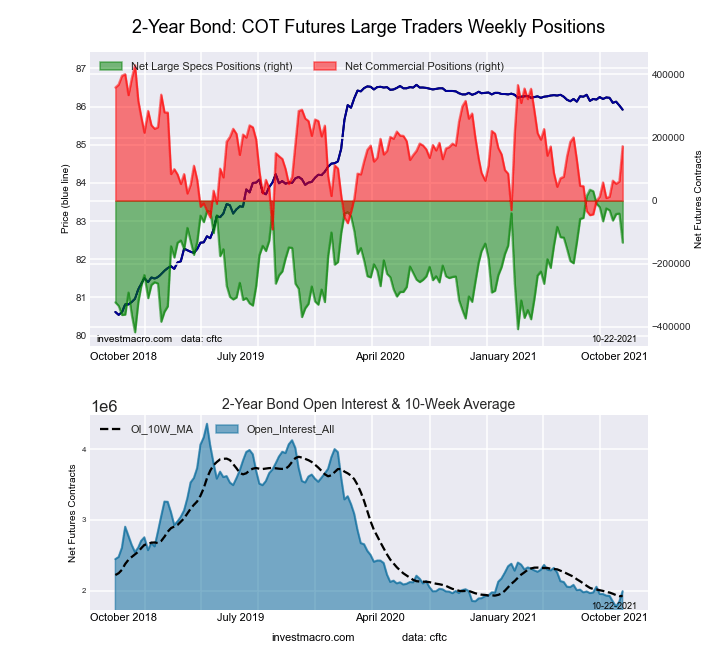
This week’s current strength score (the trader positioning range over the past three years, measured from 0 to 100) shows the speculators are currently Bullish with a score of 62.9 percent. The commercials are Bullish with a score of 50.6 percent and the small traders (not shown in chart) are Bearish-Extreme with a score of 2.2 percent.
| 2-Year Treasury Note Statistics | SPECULATORS | COMMERCIALS | SMALL TRADERS |
| – Percent of Open Interest Longs: | 17.6 | 73.6 | 6.5 |
| – Percent of Open Interest Shorts: | 24.3 | 64.9 | 8.5 |
| – Net Position: | -132,952 | 172,598 | -39,646 |
| – Gross Longs: | 350,293 | 1,465,365 | 129,379 |
| – Gross Shorts: | 483,245 | 1,292,767 | 169,025 |
| – Long to Short Ratio: | 0.7 to 1 | 1.1 to 1 | 0.8 to 1 |
| NET POSITION TREND: | |||
| – COT Index Score (3 Year Range Pct): | 62.9 | 50.6 | 2.2 |
| – COT Index Reading (3 Year Range): | Bullish | Bullish | Bearish-Extreme |
| NET POSITION MOVEMENT INDEX: | |||
| – 6-Week Change in Strength Index: | -15.0 | 22.1 | -28.3 |
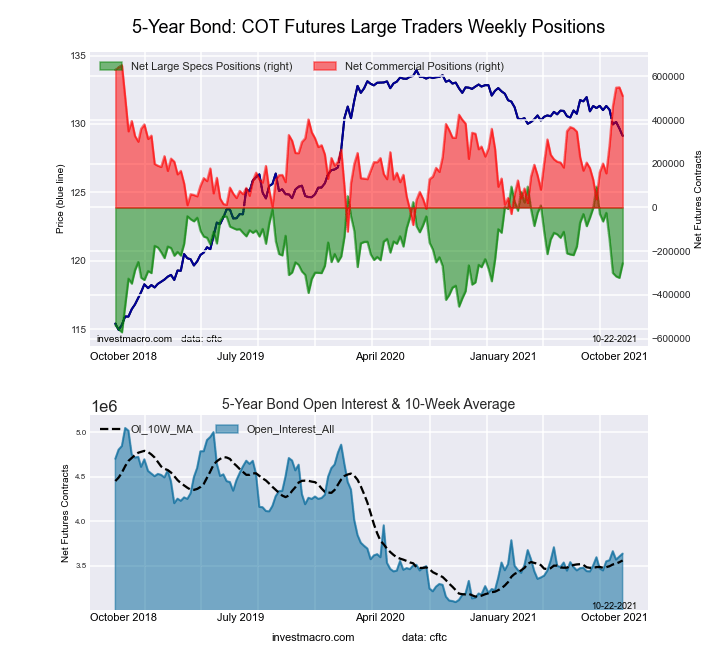
This week’s current strength score (the trader positioning range over the past three years, measured from 0 to 100) shows the speculators are currently Bearish with a score of 47.4 percent. The commercials are Bullish-Extreme with a score of 81.5 percent and the small traders (not shown in chart) are Bearish-Extreme with a score of 0.0 percent.
| 5-Year Treasury Note Statistics | SPECULATORS | COMMERCIALS | SMALL TRADERS |
| – Percent of Open Interest Longs: | 11.4 | 77.7 | 7.0 |
| – Percent of Open Interest Shorts: | 18.4 | 63.7 | 14.0 |
| – Net Position: | -255,211 | 510,373 | -255,162 |
| – Gross Longs: | 414,711 | 2,827,556 | 253,812 |
| – Gross Shorts: | 669,922 | 2,317,183 | 508,974 |
| – Long to Short Ratio: | 0.6 to 1 | 1.2 to 1 | 0.5 to 1 |
| NET POSITION TREND: | |||
| – COT Index Score (3 Year Range Pct): | 47.4 | 81.5 | 0.0 |
| – COT Index Reading (3 Year Range): | Bearish | Bullish-Extreme | Bearish-Extreme |
| NET POSITION MOVEMENT INDEX: | |||
| – 6-Week Change in Strength Index: | -28.8 | 40.6 | -36.1 |
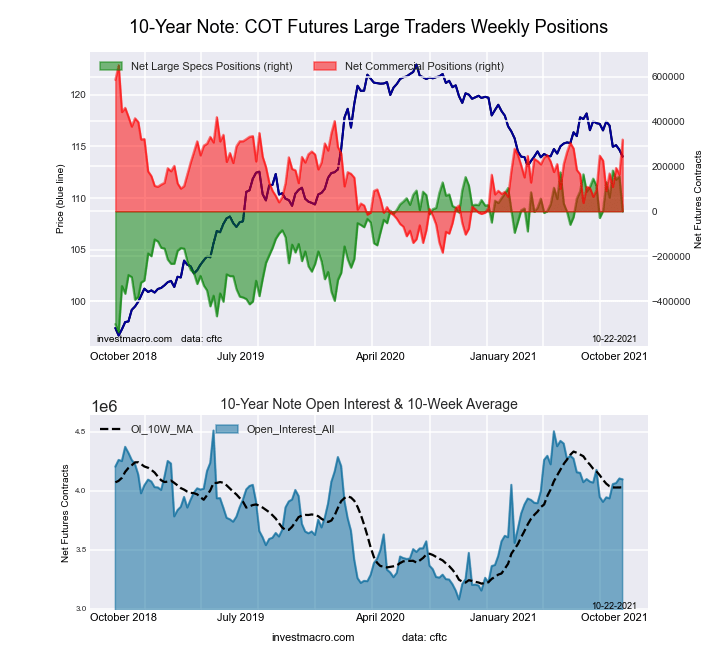
This week’s current strength score (the trader positioning range over the past three years, measured from 0 to 100) shows the speculators are currently Bullish with a score of 74.8 percent. The commercials are Bullish with a score of 60.3 percent and the small traders (not shown in chart) are Bearish-Extreme with a score of 3.6 percent.
| 10-Year Treasury Note Statistics | SPECULATORS | COMMERCIALS | SMALL TRADERS |
| – Percent of Open Interest Longs: | 18.2 | 71.4 | 7.2 |
| – Percent of Open Interest Shorts: | 18.2 | 63.6 | 15.0 |
| – Net Position: | -544 | 319,388 | -318,844 |
| – Gross Longs: | 743,719 | 2,922,085 | 295,191 |
| – Gross Shorts: | 744,263 | 2,602,697 | 614,035 |
| – Long to Short Ratio: | 1.0 to 1 | 1.1 to 1 | 0.5 to 1 |
| NET POSITION TREND: | |||
| – COT Index Score (3 Year Range Pct): | 74.8 | 60.3 | 3.6 |
| – COT Index Reading (3 Year Range): | Bullish | Bullish | Bearish-Extreme |
| NET POSITION MOVEMENT INDEX: | |||
| – 6-Week Change in Strength Index: | -0.2 | 11.2 | -21.7 |
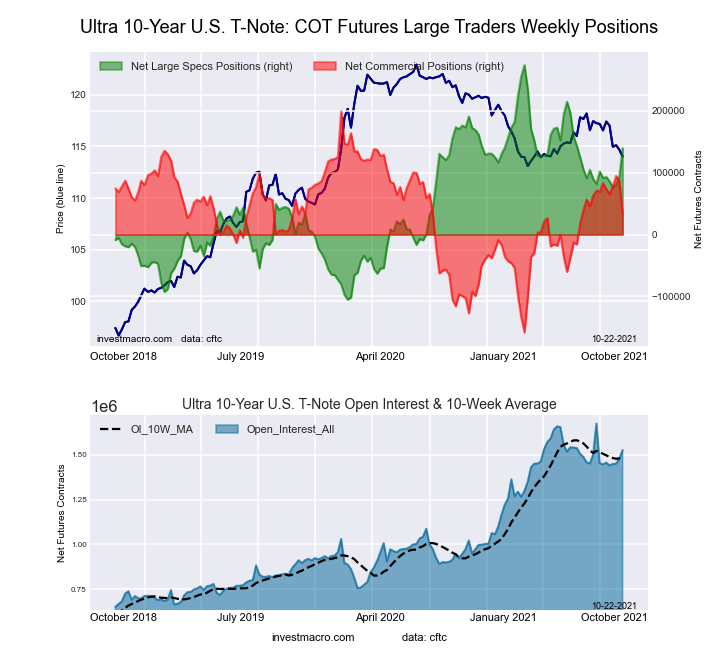
This week’s current strength score (the trader positioning range over the past three years, measured from 0 to 100) shows the speculators are currently Bullish with a score of 64.6 percent. The commercials are Bullish with a score of 53.3 percent and the small traders (not shown in chart) are Bearish-Extreme with a score of 5.6 percent.
| Ultra 10-Year Notes Statistics | SPECULATORS | COMMERCIALS | SMALL TRADERS |
| – Percent of Open Interest Longs: | 19.7 | 72.8 | 7.1 |
| – Percent of Open Interest Shorts: | 10.6 | 70.7 | 18.4 |
| – Net Position: | 139,559 | 32,149 | -171,708 |
| – Gross Longs: | 301,286 | 1,110,821 | 108,529 |
| – Gross Shorts: | 161,727 | 1,078,672 | 280,237 |
| – Long to Short Ratio: | 1.9 to 1 | 1.0 to 1 | 0.4 to 1 |
| NET POSITION TREND: | |||
| – COT Index Score (3 Year Range Pct): | 64.6 | 53.3 | 5.6 |
| – COT Index Reading (3 Year Range): | Bullish | Bullish | Bearish-Extreme |
| NET POSITION MOVEMENT INDEX: | |||
| – 6-Week Change in Strength Index: | 12.7 | -14.3 | 1.9 |
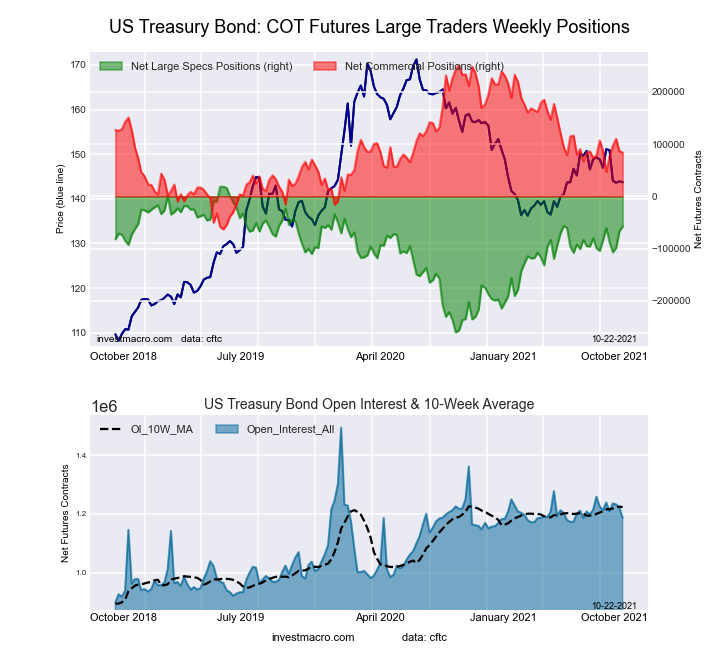
This week’s current strength score (the trader positioning range over the past three years, measured from 0 to 100) shows the speculators are currently Bullish with a score of 72.7 percent. The commercials are Bearish with a score of 46.8 percent and the small traders (not shown in chart) are Bearish with a score of 31.8 percent.
| US Treasury Bonds Statistics | SPECULATORS | COMMERCIALS | SMALL TRADERS |
| – Percent of Open Interest Longs: | 9.9 | 74.8 | 13.6 |
| – Percent of Open Interest Shorts: | 14.8 | 67.7 | 15.8 |
| – Net Position: | -57,571 | 83,737 | -26,166 |
| – Gross Longs: | 117,543 | 887,561 | 161,202 |
| – Gross Shorts: | 175,114 | 803,824 | 187,368 |
| – Long to Short Ratio: | 0.7 to 1 | 1.1 to 1 | 0.9 to 1 |
| NET POSITION TREND: | |||
| – COT Index Score (3 Year Range Pct): | 72.7 | 46.8 | 31.8 |
| – COT Index Reading (3 Year Range): | Bullish | Bearish | Bearish |
| NET POSITION MOVEMENT INDEX: | |||
| – 6-Week Change in Strength Index: | 9.3 | -0.9 | -18.4 |
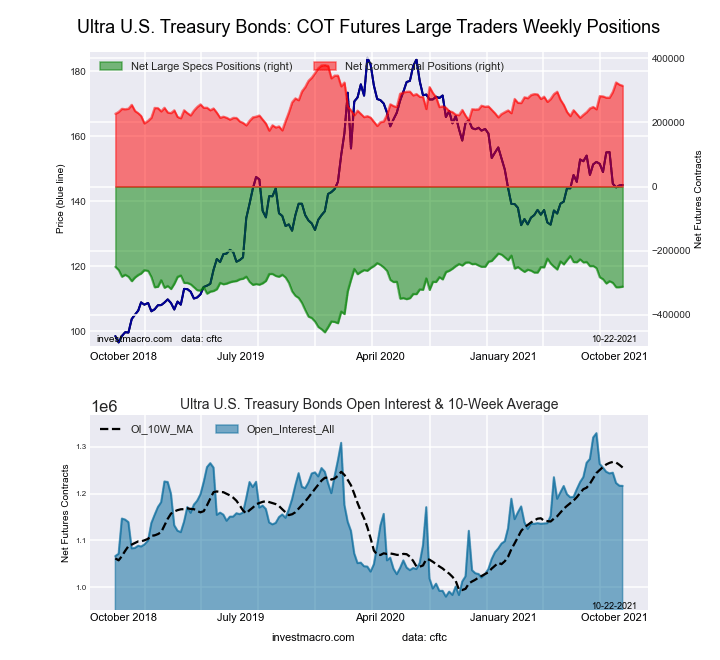
This week’s current strength score (the trader positioning range over the past three years, measured from 0 to 100) shows the speculators are currently Bullish with a score of 58.0 percent. The commercials are Bullish with a score of 68.5 percent and the small traders (not shown in chart) are Bearish with a score of 26.8 percent.
| Ultra US Treasury Bonds Statistics | SPECULATORS | COMMERCIALS | SMALL TRADERS |
| – Percent of Open Interest Longs: | 5.0 | 81.4 | 12.6 |
| – Percent of Open Interest Shorts: | 30.6 | 55.6 | 12.7 |
| – Net Position: | -311,777 | 313,784 | -2,007 |
| – Gross Longs: | 60,848 | 989,707 | 152,699 |
| – Gross Shorts: | 372,625 | 675,923 | 154,706 |
| – Long to Short Ratio: | 0.2 to 1 | 1.5 to 1 | 1.0 to 1 |
| NET POSITION TREND: | |||
| – COT Index Score (3 Year Range Pct): | 58.0 | 68.5 | 26.8 |
| – COT Index Reading (3 Year Range): | Bullish | Bullish | Bearish |
| NET POSITION MOVEMENT INDEX: | |||
| – 6-Week Change in Strength Index: | -9.5 | 16.2 | -7.1 |
Article By InvestMacro – Receive our weekly COT Reports by Email
*COT Report: The COT data, released weekly to the public each Friday, is updated through the most recent Tuesday (data is 3 days old) and shows a quick view of how large speculators or non-commercials (for-profit traders) were positioned in the futures markets.
The CFTC categorizes trader positions according to commercial hedgers (traders who use futures contracts for hedging as part of the business), non-commercials (large traders who speculate to realize trading profits) and nonreportable traders (usually small traders/speculators) as well as their open interest (contracts open in the market at time of reporting).
Find CFTC criteria here: (http://www.cftc.gov/MarketReports/CommitmentsofTraders/ExplanatoryNotes/index.htm).
By Analytical Department RoboForex Gold fell to 4,033 USD per ounce on Thursday, extending its…
By JustMarkets By the end of the day, the Dow Jones Index (US30) rose by…
By JustMarkets On Tuesday, the US stock indices finished the session in the green, supported…
By Analytical Department RoboForex GBP/USD rose to 1.3403 on Wednesday, with British politics taking centre…
By Analytical Department RoboForex USD/JPY ended Tuesday at 162.27, with the Japanese yen remaining near…
By JustMarkets On Friday, the Dow Jones Index (US30) rose by 0.29% (weekly: -0.36%). The…
This website uses cookies.