By CountingPips.com COT Home | Data Tables | Data Downloads | Newsletter
Here are the latest charts and statistics for the Commitment of Traders (COT) data published by the Commodities Futures Trading Commission (CFTC).
The latest COT data is updated through Tuesday August 31 2021 and shows a quick view of how large traders (for-profit speculators and commercial entities) were positioned in the futures markets.
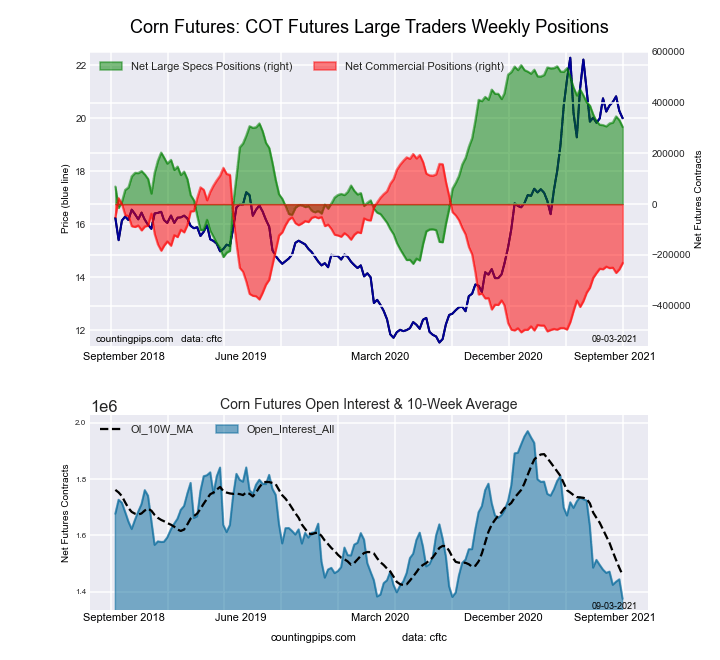
This week’s current strength score (the trader positioning range over the past three years, measured from 0 to 100) shows the speculators are currently Bullish with a score of 68.9 percent. The commercials are Bearish with a score of 38.9 percent and the small traders (not shown in chart) are Bearish-Extreme with a score of 1.5 percent.
| CORN Futures Statistics | SPECULATORS | COMMERCIALS | SMALL TRADERS |
| – Percent of Open Interest Longs: | 29.2 | 48.9 | 7.8 |
| – Percent of Open Interest Shorts: | 7.0 | 65.8 | 13.0 |
| – Net Position: | 304,172 | -231,861 | -72,311 |
| – Gross Longs: | 400,723 | 671,977 | 106,901 |
| – Gross Shorts: | 96,551 | 903,838 | 179,212 |
| – Long to Short Ratio: | 4.2 to 1 | 0.7 to 1 | 0.6 to 1 |
| NET POSITION TREND: | |||
| – COT Index Score (3 Year Range Pct): | 68.9 | 38.9 | 1.5 |
| – COT Index Reading (3 Year Range): | Bullish | Bearish | Bearish-Extreme |
| NET POSITION MOVEMENT INDEX: | |||
| – 6-Week Change in Strength Index: | -0.9 | 3.5 | -9.9 |
Free Reports:
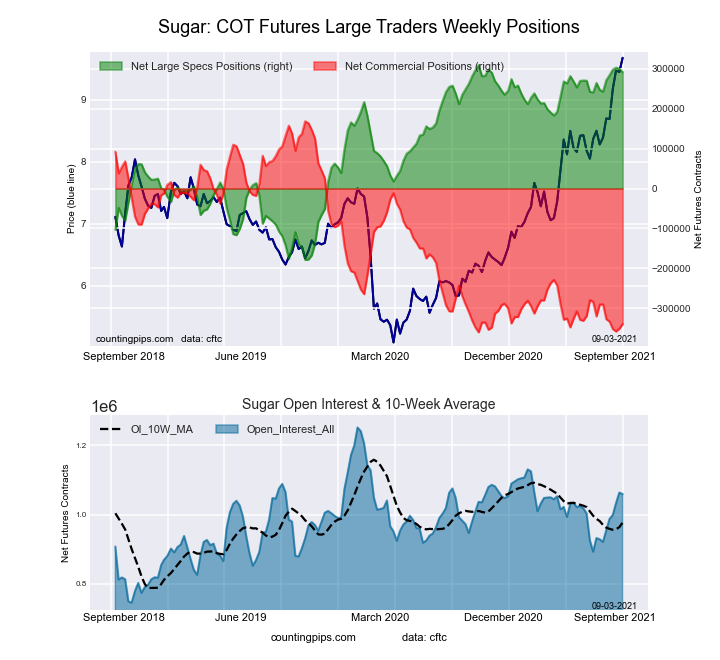
This week’s current strength score (the trader positioning range over the past three years, measured from 0 to 100) shows the speculators are currently Bullish-Extreme with a score of 96.5 percent. The commercials are Bearish-Extreme with a score of 3.9 percent and the small traders (not shown in chart) are Bullish with a score of 66.4 percent.
| SUGAR Futures Statistics | SPECULATORS | COMMERCIALS | SMALL TRADERS |
| – Percent of Open Interest Longs: | 31.5 | 44.4 | 9.0 |
| – Percent of Open Interest Shorts: | 4.0 | 76.4 | 4.5 |
| – Net Position: | 291,432 | -338,795 | 47,363 |
| – Gross Longs: | 333,709 | 470,073 | 95,216 |
| – Gross Shorts: | 42,277 | 808,868 | 47,853 |
| – Long to Short Ratio: | 7.9 to 1 | 0.6 to 1 | 2.0 to 1 |
| NET POSITION TREND: | |||
| – COT Index Score (3 Year Range Pct): | 96.5 | 3.9 | 66.4 |
| – COT Index Reading (3 Year Range): | Bullish-Extreme | Bearish-Extreme | Bullish |
| NET POSITION MOVEMENT INDEX: | |||
| – 6-Week Change in Strength Index: | 10.1 | -9.3 | 0.4 |
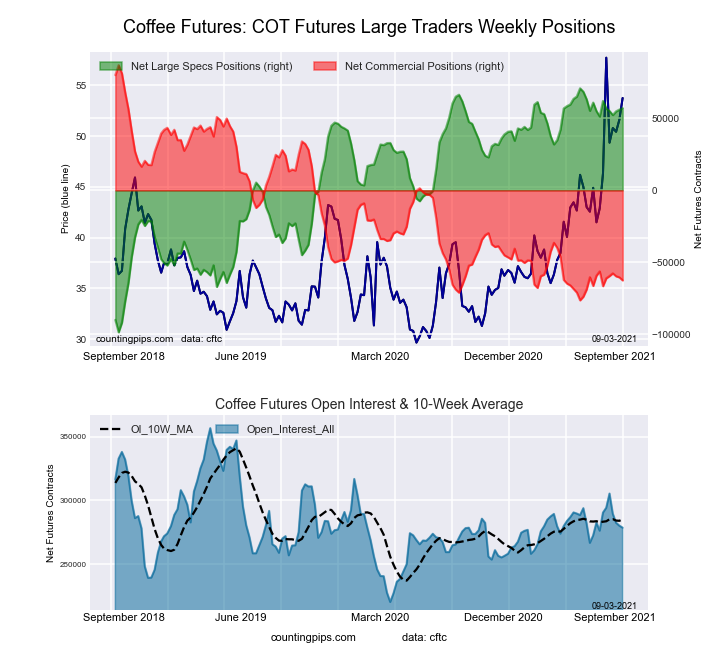
This week’s current strength score (the trader positioning range over the past three years, measured from 0 to 100) shows the speculators are currently Bullish-Extreme with a score of 91.9 percent. The commercials are Bearish-Extreme with a score of 8.5 percent and the small traders (not shown in chart) are Bearish with a score of 25.7 percent.
| COFFEE Futures Statistics | SPECULATORS | COMMERCIALS | SMALL TRADERS |
| – Percent of Open Interest Longs: | 27.2 | 44.1 | 3.8 |
| – Percent of Open Interest Shorts: | 6.7 | 66.5 | 1.9 |
| – Net Position: | 57,073 | -62,471 | 5,398 |
| – Gross Longs: | 75,669 | 122,913 | 10,593 |
| – Gross Shorts: | 18,596 | 185,384 | 5,195 |
| – Long to Short Ratio: | 4.1 to 1 | 0.7 to 1 | 2.0 to 1 |
| NET POSITION TREND: | |||
| – COT Index Score (3 Year Range Pct): | 91.9 | 8.5 | 25.7 |
| – COT Index Reading (3 Year Range): | Bullish-Extreme | Bearish-Extreme | Bearish |
| NET POSITION MOVEMENT INDEX: | |||
| – 6-Week Change in Strength Index: | -2.9 | 2.5 | 6.7 |
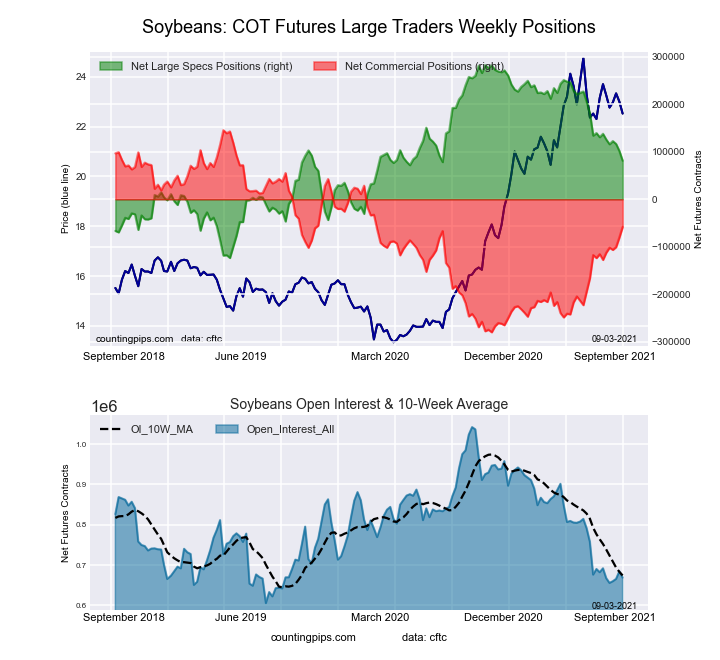
This week’s current strength score (the trader positioning range over the past three years, measured from 0 to 100) shows the speculators are currently Bullish with a score of 50.4 percent. The commercials are Bullish with a score of 52.1 percent and the small traders (not shown in chart) are Bearish with a score of 33.7 percent.
| SOYBEANS Futures Statistics | SPECULATORS | COMMERCIALS | SMALL TRADERS |
| – Percent of Open Interest Longs: | 23.8 | 55.9 | 6.6 |
| – Percent of Open Interest Shorts: | 11.6 | 64.6 | 10.0 |
| – Net Position: | 81,135 | -58,196 | -22,939 |
| – Gross Longs: | 158,981 | 374,153 | 44,292 |
| – Gross Shorts: | 77,846 | 432,349 | 67,231 |
| – Long to Short Ratio: | 2.0 to 1 | 0.9 to 1 | 0.7 to 1 |
| NET POSITION TREND: | |||
| – COT Index Score (3 Year Range Pct): | 50.4 | 52.1 | 33.7 |
| – COT Index Reading (3 Year Range): | Bullish | Bullish | Bearish |
| NET POSITION MOVEMENT INDEX: | |||
| – 6-Week Change in Strength Index: | -13.9 | 16.3 | -21.3 |
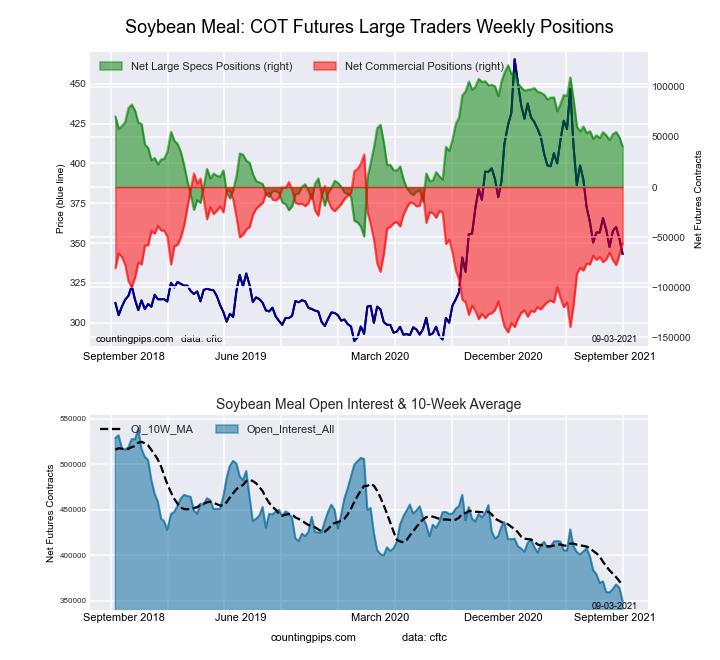
This week’s current strength score (the trader positioning range over the past three years, measured from 0 to 100) shows the speculators are currently Bullish with a score of 52.5 percent. The commercials are Bearish with a score of 50.0 percent and the small traders (not shown in chart) are Bearish with a score of 33.8 percent.
| SOYBEAN MEAL Futures Statistics | SPECULATORS | COMMERCIALS | SMALL TRADERS |
| – Percent of Open Interest Longs: | 24.0 | 52.3 | 12.1 |
| – Percent of Open Interest Shorts: | 12.4 | 68.4 | 7.6 |
| – Net Position: | 40,508 | -56,278 | 15,770 |
| – Gross Longs: | 83,951 | 182,811 | 42,422 |
| – Gross Shorts: | 43,443 | 239,089 | 26,652 |
| – Long to Short Ratio: | 1.9 to 1 | 0.8 to 1 | 1.6 to 1 |
| NET POSITION TREND: | |||
| – COT Index Score (3 Year Range Pct): | 52.5 | 50.0 | 33.8 |
| – COT Index Reading (3 Year Range): | Bullish | Bearish | Bearish |
| NET POSITION MOVEMENT INDEX: | |||
| – 6-Week Change in Strength Index: | -8.4 | 10.5 | -16.9 |
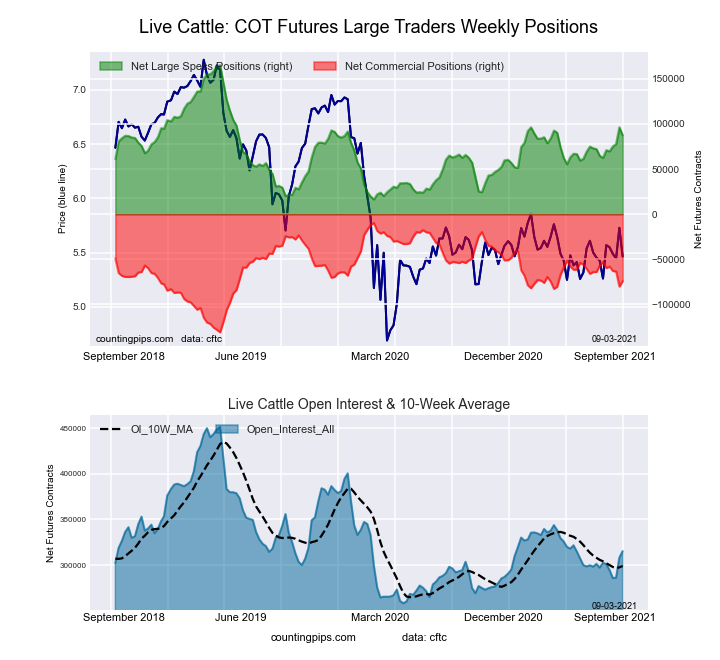
This week’s current strength score (the trader positioning range over the past three years, measured from 0 to 100) shows the speculators are currently Bearish with a score of 47.8 percent. The commercials are Bearish with a score of 46.8 percent and the small traders (not shown in chart) are Bullish with a score of 54.4 percent.
| LIVE CATTLE Futures Statistics | SPECULATORS | COMMERCIALS | SMALL TRADERS |
| – Percent of Open Interest Longs: | 38.8 | 37.2 | 9.2 |
| – Percent of Open Interest Shorts: | 11.0 | 60.7 | 13.4 |
| – Net Position: | 87,565 | -74,129 | -13,436 |
| – Gross Longs: | 122,204 | 117,107 | 28,874 |
| – Gross Shorts: | 34,639 | 191,236 | 42,310 |
| – Long to Short Ratio: | 3.5 to 1 | 0.6 to 1 | 0.7 to 1 |
| NET POSITION TREND: | |||
| – COT Index Score (3 Year Range Pct): | 47.8 | 46.8 | 54.4 |
| – COT Index Reading (3 Year Range): | Bearish | Bearish | Bullish |
| NET POSITION MOVEMENT INDEX: | |||
| – 6-Week Change in Strength Index: | 16.9 | -17.4 | -10.0 |
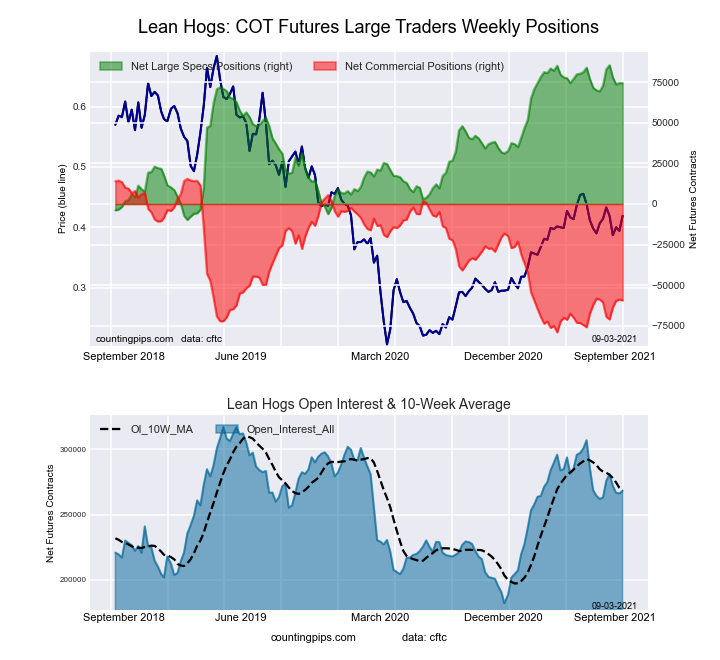
This week’s current strength score (the trader positioning range over the past three years, measured from 0 to 100) shows the speculators are currently Bullish-Extreme with a score of 88.4 percent. The commercials are Bearish with a score of 20.8 percent and the small traders (not shown in chart) are Bearish-Extreme with a score of 6.5 percent.
| LEAN HOGS Futures Statistics | SPECULATORS | COMMERCIALS | SMALL TRADERS |
| – Percent of Open Interest Longs: | 45.1 | 31.2 | 7.3 |
| – Percent of Open Interest Shorts: | 17.4 | 53.3 | 12.9 |
| – Net Position: | 74,486 | -59,433 | -15,053 |
| – Gross Longs: | 121,091 | 83,613 | 19,463 |
| – Gross Shorts: | 46,605 | 143,046 | 34,516 |
| – Long to Short Ratio: | 2.6 to 1 | 0.6 to 1 | 0.6 to 1 |
| NET POSITION TREND: | |||
| – COT Index Score (3 Year Range Pct): | 88.4 | 20.8 | 6.5 |
| – COT Index Reading (3 Year Range): | Bullish-Extreme | Bearish | Bearish-Extreme |
| NET POSITION MOVEMENT INDEX: | |||
| – 6-Week Change in Strength Index: | 1.5 | 1.4 | -13.1 |
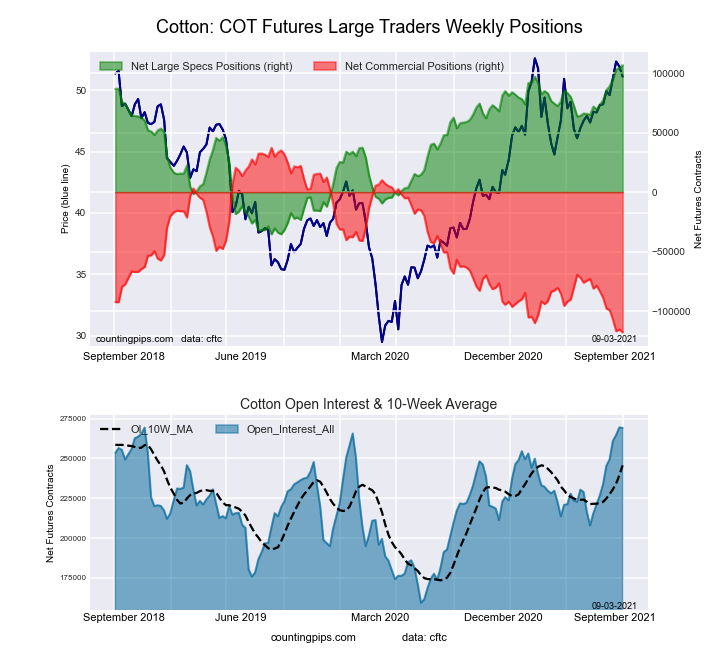
This week’s current strength score (the trader positioning range over the past three years, measured from 0 to 100) shows the speculators are currently Bullish-Extreme with a score of 100.0 percent. The commercials are Bearish-Extreme with a score of 0.0 percent and the small traders (not shown in chart) are Bullish-Extreme with a score of 82.9 percent.
| COTTON Futures Statistics | SPECULATORS | COMMERCIALS | SMALL TRADERS |
| – Percent of Open Interest Longs: | 44.9 | 35.7 | 7.1 |
| – Percent of Open Interest Shorts: | 5.2 | 79.4 | 3.0 |
| – Net Position: | 106,714 | -117,829 | 11,115 |
| – Gross Longs: | 120,766 | 95,982 | 19,089 |
| – Gross Shorts: | 14,052 | 213,811 | 7,974 |
| – Long to Short Ratio: | 8.6 to 1 | 0.4 to 1 | 2.4 to 1 |
| NET POSITION TREND: | |||
| – COT Index Score (3 Year Range Pct): | 100.0 | 0.0 | 82.9 |
| – COT Index Reading (3 Year Range): | Bullish-Extreme | Bearish-Extreme | Bullish-Extreme |
| NET POSITION MOVEMENT INDEX: | |||
| – 6-Week Change in Strength Index: | 20.7 | -18.6 | -3.4 |
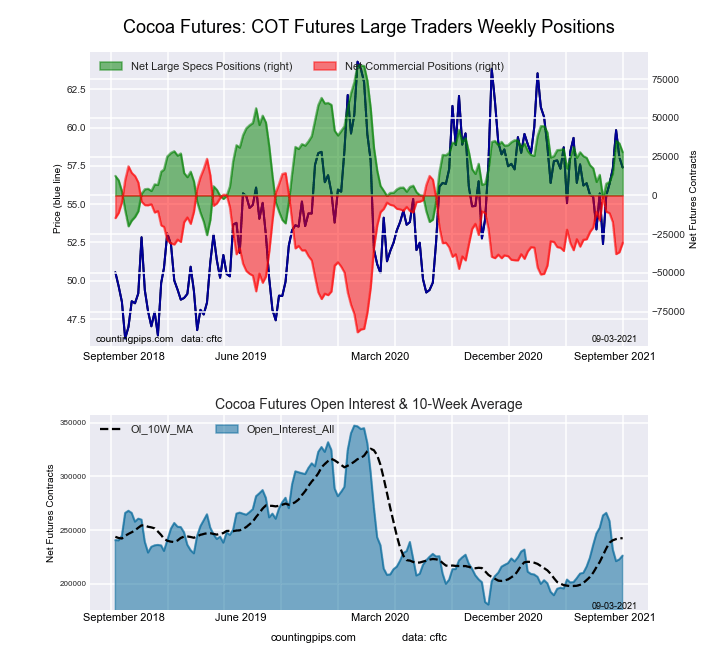
This week’s current strength score (the trader positioning range over the past three years, measured from 0 to 100) shows the speculators are currently Bearish with a score of 48.8 percent. The commercials are Bullish with a score of 51.6 percent and the small traders (not shown in chart) are Bearish with a score of 39.0 percent.
| COCOA Futures Statistics | SPECULATORS | COMMERCIALS | SMALL TRADERS |
| – Percent of Open Interest Longs: | 28.7 | 54.5 | 5.0 |
| – Percent of Open Interest Shorts: | 16.4 | 68.0 | 3.8 |
| – Net Position: | 27,909 | -30,595 | 2,686 |
| – Gross Longs: | 64,948 | 123,250 | 11,365 |
| – Gross Shorts: | 37,039 | 153,845 | 8,679 |
| – Long to Short Ratio: | 1.8 to 1 | 0.8 to 1 | 1.3 to 1 |
| NET POSITION TREND: | |||
| – COT Index Score (3 Year Range Pct): | 48.8 | 51.6 | 39.0 |
| – COT Index Reading (3 Year Range): | Bearish | Bullish | Bearish |
| NET POSITION MOVEMENT INDEX: | |||
| – 6-Week Change in Strength Index: | 27.1 | -26.6 | 0.2 |
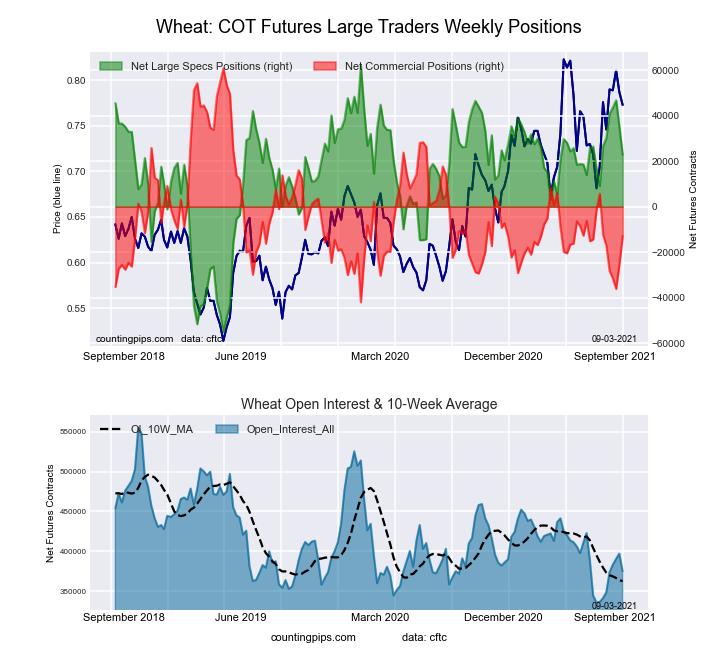
This week’s current strength score (the trader positioning range over the past three years, measured from 0 to 100) shows the speculators are currently Bullish with a score of 66.4 percent. The commercials are Bearish with a score of 28.2 percent and the small traders (not shown in chart) are Bullish with a score of 54.5 percent.
| WHEAT Futures Statistics | SPECULATORS | COMMERCIALS | SMALL TRADERS |
| – Percent of Open Interest Longs: | 29.9 | 39.3 | 7.5 |
| – Percent of Open Interest Shorts: | 23.8 | 42.7 | 10.1 |
| – Net Position: | 22,805 | -12,943 | -9,862 |
| – Gross Longs: | 112,124 | 147,230 | 27,952 |
| – Gross Shorts: | 89,319 | 160,173 | 37,814 |
| – Long to Short Ratio: | 1.3 to 1 | 0.9 to 1 | 0.7 to 1 |
| NET POSITION TREND: | |||
| – COT Index Score (3 Year Range Pct): | 66.4 | 28.2 | 54.5 |
| – COT Index Reading (3 Year Range): | Bullish | Bearish | Bullish |
| NET POSITION MOVEMENT INDEX: | |||
| – 6-Week Change in Strength Index: | -3.4 | -0.6 | 22.0 |
Article By CountingPips.com – Receive our weekly COT Reports by Email
*COT Report: The COT data, released weekly to the public each Friday, is updated through the most recent Tuesday (data is 3 days old) and shows a quick view of how large speculators or non-commercials (for-profit traders) were positioned in the futures markets.
The CFTC categorizes trader positions according to commercial hedgers (traders who use futures contracts for hedging as part of the business), non-commercials (large traders who speculate to realize trading profits) and nonreportable traders (usually small traders/speculators).
Find CFTC criteria here: (http://www.cftc.gov/MarketReports/CommitmentsofTraders/ExplanatoryNotes/index.htm).
By JustMarkets The US stock indices ended Friday’s session in the red. By the end…
By Analytical Department RoboForex USD/JPY opens the week at 162.36 on Monday. The Japanese yen…
By InvestMacro Here are the latest charts and statistics for the Commitment of Traders (COT)…
By InvestMacro The latest update for the weekly Commitment of Traders (COT) report was released…
By InvestMacro Here are the latest charts and statistics for the Commitment of Traders (COT)…
By InvestMacro Here are the latest charts and statistics for the Commitment of Traders (COT)…
This website uses cookies.