

After the lows caused by the coronavirus pandemic, West Texas Intermediate (WTI) oil has been on a bullish rally.
This rally has taken crude oil prices from the lows of $6.50, recorded in April 2020, to $77 per barrel in early July this year. This represents an increase of more than 1000% in just over a year.
However, it seems that the market is beginning to emit signs of exhaustion.
The sharp increase in price of crude oil presents a risk for every economy on the planet by exerting pressure on inflation. This is why, in July, OPEC announced measures to increase production and try to slow the increase in price.
Free Reports:


However, once again, it is the coronavirus pandemic that has had an impact of slowing the rise in price of oil. The rapid spread of the new and more infectious delta variant has dampened the prospects of oil demand in the future, as fears arise of new mobility restrictions.
In addition, oil supply increased significantly and unexpectedly last week – as shown by the U.S. Crude Oil Inventories report, published on Wednesday by the Energy Information Administration (EIA).
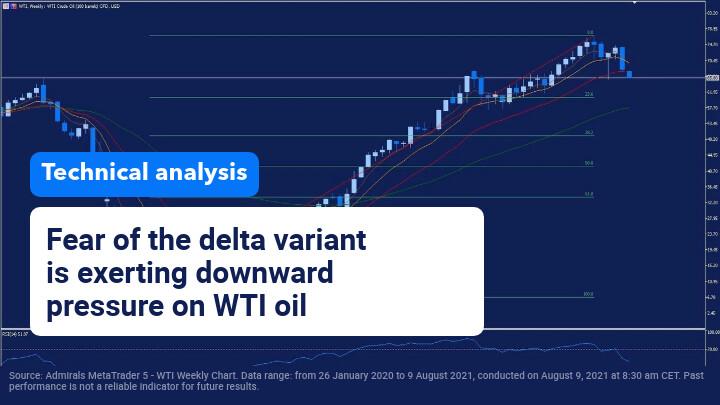
The chart above shows the weekly evolution in the price of a barrel of WTI crude oil.
Straight away, it is easy to see that for most of the last year there has been a marked upward trend, as reflected in the exponential moving averages of 5 periods (brown), 10 periods (orange), 20 periods (red) and 50 periods (green).
However, in recent weeks they have started to change their inclination and/or direction.
Shorter moving averages contract faster than those with a greater number of periods. As a result, crosses are occurring between them – which traders interpret as sell signals.
Without a doubt, WTI oil is one of the assets that could see greater volatility this week, with some traders looking for new reference levels of where to re-enter the market in a bearish scenario – which is something that could happen at the psychological barrier of 60 dollars per barrel, a level that is located in the 23.6 Fibonacci retracement.
Did you know that customers of Admirals have access to free Technical Insight in Trading Central? Here, traders will find trading ideas for WTI oil and in thousands of different instruments! Trading Central is just one of the additional tools available in the MetaTrader Supreme Edition add-on!
Start your free download by clicking the banner below:
INFORMATION ABOUT ANALYTICAL MATERIALS:
The given data provides additional information regarding all analysis, estimates, prognosis, forecasts, market reviews, weekly outlooks or other similar assessments or information (hereinafter “Analysis”) published on the websites of Admiral Markets investment firms operating under the Admiral Markets trademark (hereinafter “Admiral Markets”) Before making any investment decisions please pay close attention to the following:
By JustMarkets At the end of Monday, the Dow Jones Index (US30) rose by 0.78%.…
By ForexTime CN50 rebounds over 10% from 2025 low China GDP expected to slow to…
By RoboForex Analytical Department On Tuesday, the price of gold climbed to 3,220 USD per…
By JustMarkets At Friday’s close, the Dow Jones Index (US30) was up 1.56% (for the…
By InvestMacro Here are the latest charts and statistics for the Commitment of Traders (COT)…
By InvestMacro The latest update for the weekly Commitment of Traders (COT) report was released…
This website uses cookies.