By CountingPips.com COT Home | Data Tables | Data Downloads | Newsletter
Here are the latest charts and statistics for the Commitment of Traders (COT) data published by the Commodities Futures Trading Commission (CFTC).
The latest COT data is updated through Tuesday June 01 2021 and shows a quick view of how large traders (for-profit speculators and commercial entities) were positioned in the futures markets.
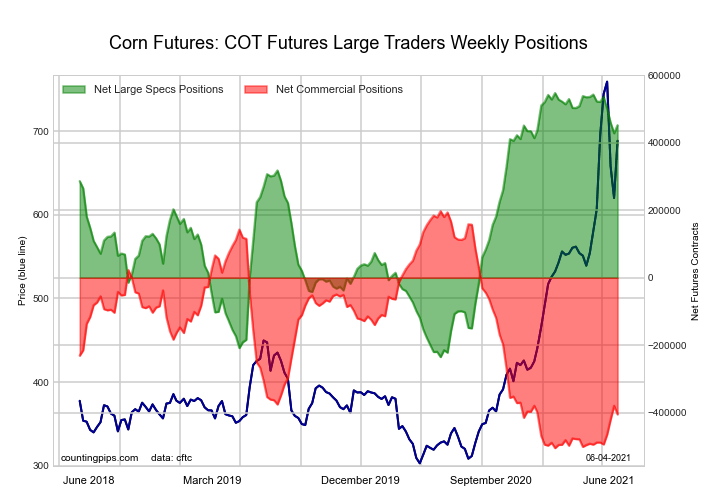
The CORN large speculator standing this week equaled a net position of 452,376 contracts in the data reported through Tuesday. This was a weekly increase of 23,950 contracts from the previous week which had a total of 428,426 net contracts.
This week’s current strength score (the trader positioning range over the past three years, measured from 0 to 100) shows the speculators are currently Bullish-Extreme with a score of 87.8 percent. The commercials are Bearish-Extreme with a score of 14.2 percent and the small traders (not shown in chart) are Bearish-Extreme with a score of 9.5 percent.
Free Reports:
| CORN Futures Statistics | SPECULATORS | COMMERCIALS | SMALL TRADERS |
| – Percent of Open Interest Longs: | 30.6 | 48.2 | 8.2 |
| – Percent of Open Interest Shorts: | 4.5 | 71.5 | 10.9 |
| – Net Position: | 452,376 | -405,083 | -47,293 |
| – Gross Longs: | 531,338 | 836,578 | 142,392 |
| – Gross Shorts: | 78,962 | 1,241,661 | 189,685 |
| – Long to Short Ratio: | 6.7 to 1 | 0.7 to 1 | 0.8 to 1 |
| NET POSITION TREND: | |||
| – COT Index Score (3 Year Range Pct): | 87.8 | 14.2 | 9.5 |
| – COT Index Reading (3 Year Range): | Bullish-Extreme | Bearish-Extreme | Bearish-Extreme |
| NET POSITION MOVEMENT INDEX: | |||
| – 6-Week Change in Strength Index: | -9.0 | 11.9 | -8.1 |
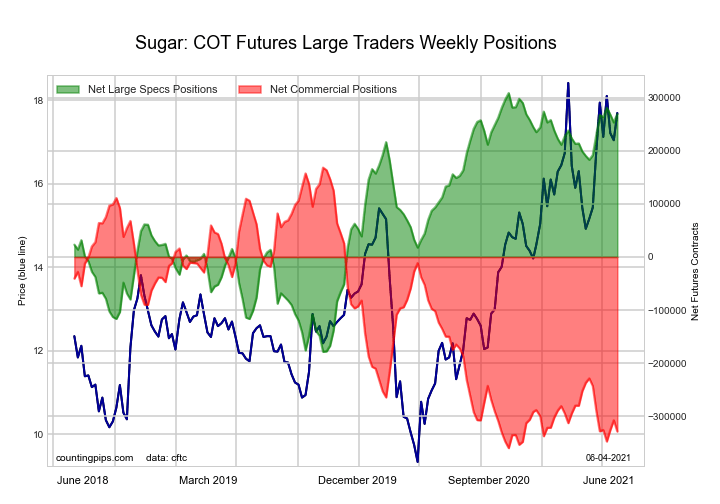
The SUGAR large speculator standing this week equaled a net position of 269,226 contracts in the data reported through Tuesday. This was a weekly lift of 16,235 contracts from the previous week which had a total of 252,991 net contracts.
This week’s current strength score (the trader positioning range over the past three years, measured from 0 to 100) shows the speculators are currently Bullish-Extreme with a score of 91.9 percent. The commercials are Bearish-Extreme with a score of 5.9 percent and the small traders (not shown in chart) are Bullish-Extreme with a score of 80.9 percent.
| SUGAR Futures Statistics | SPECULATORS | COMMERCIALS | SMALL TRADERS |
| – Percent of Open Interest Longs: | 30.2 | 45.0 | 9.6 |
| – Percent of Open Interest Shorts: | 3.9 | 77.0 | 3.9 |
| – Net Position: | 269,226 | -328,283 | 59,057 |
| – Gross Longs: | 309,620 | 461,251 | 98,664 |
| – Gross Shorts: | 40,394 | 789,534 | 39,607 |
| – Long to Short Ratio: | 7.7 to 1 | 0.6 to 1 | 2.5 to 1 |
| NET POSITION TREND: | |||
| – COT Index Score (3 Year Range Pct): | 91.9 | 5.9 | 80.9 |
| – COT Index Reading (3 Year Range): | Bullish-Extreme | Bearish-Extreme | Bullish-Extreme |
| NET POSITION MOVEMENT INDEX: | |||
| – 6-Week Change in Strength Index: | 8.2 | -7.4 | -1.1 |
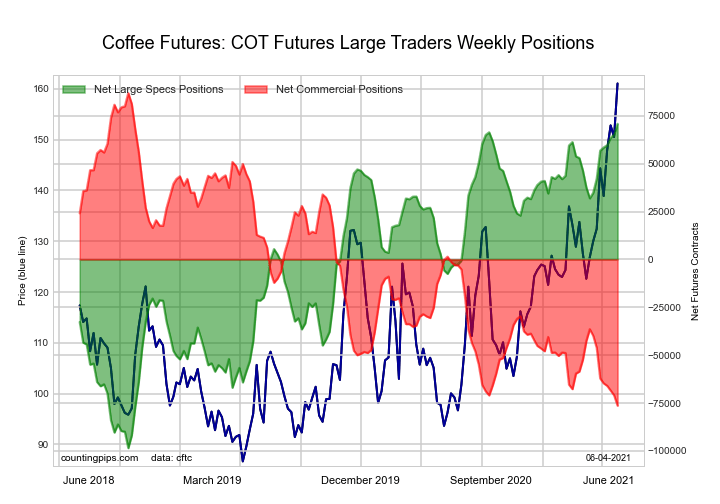
The COFFEE large speculator standing this week equaled a net position of 70,773 contracts in the data reported through Tuesday. This was a weekly advance of 5,659 contracts from the previous week which had a total of 65,114 net contracts.
This week’s current strength score (the trader positioning range over the past three years, measured from 0 to 100) shows the speculators are currently Bullish-Extreme with a score of 100.0 percent. The commercials are Bearish-Extreme with a score of 0.0 percent and the small traders (not shown in chart) are Bearish with a score of 26.7 percent.
| COFFEE Futures Statistics | SPECULATORS | COMMERCIALS | SMALL TRADERS |
| – Percent of Open Interest Longs: | 31.4 | 44.6 | 4.7 |
| – Percent of Open Interest Shorts: | 6.8 | 71.0 | 2.8 |
| – Net Position: | 70,773 | -76,318 | 5,545 |
| – Gross Longs: | 90,442 | 128,594 | 13,600 |
| – Gross Shorts: | 19,669 | 204,912 | 8,055 |
| – Long to Short Ratio: | 4.6 to 1 | 0.6 to 1 | 1.7 to 1 |
| NET POSITION TREND: | |||
| – COT Index Score (3 Year Range Pct): | 100.0 | 0.0 | 26.7 |
| – COT Index Reading (3 Year Range): | Bullish-Extreme | Bearish-Extreme | Bearish |
| NET POSITION MOVEMENT INDEX: | |||
| – 6-Week Change in Strength Index: | 16.9 | -18.5 | 10.2 |
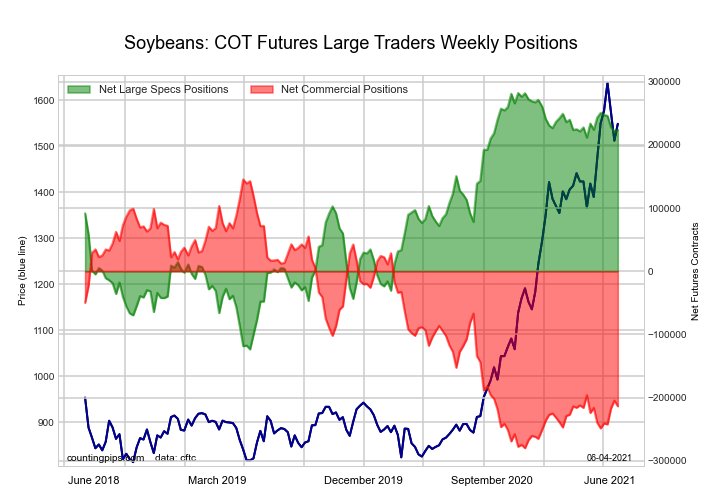
The SOYBEANS large speculator standing this week equaled a net position of 224,076 contracts in the data reported through Tuesday. This was a weekly advance of 3,021 contracts from the previous week which had a total of 221,055 net contracts.
This week’s current strength score (the trader positioning range over the past three years, measured from 0 to 100) shows the speculators are currently Bullish-Extreme with a score of 85.7 percent. The commercials are Bearish-Extreme with a score of 15.6 percent and the small traders (not shown in chart) are Bullish with a score of 54.2 percent.
| SOYBEANS Futures Statistics | SPECULATORS | COMMERCIALS | SMALL TRADERS |
| – Percent of Open Interest Longs: | 34.2 | 44.9 | 7.1 |
| – Percent of Open Interest Shorts: | 6.5 | 71.3 | 8.4 |
| – Net Position: | 224,076 | -213,475 | -10,601 |
| – Gross Longs: | 276,257 | 362,855 | 57,600 |
| – Gross Shorts: | 52,181 | 576,330 | 68,201 |
| – Long to Short Ratio: | 5.3 to 1 | 0.6 to 1 | 0.8 to 1 |
| NET POSITION TREND: | |||
| – COT Index Score (3 Year Range Pct): | 85.7 | 15.6 | 54.2 |
| – COT Index Reading (3 Year Range): | Bullish-Extreme | Bearish-Extreme | Bullish |
| NET POSITION MOVEMENT INDEX: | |||
| – 6-Week Change in Strength Index: | -4.7 | 6.1 | -11.4 |
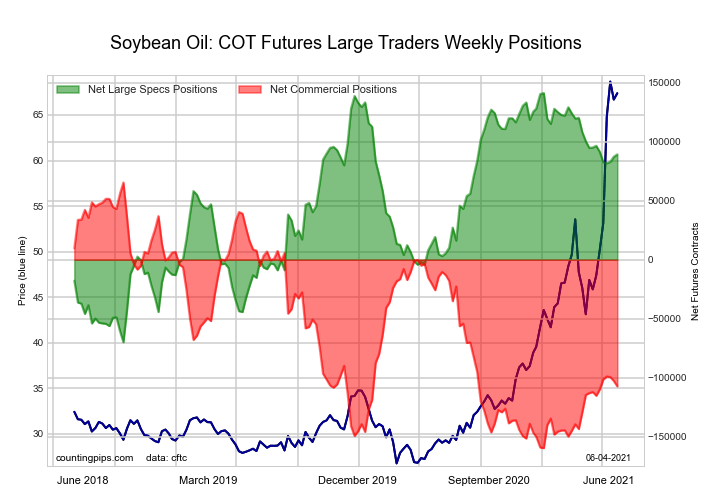
The SOYBEAN OIL large speculator standing this week equaled a net position of 89,233 contracts in the data reported through Tuesday. This was a weekly rise of 2,030 contracts from the previous week which had a total of 87,203 net contracts.
This week’s current strength score (the trader positioning range over the past three years, measured from 0 to 100) shows the speculators are currently Bullish with a score of 75.4 percent. The commercials are Bearish with a score of 23.3 percent and the small traders (not shown in chart) are Bullish-Extreme with a score of 80.6 percent.
| SOYBEAN OIL Futures Statistics | SPECULATORS | COMMERCIALS | SMALL TRADERS |
| – Percent of Open Interest Longs: | 23.8 | 46.6 | 8.4 |
| – Percent of Open Interest Shorts: | 7.2 | 66.6 | 5.1 |
| – Net Position: | 89,233 | -107,222 | 17,989 |
| – Gross Longs: | 127,933 | 250,077 | 45,175 |
| – Gross Shorts: | 38,700 | 357,299 | 27,186 |
| – Long to Short Ratio: | 3.3 to 1 | 0.7 to 1 | 1.7 to 1 |
| NET POSITION TREND: | |||
| – COT Index Score (3 Year Range Pct): | 75.4 | 23.3 | 80.6 |
| – COT Index Reading (3 Year Range): | Bullish | Bearish | Bullish-Extreme |
| NET POSITION MOVEMENT INDEX: | |||
| – 6-Week Change in Strength Index: | -3.4 | 3.5 | -2.7 |
The SOYBEAN MEAL large speculator standing this week equaled a net position of 55,536 contracts in the data reported through Tuesday. This was a weekly fall of -4,758 contracts from the previous week which had a total of 60,294 net contracts.
This week’s current strength score (the trader positioning range over the past three years, measured from 0 to 100) shows the speculators are currently Bullish with a score of 60.5 percent. The commercials are Bearish with a score of 36.2 percent and the small traders (not shown in chart) are Bullish with a score of 71.4 percent.
| SOYBEAN MEAL Futures Statistics | SPECULATORS | COMMERCIALS | SMALL TRADERS |
| – Percent of Open Interest Longs: | 21.6 | 51.4 | 12.5 |
| – Percent of Open Interest Shorts: | 7.7 | 71.5 | 6.2 |
| – Net Position: | 55,536 | -80,692 | 25,156 |
| – Gross Longs: | 86,450 | 205,859 | 50,157 |
| – Gross Shorts: | 30,914 | 286,551 | 25,001 |
| – Long to Short Ratio: | 2.8 to 1 | 0.7 to 1 | 2.0 to 1 |
| NET POSITION TREND: | |||
| – COT Index Score (3 Year Range Pct): | 60.5 | 36.2 | 71.4 |
| – COT Index Reading (3 Year Range): | Bullish | Bearish | Bullish |
| NET POSITION MOVEMENT INDEX: | |||
| – 6-Week Change in Strength Index: | -15.8 | 17.0 | -11.3 |
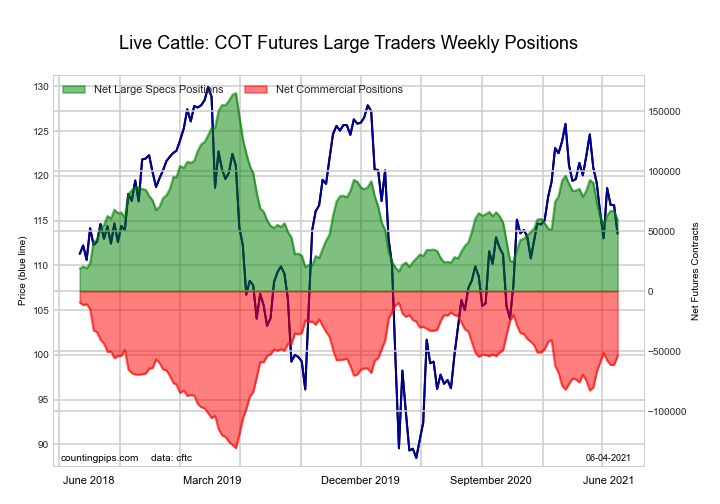
The LIVE CATTLE large speculator standing this week equaled a net position of 59,486 contracts in the data reported through Tuesday. This was a weekly reduction of -7,105 contracts from the previous week which had a total of 66,591 net contracts.
This week’s current strength score (the trader positioning range over the past three years, measured from 0 to 100) shows the speculators are currently Bearish with a score of 28.9 percent. The commercials are Bullish with a score of 63.4 percent and the small traders (not shown in chart) are Bullish with a score of 73.4 percent.
| LIVE CATTLE Futures Statistics | SPECULATORS | COMMERCIALS | SMALL TRADERS |
| – Percent of Open Interest Longs: | 37.4 | 39.0 | 9.6 |
| – Percent of Open Interest Shorts: | 18.0 | 56.5 | 11.4 |
| – Net Position: | 59,486 | -53,868 | -5,618 |
| – Gross Longs: | 114,916 | 119,934 | 29,502 |
| – Gross Shorts: | 55,430 | 173,802 | 35,120 |
| – Long to Short Ratio: | 2.1 to 1 | 0.7 to 1 | 0.8 to 1 |
| NET POSITION TREND: | |||
| – COT Index Score (3 Year Range Pct): | 28.9 | 63.4 | 73.4 |
| – COT Index Reading (3 Year Range): | Bearish | Bullish | Bullish |
| NET POSITION MOVEMENT INDEX: | |||
| – 6-Week Change in Strength Index: | -9.9 | 10.8 | 3.8 |
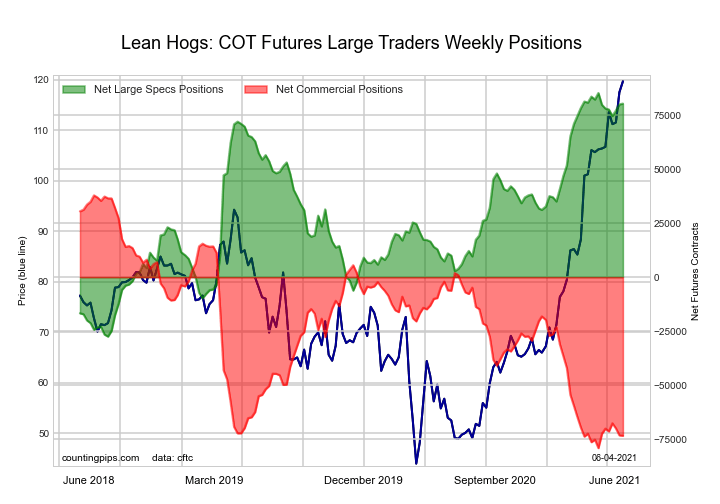
The LEAN HOGS large speculator standing this week equaled a net position of 80,295 contracts in the data reported through Tuesday. This was a weekly boost of 320 contracts from the previous week which had a total of 79,975 net contracts.
This week’s current strength score (the trader positioning range over the past three years, measured from 0 to 100) shows the speculators are currently Bullish-Extreme with a score of 95.6 percent. The commercials are Bearish-Extreme with a score of 4.9 percent and the small traders (not shown in chart) are Bearish with a score of 44.8 percent.
| LEAN HOGS Futures Statistics | SPECULATORS | COMMERCIALS | SMALL TRADERS |
| – Percent of Open Interest Longs: | 40.7 | 29.4 | 9.1 |
| – Percent of Open Interest Shorts: | 13.7 | 54.1 | 11.4 |
| – Net Position: | 80,295 | -73,356 | -6,939 |
| – Gross Longs: | 120,882 | 87,343 | 27,073 |
| – Gross Shorts: | 40,587 | 160,699 | 34,012 |
| – Long to Short Ratio: | 3.0 to 1 | 0.5 to 1 | 0.8 to 1 |
| NET POSITION TREND: | |||
| – COT Index Score (3 Year Range Pct): | 95.6 | 4.9 | 44.8 |
| – COT Index Reading (3 Year Range): | Bullish-Extreme | Bearish-Extreme | Bearish |
| NET POSITION MOVEMENT INDEX: | |||
| – 6-Week Change in Strength Index: | 0.5 | -0.7 | 1.7 |
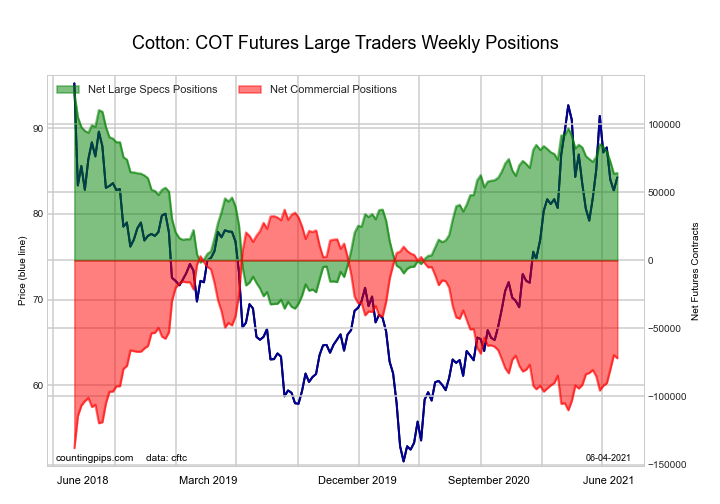
The COTTON large speculator standing this week equaled a net position of 64,206 contracts in the data reported through Tuesday. This was a weekly gain of 553 contracts from the previous week which had a total of 63,653 net contracts.
This week’s current strength score (the trader positioning range over the past three years, measured from 0 to 100) shows the speculators are currently Bullish with a score of 62.9 percent. The commercials are Bearish with a score of 37.7 percent and the small traders (not shown in chart) are Bullish with a score of 57.3 percent.
| COTTON Futures Statistics | SPECULATORS | COMMERCIALS | SMALL TRADERS |
| – Percent of Open Interest Longs: | 34.0 | 45.7 | 6.8 |
| – Percent of Open Interest Shorts: | 6.1 | 76.9 | 3.5 |
| – Net Position: | 64,206 | -71,859 | 7,653 |
| – Gross Longs: | 78,220 | 105,169 | 15,657 |
| – Gross Shorts: | 14,014 | 177,028 | 8,004 |
| – Long to Short Ratio: | 5.6 to 1 | 0.6 to 1 | 2.0 to 1 |
| NET POSITION TREND: | |||
| – COT Index Score (3 Year Range Pct): | 62.9 | 37.7 | 57.3 |
| – COT Index Reading (3 Year Range): | Bullish | Bearish | Bullish |
| NET POSITION MOVEMENT INDEX: | |||
| – 6-Week Change in Strength Index: | -7.6 | 7.6 | -8.2 |
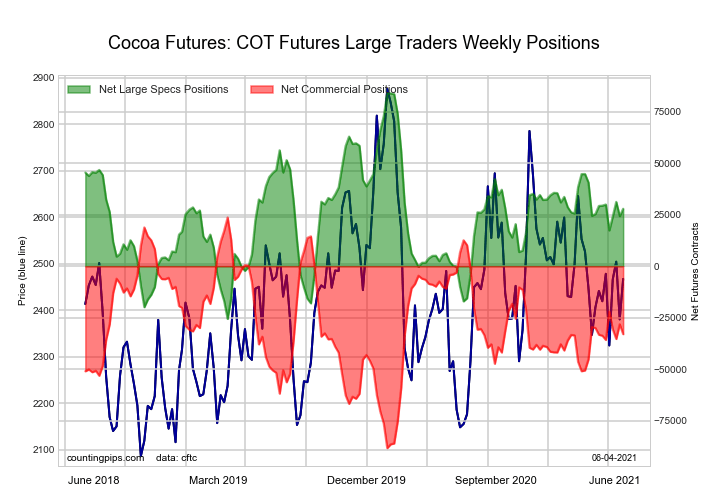
The COCOA large speculator standing this week equaled a net position of 27,878 contracts in the data reported through Tuesday. This was a weekly rise of 3,575 contracts from the previous week which had a total of 24,303 net contracts.
This week’s current strength score (the trader positioning range over the past three years, measured from 0 to 100) shows the speculators are currently Bearish with a score of 48.7 percent. The commercials are Bearish with a score of 49.4 percent and the small traders (not shown in chart) are Bullish with a score of 66.5 percent.
| COCOA Futures Statistics | SPECULATORS | COMMERCIALS | SMALL TRADERS |
| – Percent of Open Interest Longs: | 28.5 | 45.3 | 5.6 |
| – Percent of Open Interest Shorts: | 15.2 | 61.1 | 3.2 |
| – Net Position: | 27,878 | -32,982 | 5,104 |
| – Gross Longs: | 59,645 | 94,897 | 11,712 |
| – Gross Shorts: | 31,767 | 127,879 | 6,608 |
| – Long to Short Ratio: | 1.9 to 1 | 0.7 to 1 | 1.8 to 1 |
| NET POSITION TREND: | |||
| – COT Index Score (3 Year Range Pct): | 48.7 | 49.4 | 66.5 |
| – COT Index Reading (3 Year Range): | Bearish | Bearish | Bullish |
| NET POSITION MOVEMENT INDEX: | |||
| – 6-Week Change in Strength Index: | -1.4 | 0.6 | 9.4 |
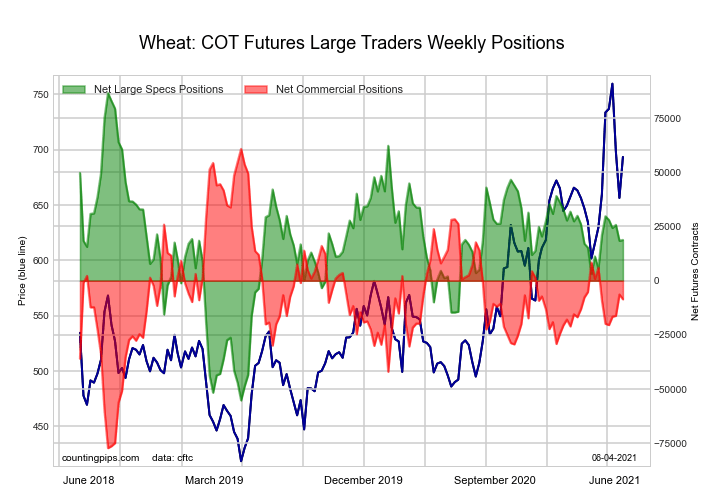
The WHEAT large speculator standing this week equaled a net position of 18,795 contracts in the data reported through Tuesday. This was a weekly advance of 384 contracts from the previous week which had a total of 18,411 net contracts.
This week’s current strength score (the trader positioning range over the past three years, measured from 0 to 100) shows the speculators are currently Bullish with a score of 52.2 percent. The commercials are Bearish with a score of 49.7 percent and the small traders (not shown in chart) are Bullish with a score of 52.7 percent.
| WHEAT Futures Statistics | SPECULATORS | COMMERCIALS | SMALL TRADERS |
| – Percent of Open Interest Longs: | 28.5 | 36.7 | 7.0 |
| – Percent of Open Interest Shorts: | 23.8 | 38.8 | 9.6 |
| – Net Position: | 18,795 | -8,556 | -10,239 |
| – Gross Longs: | 113,330 | 145,728 | 27,774 |
| – Gross Shorts: | 94,535 | 154,284 | 38,013 |
| – Long to Short Ratio: | 1.2 to 1 | 0.9 to 1 | 0.7 to 1 |
| NET POSITION TREND: | |||
| – COT Index Score (3 Year Range Pct): | 52.2 | 49.7 | 52.7 |
| – COT Index Reading (3 Year Range): | Bullish | Bearish | Bullish |
| NET POSITION MOVEMENT INDEX: | |||
| – 6-Week Change in Strength Index: | -1.6 | 0.4 | 8.1 |
Article By CountingPips.com – Receive our weekly COT Reports by Email
*COT Report: The COT data, released weekly to the public each Friday, is updated through the most recent Tuesday (data is 3 days old) and shows a quick view of how large speculators or non-commercials (for-profit traders) were positioned in the futures markets.
The CFTC categorizes trader positions according to commercial hedgers (traders who use futures contracts for hedging as part of the business), non-commercials (large traders who speculate to realize trading profits) and nonreportable traders (usually small traders/speculators).
Find CFTC criteria here: (http://www.cftc.gov/MarketReports/CommitmentsofTraders/ExplanatoryNotes/index.htm).
By Analytical Department RoboForex GBP/USD continued to consolidate at 1.3283 on Wednesday. The British pound…
By JustMarkets The US equity indices showed mixed performance on Tuesday. The Dow Jones (US30)…
By Pawan Jain, University of Michigan Flint Finding good financial advice can be stressful –…
Source: Stephen McBride (7/27/26) Stephen McBride of RiskHedge shares his thoughts on the potential for…
By JustMarkets The US equity indices showed mixed performance on Monday ahead of the Federal…
By Analytical Department RoboForex Gold fell to 4,047 USD per ounce on Tuesday, erasing gains…
This website uses cookies.