Technical Outlook: Gold Cracks Under USD Rebound

By Lukman Otunuga, Research Analyst, ForexTime

Our commodity spotlight shines on Gold which is struggling to shake off the nasty hangover from last Friday’s painful selloff.

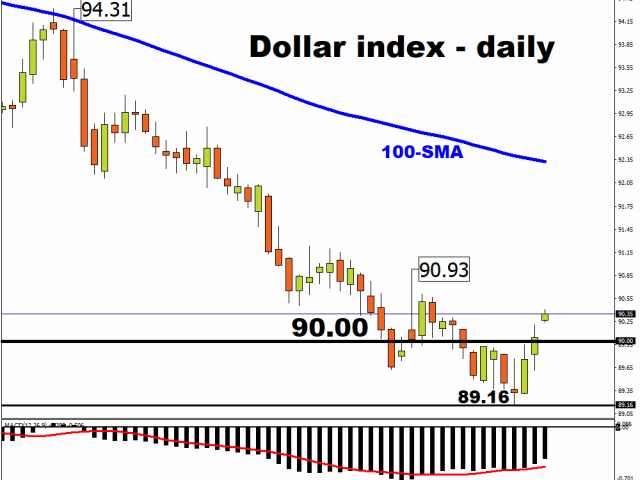
The precious metal has been bruised by an appreciating Dollar while rising U.S. bond yields rubbed salt into the wound.
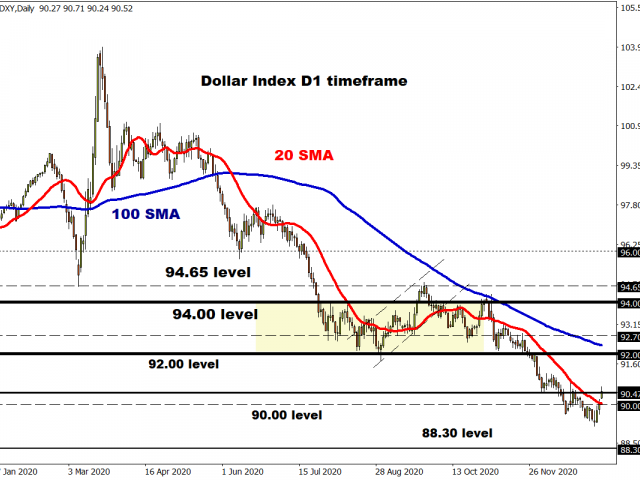
For those who are wondering why this matters, Treasury yields have an inverse correlation with Gold. Given its zero-yielding nature and relationship with the Dollar, the next few days could be rough and rocky for the precious metal.

Since the start of 2021, prices have dropped almost 3% despite the global ‘reflation trade’ receiving a real kicker from the blue wave victory in Georgia’s Senate runoff. However, the battle is far from over for bulls amid the list of fundamental themes supporting appetite for Gold.

Given how Democrats have taken control of the Senate, hopes of further fiscal stimulus have risen. This is fuelling expectations over inflationary pressures making a return in the United States as consumption jumps. With the Dollar’s purchasing power poised to weaken as inflation rises, Gold which is seen as a hedge against inflation is set to benefit. When factoring in how the Federal Reserve is committed to keeping its ultra-accommodative monetary stance in place until at least 2023, the medium to longer-term outlook for the precious metal is bright.

It does not end here. Everything comes at a cost, even the handsome fiscal packages enforced by the government. The federal deficit surged to a record $3.1 trillion in the fiscal year of 2020, according to the Treasury Department. When a fiscal deficit arises, it impacts confidence in the economy and spurs safe-haven demand for Gold.

In our monthly outlook webinar for January, we discussed the possibility of Gold deriving strength from the ‘reflation trade’. Although prices look bearish in the short term with the downside fuelled by an appreciating Dollar, the medium to longer-term outlook remains bullish.

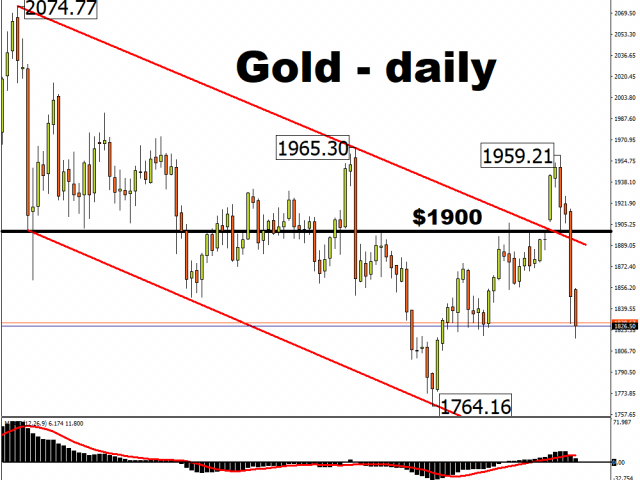
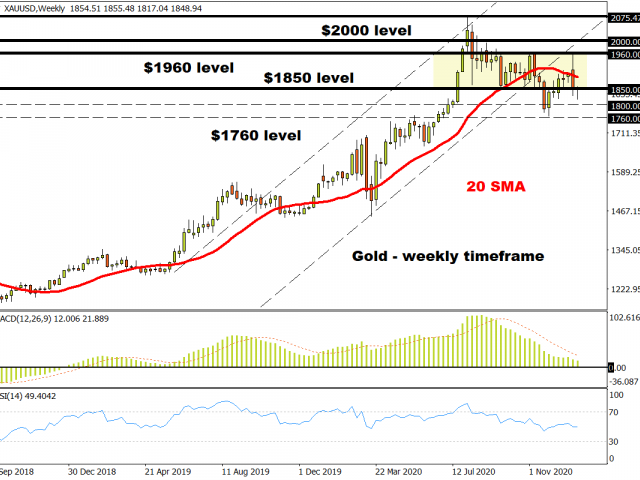
On the weekly timeframe, prices remain a very wide range with tough support around $1760 and resistance around $1960. A strong move back above $1850 could open the doors back towards $1900 while a breakdown below $1800 could signal a decline towards $1760.

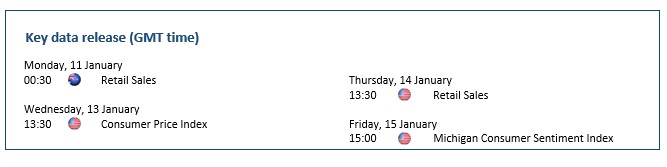
Before dissecting the daily setup, check out the key market events in the week ahead which could influence Gold’s near-term outlook.

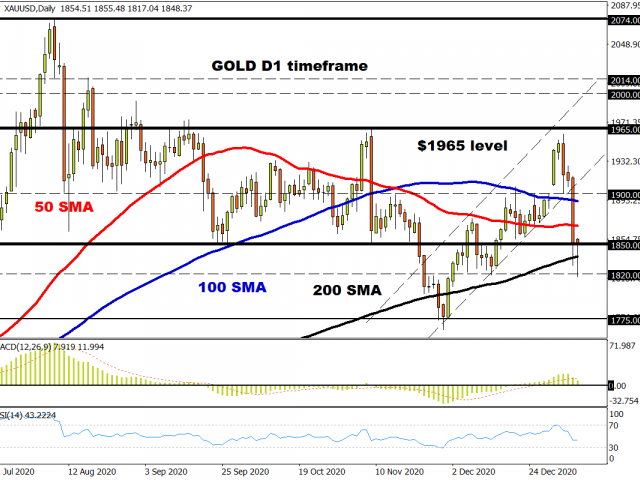
Focusing back on the technials, all eyes will be on how Gold behaves around the $1850 on the daily charts. A close below this level could encourage a decline towards $1820 and $1775. Should $1850 prove to be reliable support, prices may rebound back towards $1900.
Disclaimer: The content in this article comprises personal opinions and should not be construed as containing personal and/or other investment advice and/or an offer of and/or solicitation for any transactions in financial instruments and/or a guarantee and/or prediction of future performance. ForexTime (FXTM), its affiliates, agents, directors, officers or employees do not guarantee the accuracy, validity, timeliness or completeness, of any information or data made available and assume no liability as to any loss arising from any investment based on the same.


Forex-Time-LogoArticle by ForexTime

ForexTime Ltd (FXTM) is an award winning international online forex broker regulated by CySEC 185/12 www.forextime.com

Revisiting Our October 23 Four Stocks To Own Article – Part I

By TheTechnicalTraders 

– Just before the US Elections, we authored an article related to four stocks/sectors that we thought would do well immediately after the November 2, 2020 elections.  The article highlighted how sector rotation in almost any market trend can assist traders in finding solid trading triggers.  We picked four stocks from various sectors for this example:

AALAmerican AirlinesTravel/Leisure
ACBAurora CannabisCannabis
GEGeneral ElectricIndustrial/Specialty Industry
SILJJunior Silver Miners ETFPrecious Metals Miners


When you review my Yahoo! Finance article from October 23 and the November 6 follow up article related to these stock picks, you will quickly see that all of these stocks exhibited similar types of technical patterns.  They were all bottoming in an extended rounded bottom formation and had all started to near a Pennant/Flag Apex in price.  Additionally, many of them, with the exception of SILJ, had set up a very clear RSI technical divergence pattern over the course of setting up the extended bottom in price.

My research team and I selected these stocks because of key expectations related to the post-election mentality of investors related to various sectors.  First, the cannabis sector had a number of new US states approve cannabis legislation – providing for an expected increase in business activity for the entire cannabis sector.  Second, no matter who won the election, another round of stimulus was likely to be approved resulting in increased economic opportunity for companies like GE and AAL.  The Travel and Leisure sector still had its risks as a surge in COVID cases could greatly disrupt future travel expectations.  Junior Silver Miners was our “hedge trade”.  If none of these other stocks started to rally, then Silver Miners would likely move 15% to 20%+ higher over time.

We thought it would be a good time to check in with our picks to share the importance of using sector trends to your advantage.  Currently, there are dozens of sectors that are either in a solid bullish trend or are shifting into new bullish trends.  Being able to catch these setups early and having the confidence to act on these trends is very important. We highlighted some of these setups in our October 23 article, but they happen all the time in various market sectors.

What is important is being able to see the setups, identify the sectors that have the strongest capability for future trends, then determining if you should trade the Sector ETF or some individual stocks within that sector.  Generally, the Sector ETFs provide enough liquidity and opportunity that you don’t need to worry about the individual stocks.  Yet, sometimes, applying the same techniques to the strongest sector stocks can add a very valuable component to your trading.

Below, we have highlighted the accomplishments of each stock symbol over the past 60+ days.  For this example, we will estimate a $20k allocation for ALL TRADES ($5k each) and use a simple 33% target allocation for Target 1, Target 2, and the Trailing Remainder.  That means, we take 33% of the position off at Targets 1 and 2, then let the remaining 33% trail with a protective stop.

SymbolEntry PriceTarget 1 %Target 2 %Last Price %
AAL$12.6039.81%NA22.44%
ACB$4.68124.35%NA114.72%
GE$7.6322.77%NA48.56%
SILJ$14.68NANA10.11%

Our $20k sample account would look something like this right now…

SymbolEntry PriceTarget 1 $Target 2 $Last Price $
AAL$12.60$656.87NA$6,408.61
ACB$4.68$2,068.28NA$10,802.59
GE$7.63$375.71NA$6,995.44
SILJ$14.68NANA$5,505.50
Total =>$29,712.14


Overall, this represents a +48.5% net account profit in just over 60 days by focusing on sector trends and rotations.  In the future, if any of our higher Target levels are reached, we’ll pull another 33% of these trades and lock in these gains while we let the remaining position carry forward with a trailing stop.  The trailing stop should be based on the last completed target level reached.  For example, if Target 1 is reached, then the stop should be placed just below the Entry Price level.  If Target 2 is reached, then the stop should be placed just below the Target 1 level and it should begin to trail higher as new price highs are reached.

Usually, we will pick an exit price level based on some type of trend failure or reversal point.  In most cases, this happens when the longer-term (Weekly based) moving averages change direction and price activity displays a clear technical pattern showing the bullish trend has ended.  Most traders are capable of determining their own exit points using technical indicators and other tools as they wish.

Be sure to sign up for my FREE webinar that will teach you how to find and trade my BEST ASSET NOW strategy on your own!

When some sector is trending very strongly, we don’t want to attempt to second guess the peak level or end of the trend.  We just want to ride that trend for as much profit as we can – unless some other sector sets up a new opportunity where we can better deploy our assets for profits. We like to let the trend work itself to an eventual end and use our Target Levels to lock in gains along the way.

American Airlines Trade

The following Weekly chart of American Airlines (AAL) highlights the simple trade we suggested on October 23, 2020.  As you can see, the upward sloping lows in price aligned with the upward sloping RSI trend (in the lower pane).  AAL has reached our first target level (the MAGENTA line) and has recently settled near $15.13.  Our stop level should be just below our entry price level, near or below $12.60 at this time as we wait to see how the bullish trend continues.

In Part II of this article, we’ll go over the remaining three stock symbols we initially suggested on October 23, 2020 and highlight even more details related to sector trending.

Many years ago I was researching Japanese Candlesticks and the teaching of Seiki Shimizu (The Japanese chart of charts: Shimiz) settled well with my thinking.  In his writing, he suggests that more than 60% of the time traders are waiting for new setups/trades.  This is something that many traders need to fully understand in order to balance aggressive trading tendencies with their abilities to create profits and protect assets.

If this theory is correct, then trades only need to focus on the 30% to 40% of any 12-month span of time  (three to four months) where the bigger sector trends/trades setup and initiate.  Otherwise, these trends may continue, in some form, over the remainder of the time to generate profits (or not).  This type of thinking suggests that traders only need to focus on the best immediate setups in any market trends/sectors and ignore the “froth” in the markets on a day-to-day basis.  Doing so will allow most traders the freedom to create profits by taking skilled and effective entry triggers while being able to enjoy life, family, and other hobbies.

Trading does not need to be a full-time, 24/7 effort.  The global markets generate big sweeping sector trends sometimes 2 to 4 times a year as capital moves in and out of various trend cycles (short, intermediate, and long term).  All we have to do is find the best sectors to trade, then wait for the trigger/entry setup. Now, imagine what it would be like if you could accomplish something like this every week or month with technology? You can with my BAN Trader Pro strategy and Hotlist.

BAN Trader Pro can help you identify and trade the Best Asset Now.  The BAN Hotlist helps us identify the strongest and best trade setups in any market sector.  Every day, we deliver these setups to our subscribers along with the BAN Trader Pro system trades.  You owe it to yourself to see how simple it is to profit from sector rotation with my strategy. You can sign up here for my 100% educational webinar for free.

Have a great week!

Chris Vermeulen
Chief Market Strategist
www.TheTechnicalTraders.com

Weekly Fundamental Bulletin: ECB Minutes & US Retail Sales

By Orbex

Last week’s highlights

US manufacturing rises

Manufacturing activity in the United States rose to a two and half year high in December.

Official data from the ISM institute showed that the manufacturing gauge rose to 60.7 during the month. It comes on top of November’s increase to 57.5, making the December data the highest since August 2018.

The increase came on a rebound on supplier deliveries which rose from 61.7 in November to 67.6 in December. New orders sub-index rose to 67.9 in December, up from 65.1 previously.

German factory orders rebound in November

Factory orders from Germany posted an unexpected rebound in November.

Demand rose by 2.3% in November compared to estimates of a 0.5% decline. The factory orders were more than 6% above the pre-crisis level, according to official data.

The increase marks a 7th consecutive increase in factory orders. The data comes as Germany extended its lockdown restrictions through the end of January.

Investors brush aside FOMC meeting minutes

The US Federal Reserve released its meeting minutes from the December monetary policy meeting.

There was nothing new for the markets which broadly dismissed the minutes. However, the minutes showed that the new forward guidance was qualitative, which undermines the current scenario of chasing the inflation target and unemployment rate.

The minutes also showed that policymakers discussed the tapering process. But, given the 2013 – 2014 taper tantrum, no further details were discussed at the meeting.

The minutes underlined the fact that the Fed is likely to maintain the status quo.

Payrolls post the first decline since April 2020

The monthly US nonfarm payrolls report released on Friday saw the labor market losing jobs for the first time in 8 months.

The data reflects the drop in hiring in the hospitality sector amid renewed restrictions.

Nonfarm payrolls fell by 140,000 from the previous month, according to official data. The unemployment rate, however, bucked the trend, holding steady at 6.7%.

The unchanged unemployment rate puts an end to 7 consecutive monthly declines.

Despite the lower than forecast jobs data, the markets continued to be spurred on by hopes of new stimulus under the Biden administration.

US services sector activity unexpectedly rises in December 2020

The US services sector activity posted a surprise increase in December, marking a faster pace of expansion.

Official data from the Institute for Supply Management showed that the services PMI rose to 57.2 in December. This comes following a headline print of 55.9 in the previous month.

The median forecasts pointed to a decline in the index to 54.6. The services sector composite index grew for the seventh consecutive month following a decline in April and May.

The gains in the services sector come following an uptick in the increase in the business activity index which rose to 59.4 in December from 58.0 in November.

Upcoming Economic Events

China exports set to rise, albeit at a slower pace

The week ahead will kick off with data from China covering exports and inflation.

On the exports front, data is likely to show that the recovery continued into the year-end. Another double-digit growth is forecast in exports.

Following an increase of 21.1% previously, export data for December is set to rise by 13%. Meanwhile, inflation is also likely to improve.

After falling 0.5% on the year in November 2020, headline consumer prices are forecast to decline by just 0.1%, marking a modest improvement from the previous month.

Similar trends are expected in the producer prices index as well. PPI is forecast to fall by 0.8% following a 1.5% decline on the year in November.

ECB to release the December monetary policy meeting

The European Central Bank will be releasing its meeting minutes from the December monetary policy meeting.

The central bank announced an increase in its bond purchases in December. However, investors will be keen to see the deliberations.

It is already well known that the ECB included a caveat that not all of its targeted 500 billion euros would be used for purchasing bonds.

Instead, the ECB was forced to note that it may not use the entire amount in a bid to secure the backing of the hawks in the ECB governing council.

The December meeting already showed ample disagreements among members, which could be highlighted in the meeting minutes.

US retail sales likely fell in December 2020

The monthly retail sales report is due out this week on Friday.

According to the median estimates, it is quite likely that retail sales fell during the month. This marks a 3rd consecutive decline in retail sales.

The declines are attributed to the surge in the Covid-19 cases amid renewed restrictions. Headline retail sales are forecast to fall by 0.1% following a 1.1% decline previously.

Economists expect the retail sales excluding auto and gas to fall by 0.4% after a 0.8% decline in the previous month.

Consumer prices in the US set to rise in December 2020

Consumer price index data from the United States is due out this week.

Forecasts show that headline inflation rose by 1.3% on the year in December. This marks a slight increase from 1.2% previously.

On the other hand, economists forecast that core CPI prices, which exclude food and energy, will remain steady at 1.6%. This will see the same pace of increase in core CPI as in November on an annual basis.

UK monthly GDP to contract in November

Economic activity in the UK is heading for another contraction in November.

The declines come after a fragile recovery in the previous month. The median estimates point to a 4.6% decline on a monthly basis for November.

The drop comes after a 0.4% increase in the previous month. It also coincides with the UK entering into a partial lockdown.

Looking ahead, the nation entered into a stricter lockdown since January. This is will result in a deeper impact on the economy in the coming months.

Due to the anticipated contraction in economic growth, the fourth-quarter GDP could also come out lower.

By Orbex

Fibonacci Retracements Analysis 11.01.2021 (GOLD, USDCHF)

Article By RoboForex.com

XAUUSD, “Gold vs US Dollar”

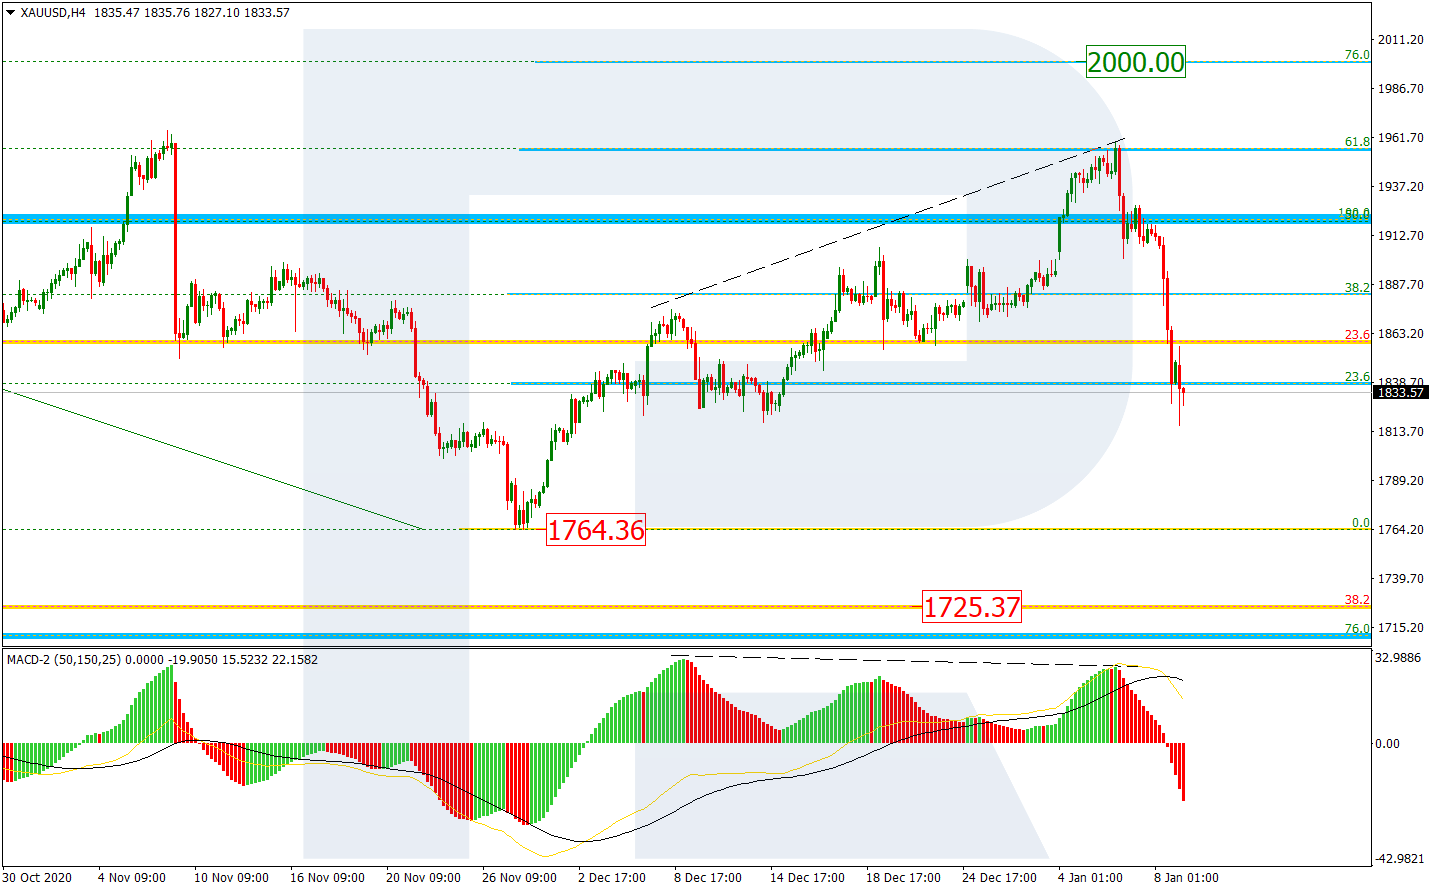
As we can see in the H4 chart, a divergence on MACD made the pair stop the correction at 61.8% fibo and start a new decline, which is heading towards the previous low at 1764.36. If the price breaks the low, the instrument may continue its long-term downtrend to 38.2% at 1725.37.

GOLD_H4
Risk Warning: the result of previous trading operations do not guarantee the same results in the future

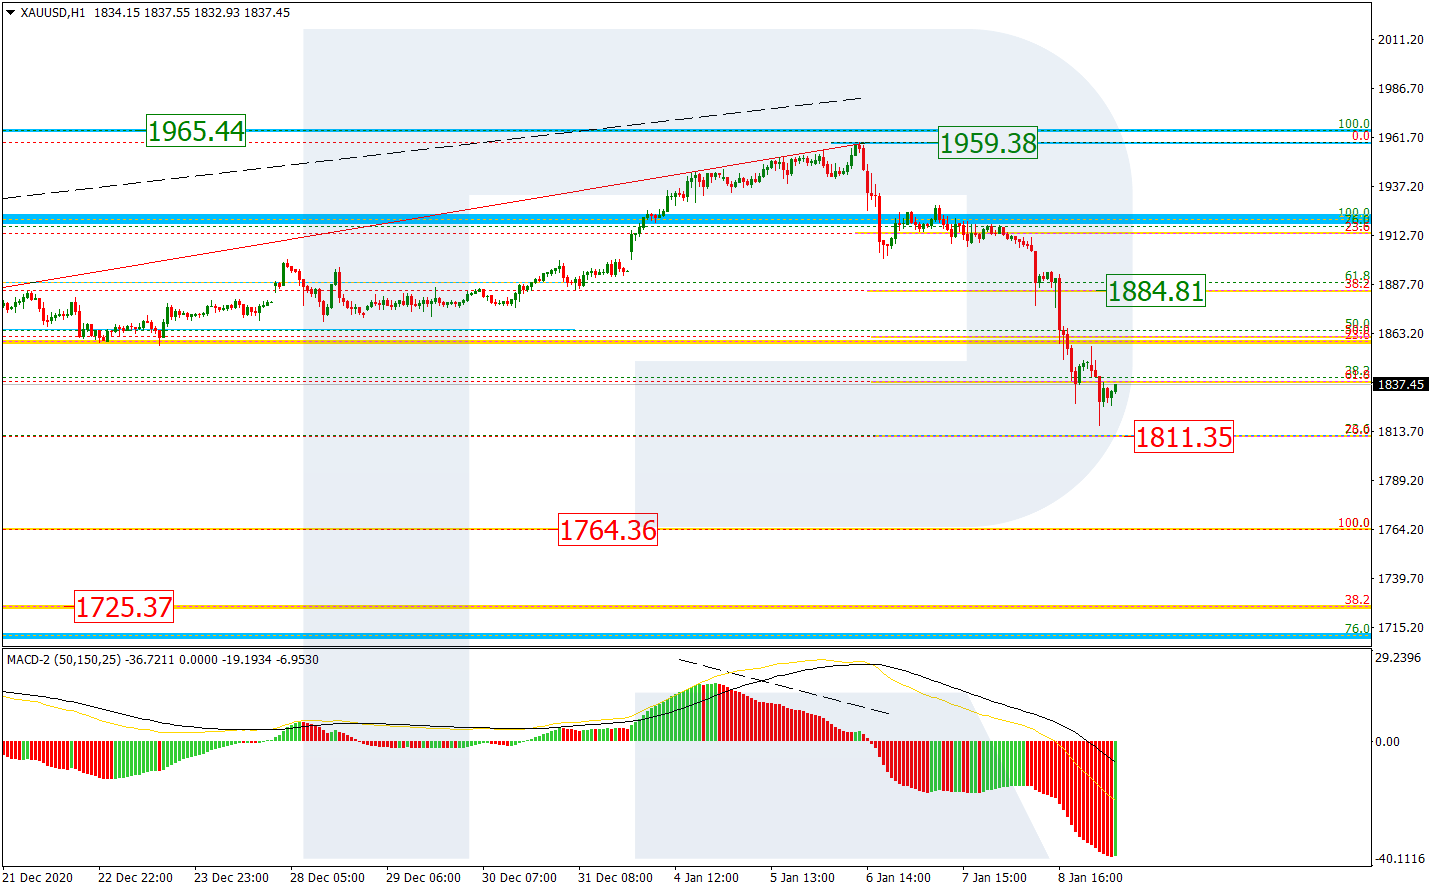
The H1 chart shows that the descending wave has almost reached 76.0% fibo at 1811.35. In the nearest future, the pair may correct towards the local resistance at 38.2% fibo (1884.81). however, if this correction transforms into a proper rising wave, the asset may break the high at 1959.38 and then continue growing towards 2000.00.

GOLD_H1
Risk Warning: the result of previous trading operations do not guarantee the same results in the future

USDCHF, “US Dollar vs Swiss Franc”

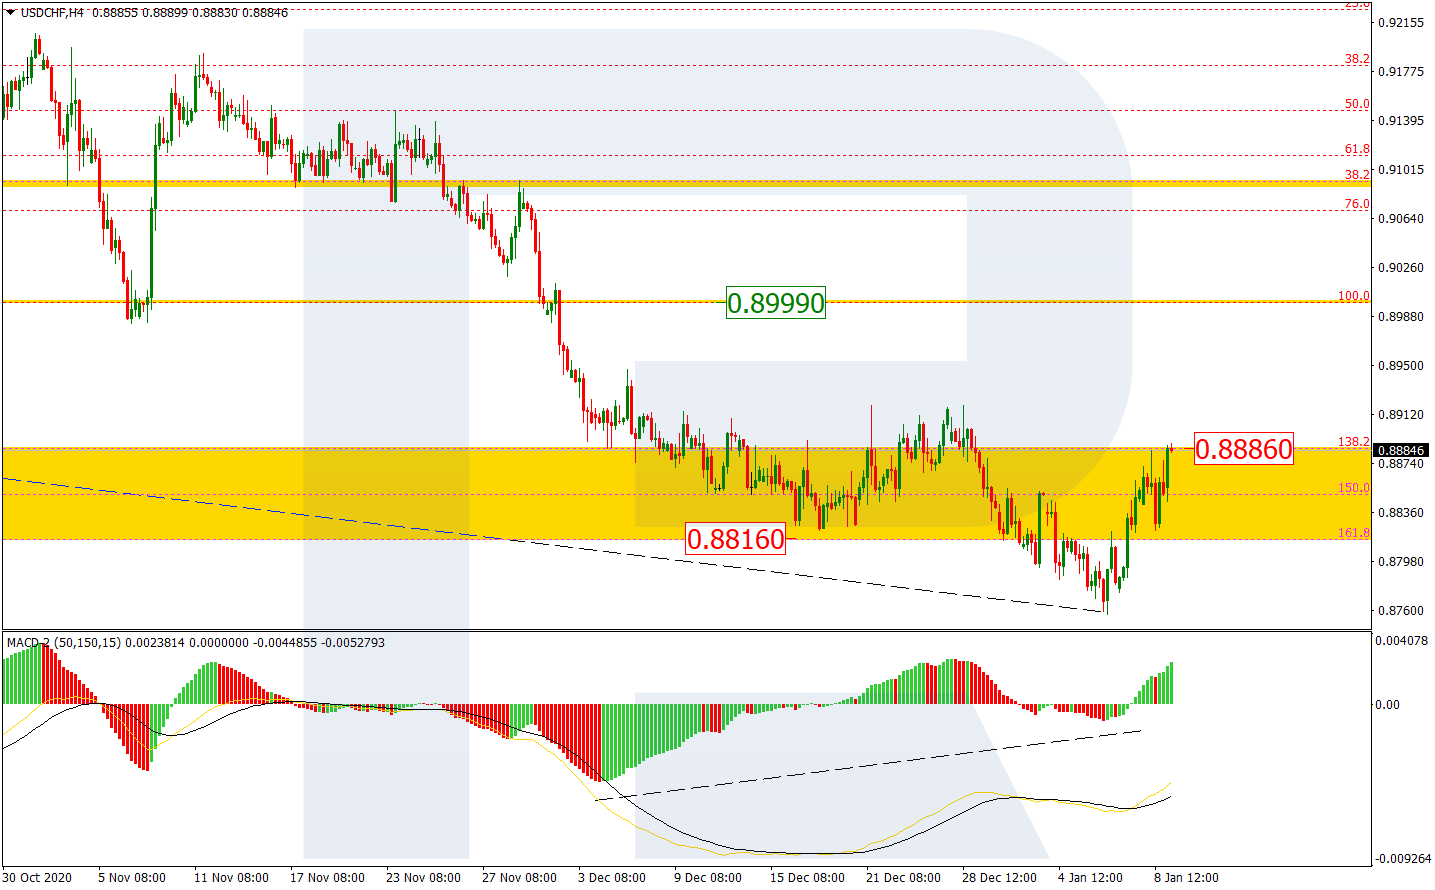
As we can see in the H4 chart, after updating the low and the convergence on MACD, USDCHF has returned inside the post-correctional extension area between 138.2% and 161.8% fibo at 0.8886 and 0.8816 respectively. At the moment, the pair is correcting to the upside and this movement may be considered as the start of a new mid-term pullback. The key correctional target is the resistance at 0.8999.

USDCHF_H4
Risk Warning: the result of previous trading operations do not guarantee the same results in the future

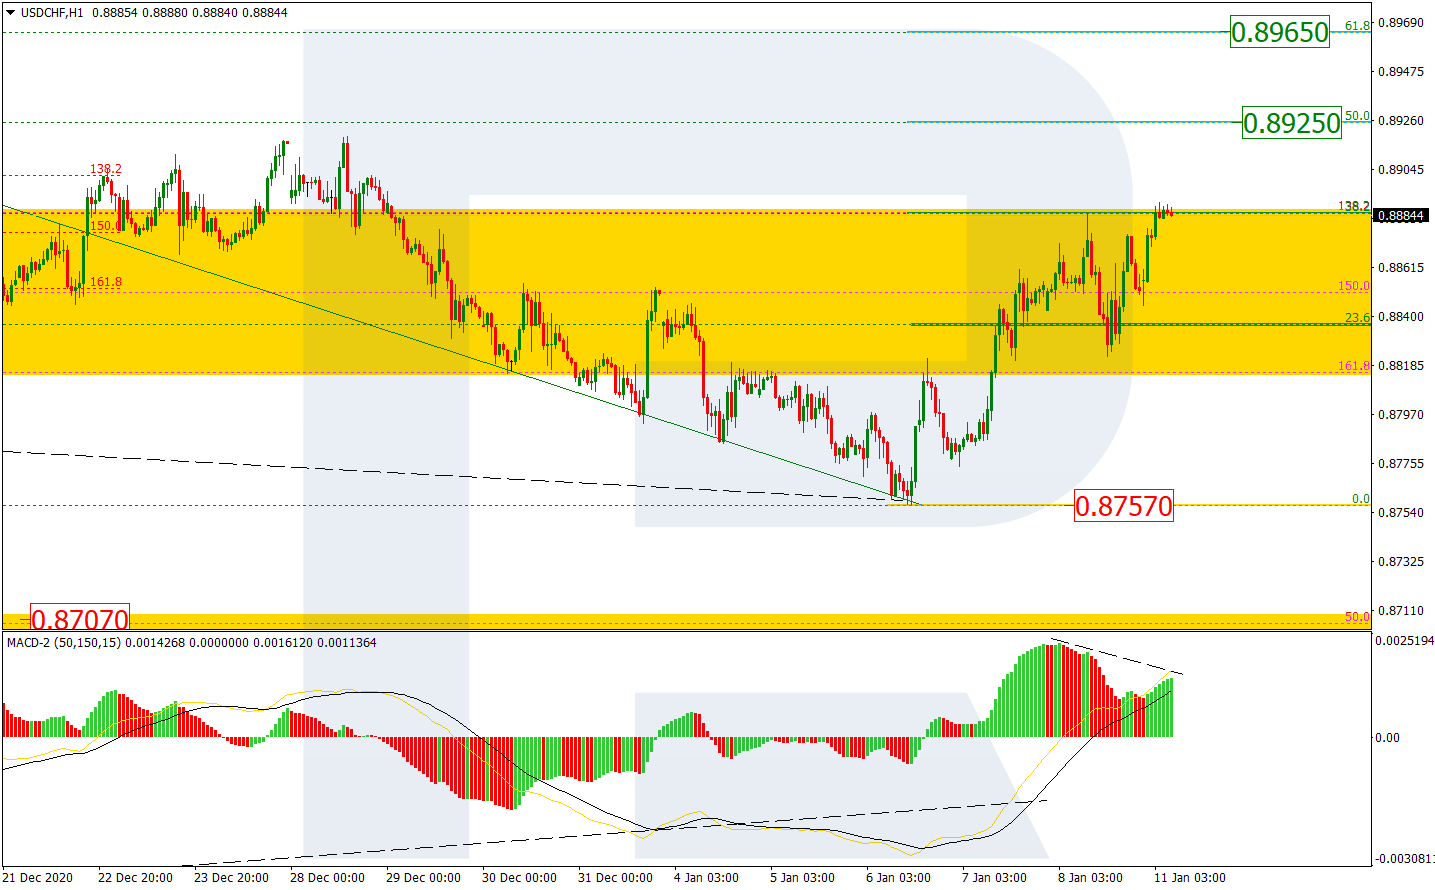
The H1 chart shows a more detailed structure of the correction after the convergence on MACD. The asset has reached 38.2% fibo and, after breaking it, may continue moving towards 50.0% and 61.8% fibo at 0.8925 and 0.8965 respectively. A breakout of the support at 0.8757 will complete this correction and resume the downtrend.

USDCHF_H1

Article By RoboForex.com

Attention!
Forecasts presented in this section only reflect the author’s private opinion and should not be considered as guidance for trading. RoboForex LP bears no responsibility for trading results based on trading recommendations described in these analytical reviews.

The Week Ahead: Any Color But Green

By Orbex

USDCHF Slides After Weak Jobs Data

A new presidential era might not be enough to turn the tide in favor of the US dollar. Actually, state-backed asset inflation has become business as usual. It would be economically and politically unwise to turn off the tap.

Now with Dems in control of the White House, Senate, and House of Representatives, Mr. Biden has a clear path to implement his stimulus agenda. As the labor market has shown signs of weakness, the greenback may remain under pressure for an extended period of time.

Bears are driving the price towards the next target of 0.8700. A rebound could turn out to be temporary and challenged by 0.9000.

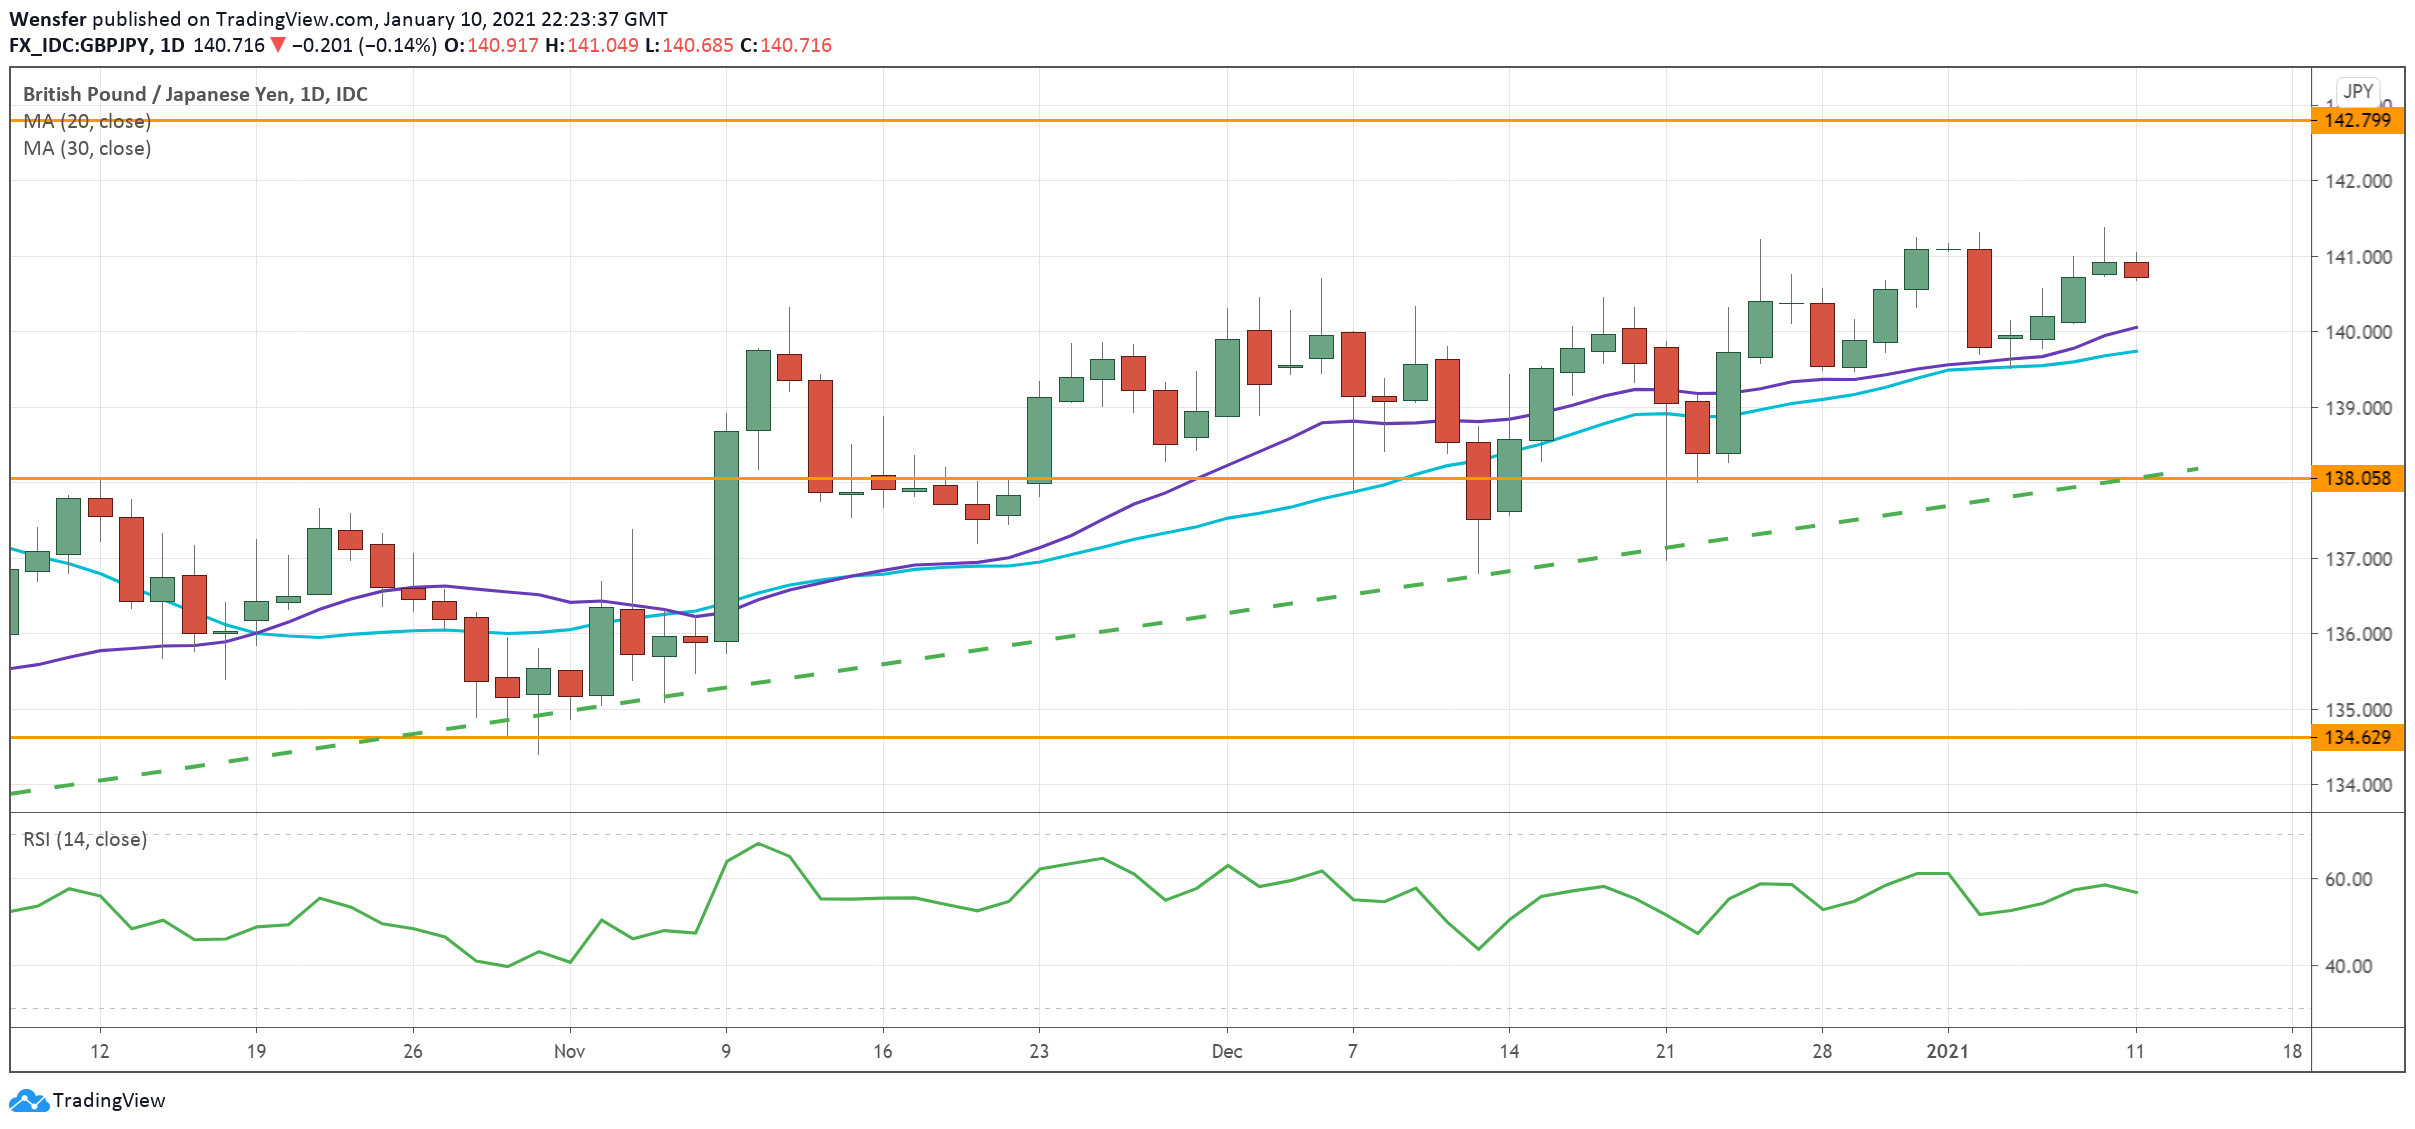
GBPJPY Faces Negative Rates Pressure

The pound has been grinding up against the Japanese yen but without much conviction. The UK’s half victory over the Brexit deal has left the market hesitant to commit. Traders now have their attention on the Bank of England.

The central bank may soon intervene aggressively, to mitigate the impact from the third lockdown and Brexit disruption. The pricing of negative rates in the first half of the year could be strong headwinds for the Sterling.

The pair is inching up towards the September high of 142.80. Stiff selling pressure ahead could drive the price back to test the trendline around 138.10.

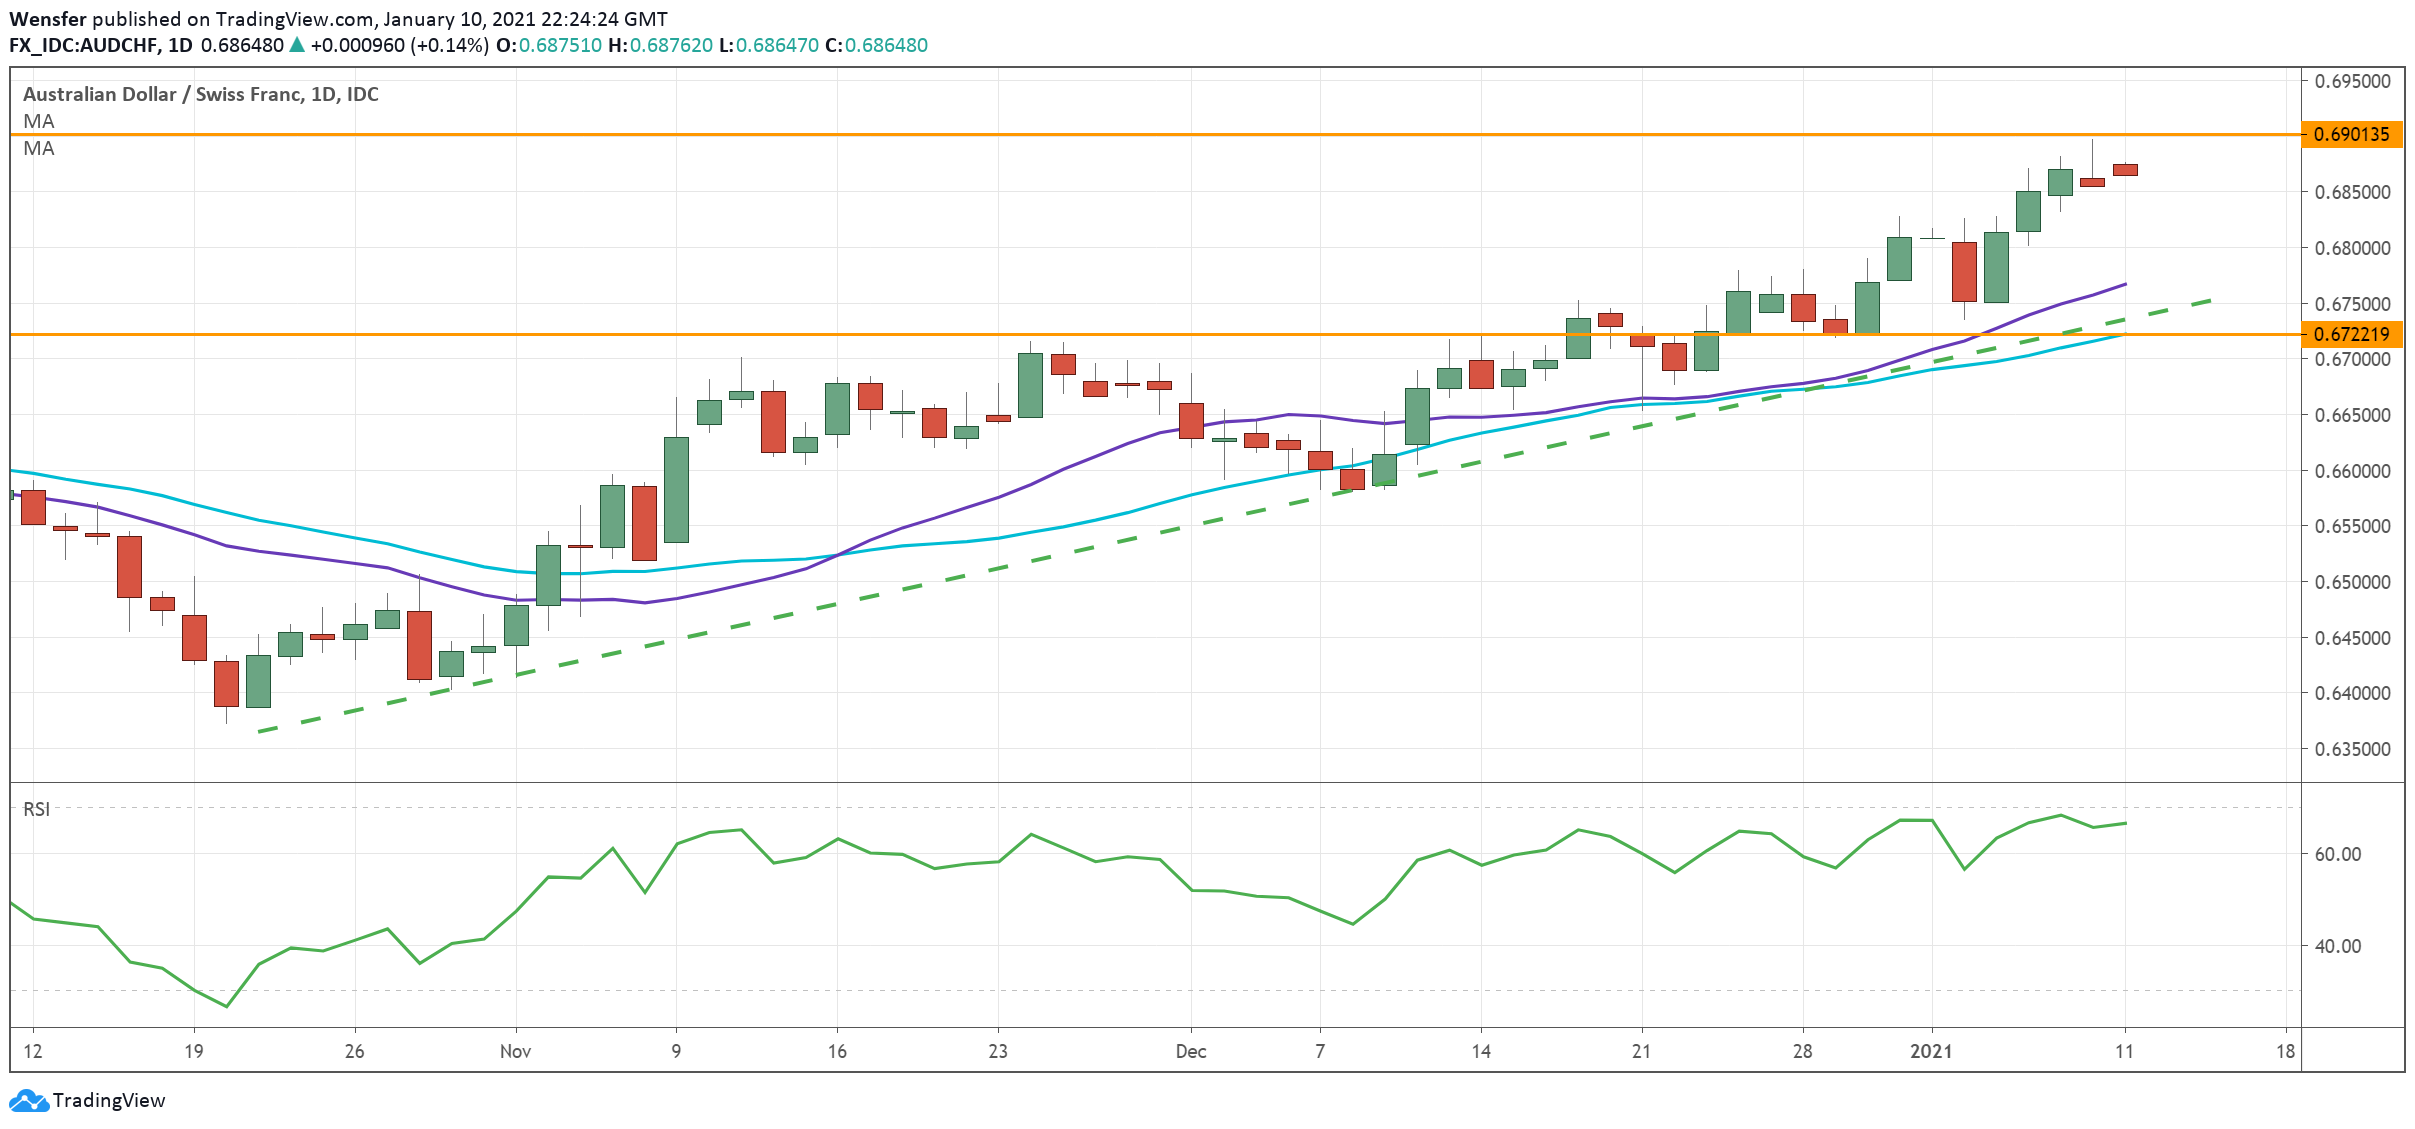
AUDCHF Extends Rally Above 12-Month High

Risk sentiment heightened a notch following the blue sweep across the US Senate. Markets are pricing in future growth from the prospect of even larger and sustained stimulus spending.

Resilience in trade surplus and the domestic housing market has helped the Aussie stand firm against pullbacks.

On the technical side, after emerging above 0.67, the top of a 6-month long consolidation range, the Australian dollar is likely to continue on its ascent. A bullish break above last November’s high of 0.6900 could extend the rally to 0.7. On the downside, a retracement is likely to meet buyers around the trendline (0.6720).

EURCAD Nears End of Consolidation

While risk currencies are now mostly under the spotlight, the euro has been inching up steadily. General weakness in the US dollar and its Canadian counterpart have benefited the single currency.

Investors have shrugged off the fact that major European countries went into another lockdown, but put faith in unwavering support from governments and the ECB instead.

There are plenty of support levels on the chart along the 11-month long rally, which would give buyers enough confidence.

1.5400 is the closest one as the price approaches the end of a flag-shaped consolidation. On the upside, 1.5780 is the immediate resistance.

By Orbex

Forex Technical Analysis & Forecast 11.01.2021

Article By RoboForex.com

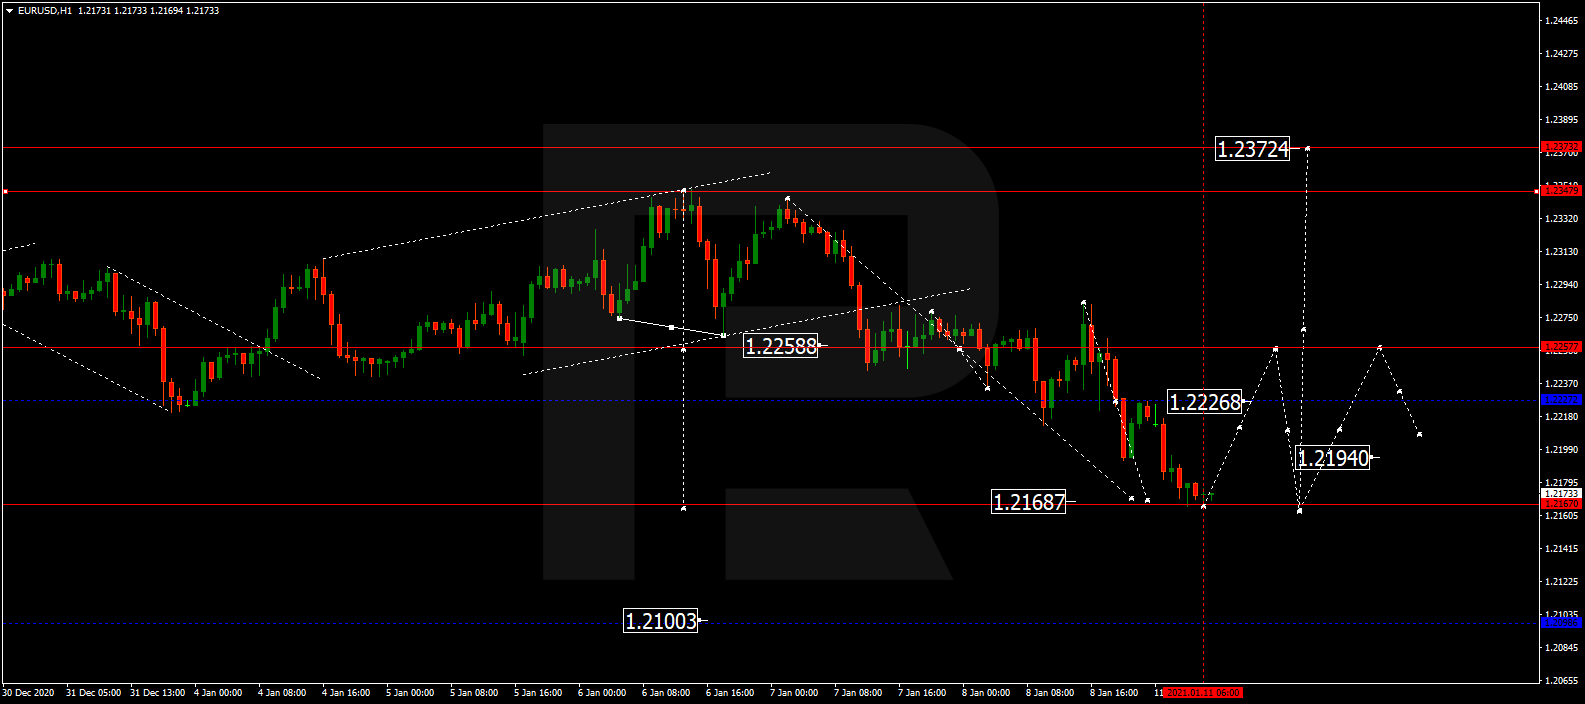
EURUSD, “Euro vs US Dollar”

After reaching the short-term downside target at 1.2170, EURUSD is expected to start another growth to test 1.2245 from below. After that, the instrument may resume trading downwards with the first target at 1.2160 and then start a new correction in the form of a Flag pattern to reach 1.2260.

EURUSD
Risk Warning: the result of previous trading operations do not guarantee the same results in the future

GBPUSD, “Great Britain Pound vs US Dollar”

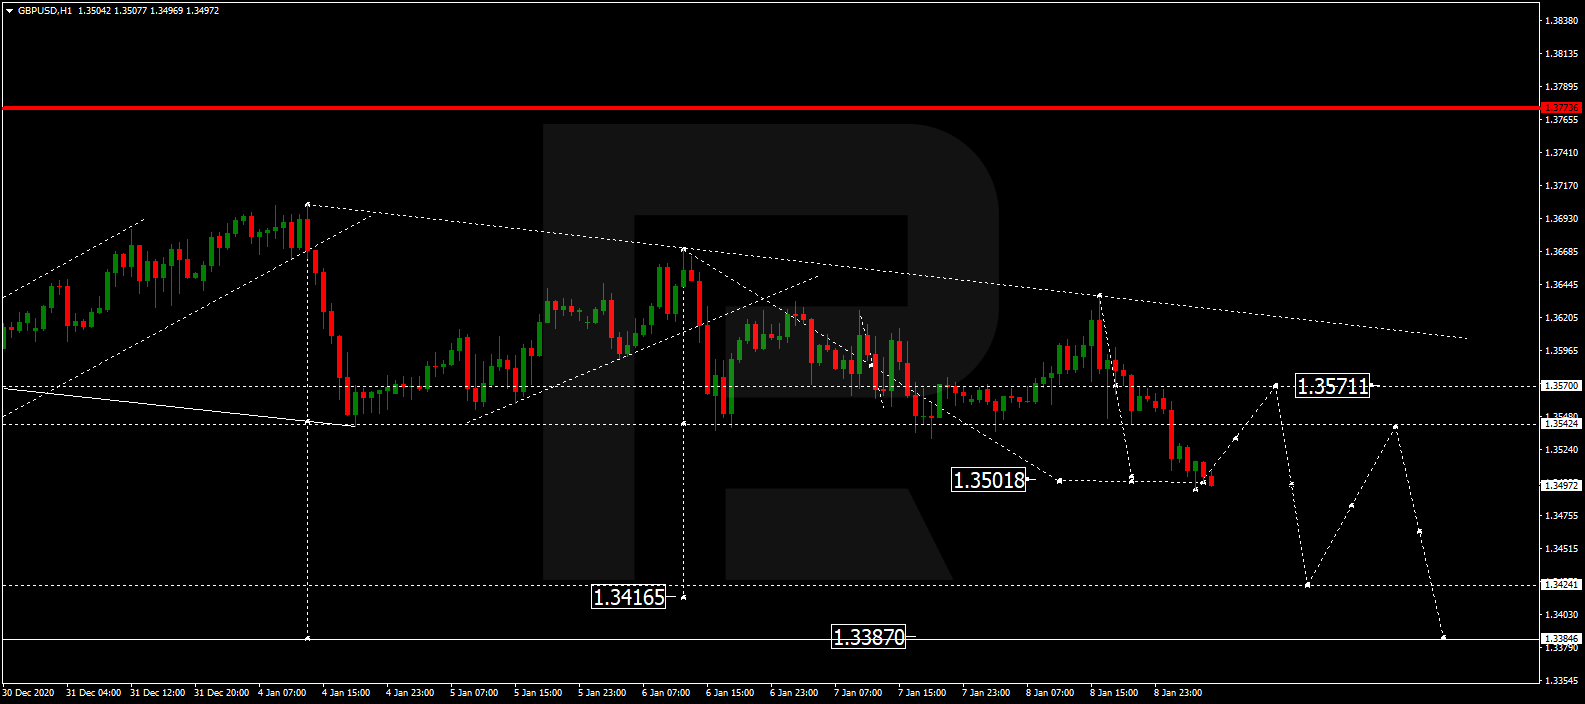
After completing another descending wave at 1.3500, GBPUSD is expected to grow towards 1.3571. Later, the market may form a new descending structure with the first target at 1.3390.

GBPUSD
Risk Warning: the result of previous trading operations do not guarantee the same results in the future

USDRUB, “US Dollar vs Russian Ruble”

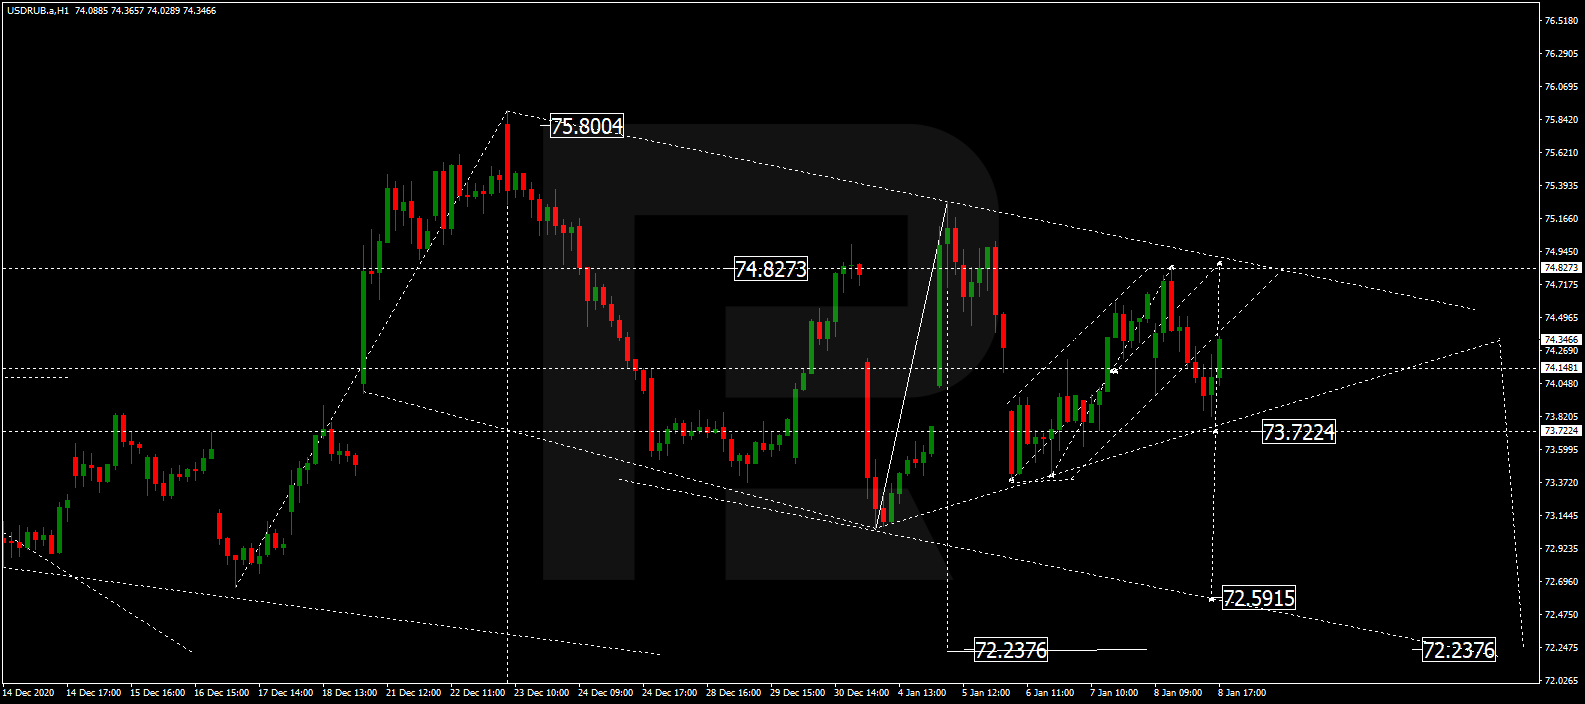
USDRUB is consolidating around 74.14. Possibly, the pair may form one more ascending structure to reach 74.80 and then resume trading downwards to break 73.73. After that, the instrument may continue falling with the short-term target at 72.60.

USDRUB
Risk Warning: the result of previous trading operations do not guarantee the same results in the future

USDJPY, “US Dollar vs Japanese Yen”

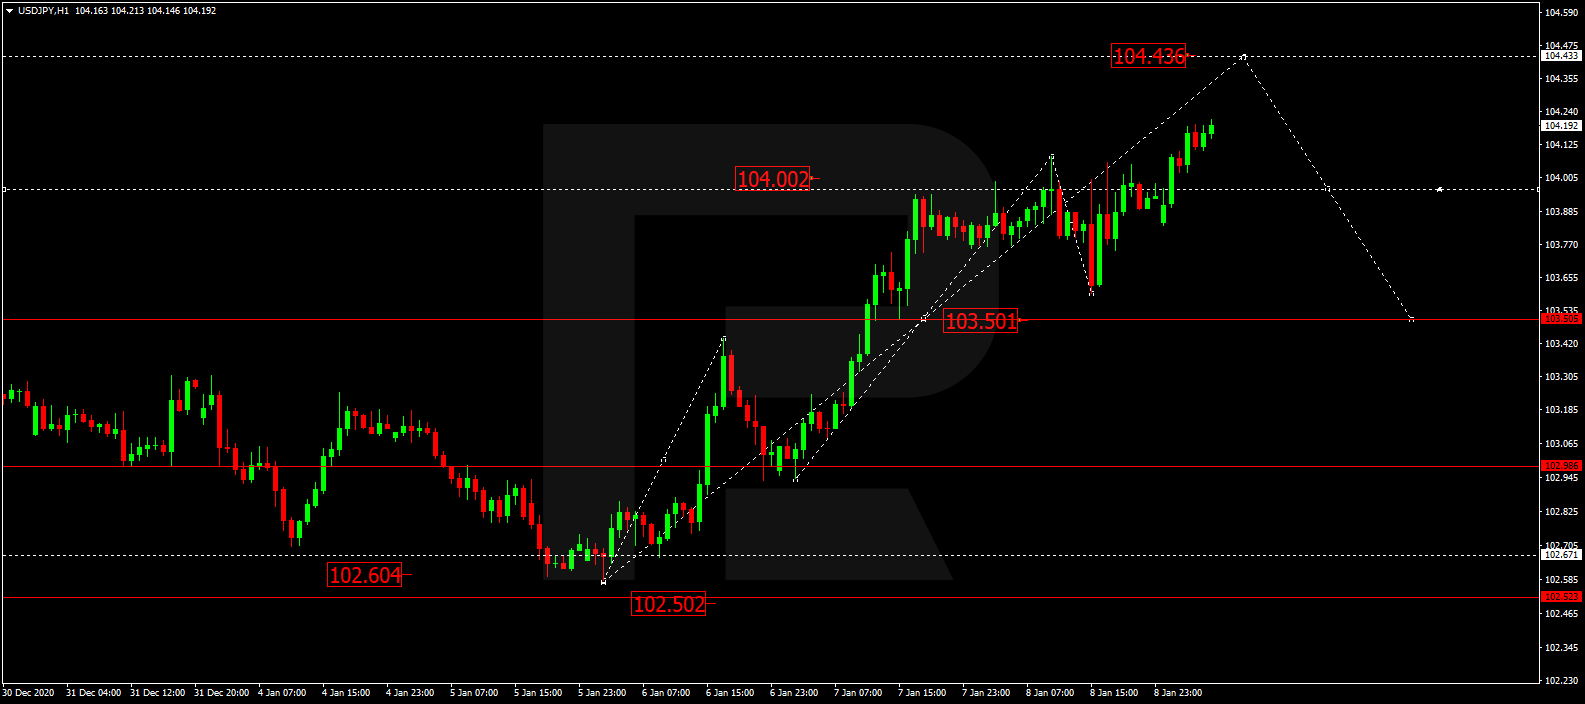
After breaking 103.60 to the upside, USDJPY is expected to form one more ascending structure towards 104.44. Later, the market may start a new correction with the target at 103.50.

USDJPY
Risk Warning: the result of previous trading operations do not guarantee the same results in the future

USDCHF, “US Dollar vs Swiss Franc”

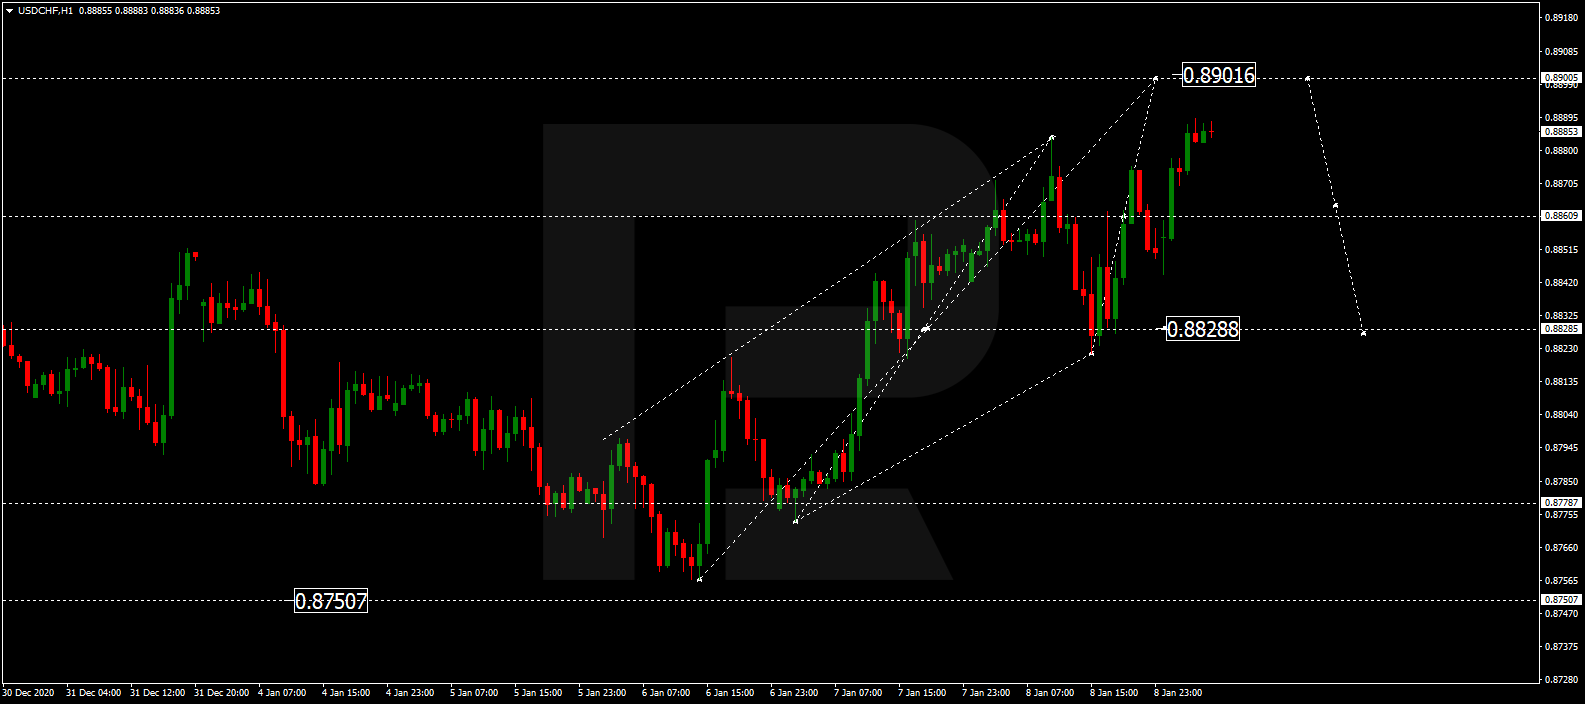
After rebounding from 0.8828, USDCHF is growing towards 0.8900 and may later start another correction with the target at 0.8828.

USDCHF
Risk Warning: the result of previous trading operations do not guarantee the same results in the future

AUDUSD, “Australian Dollar vs US Dollar”

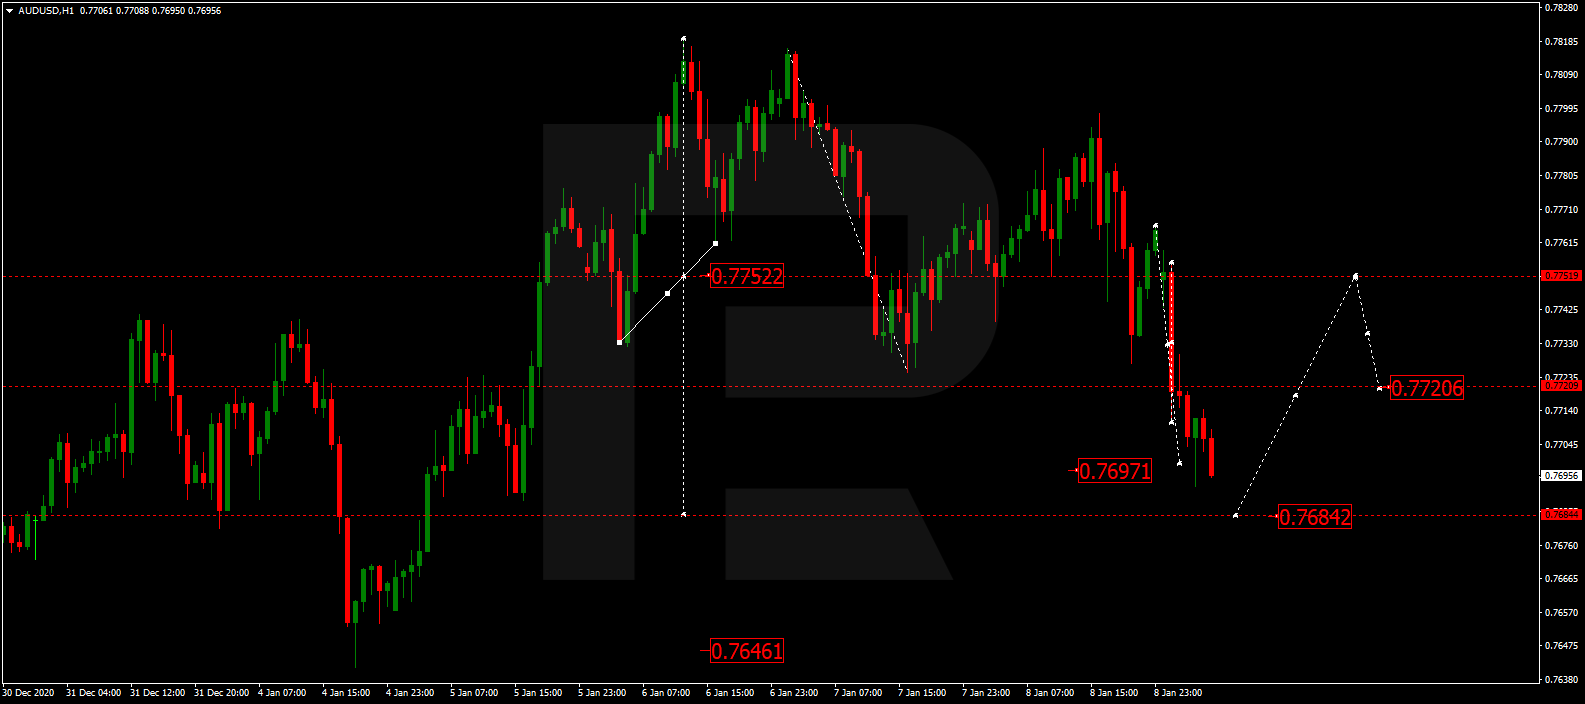
After breaking 0.7750 to the downside and then reaching 0.7700, AUDUSD is expected to form a new correctional structure to return to 0.7750 and test it from below. 0.7707. Later, the market may start another decline to complete this descending wave at 0.7680 and then resume growing with the target at 0.7766.

AUDUSD
Risk Warning: the result of previous trading operations do not guarantee the same results in the future

BRENT

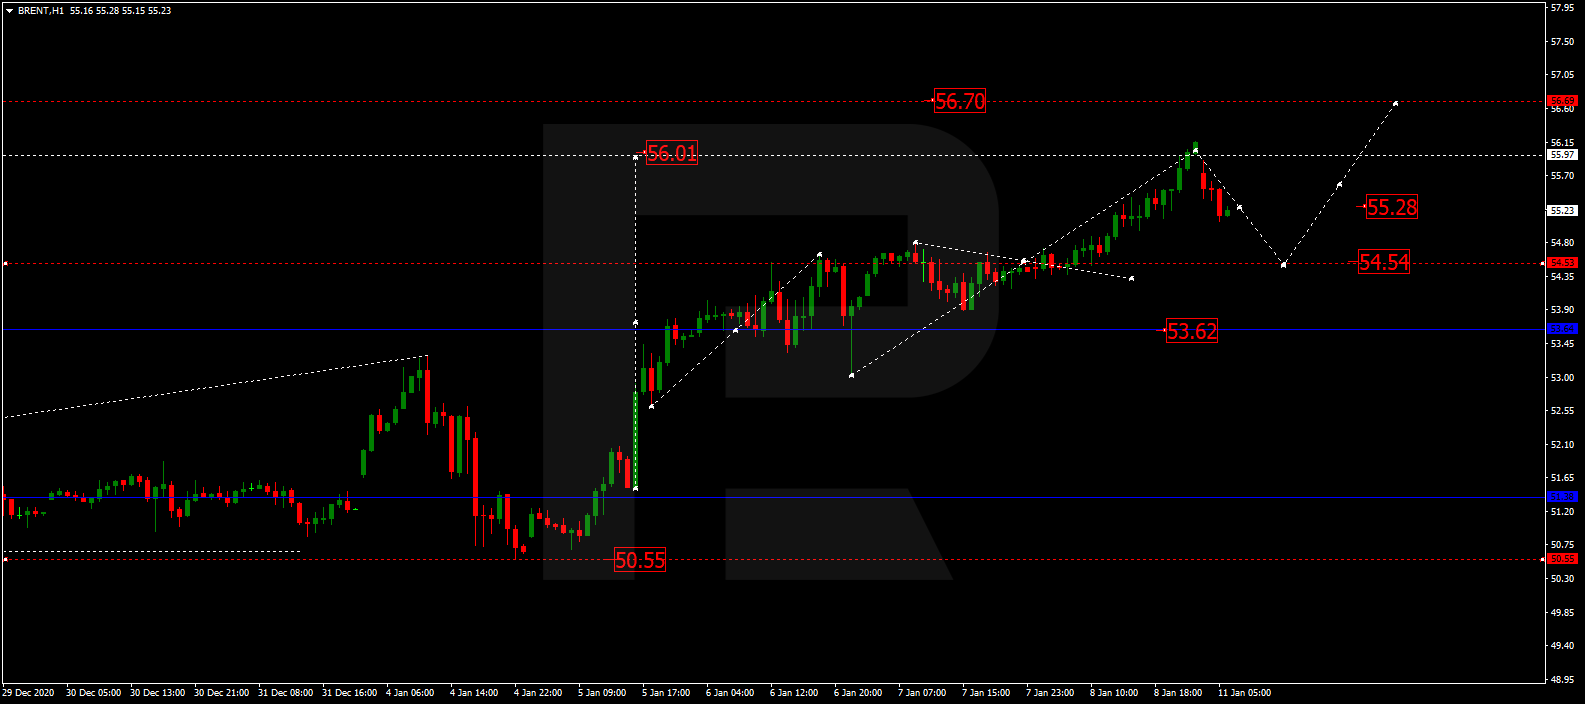
After completing the ascending impulse at 56.00, Brent is consolidating below this level. If later the price breaks this range to the downside, the market may correct towards 54.54; if to the upside – expand the range up to 56.70 and then start a new correction with the target at 51.40.

BRENT
Risk Warning: the result of previous trading operations do not guarantee the same results in the future

XAUUSD, “Gold vs US Dollar”

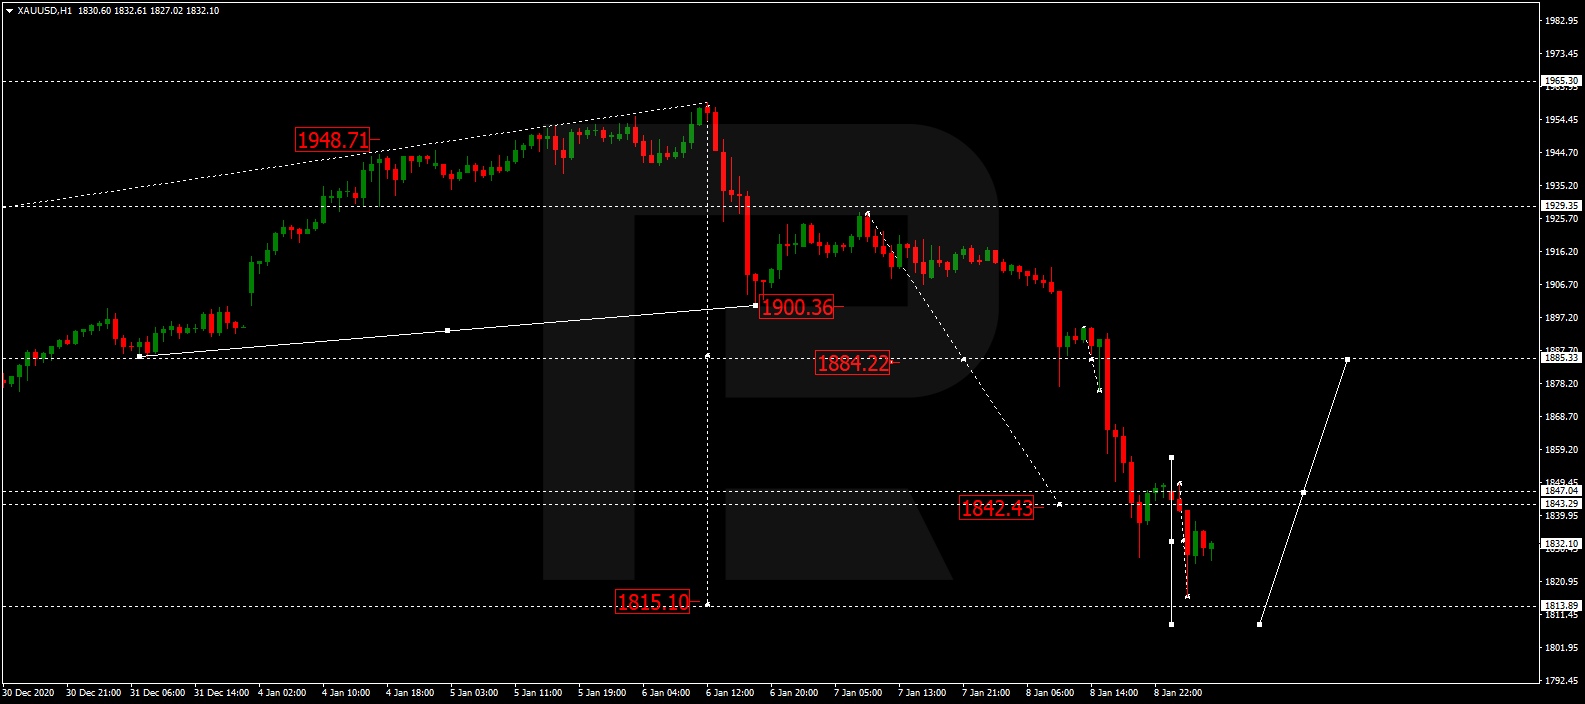
Gold has finished the descending wave at 1842.40. Possibly, today the metal may consolidate around this level. If later the price breaks this range to the downside, the market may form a new descending structure with the first target at 1815.10; if to the upside – start another growth to reach 1885.15 and then resume falling towards the above-mentioned target.

GOLD
Risk Warning: the result of previous trading operations do not guarantee the same results in the future

BTCUSD, “Bitcoin vs US Dollar”

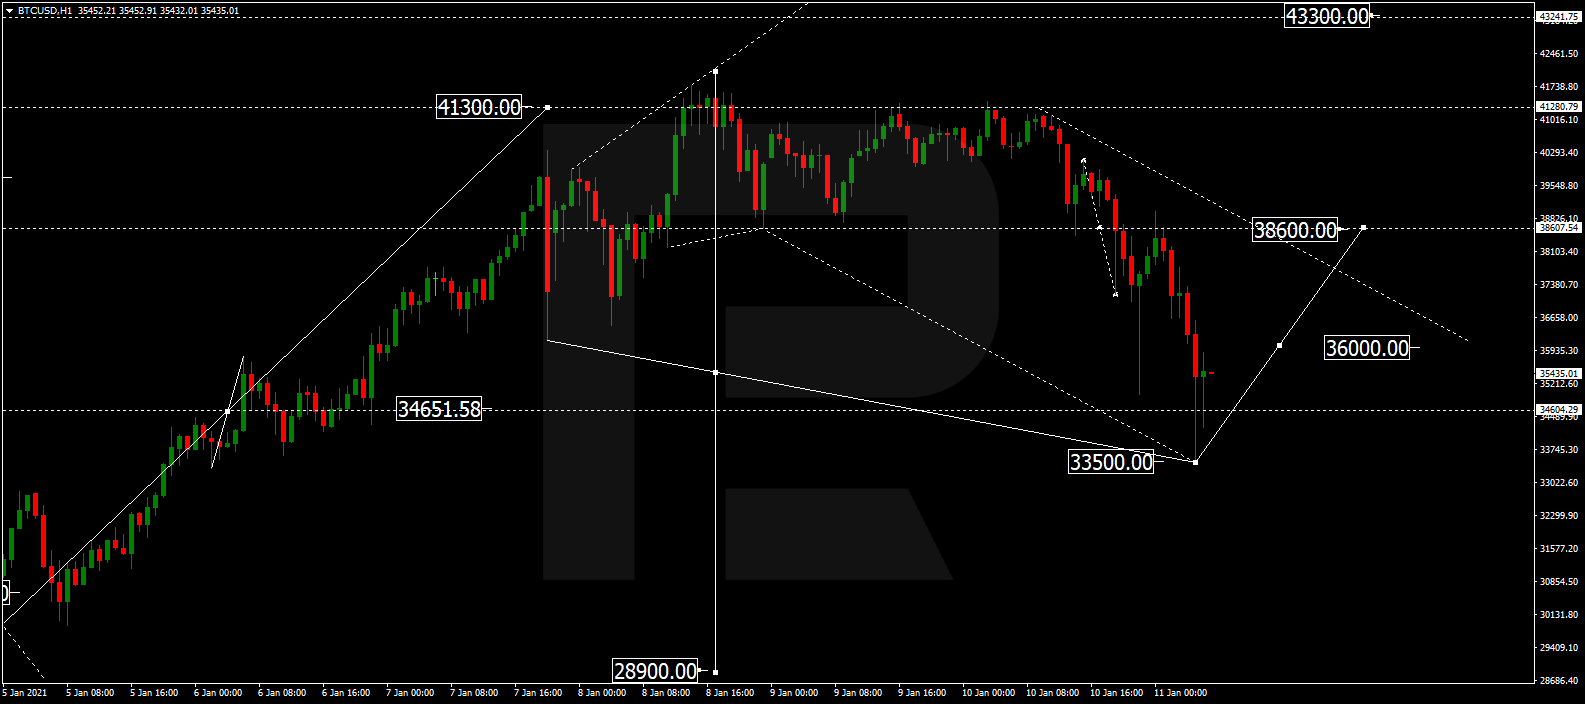
After breaking 38600.00 and then reaching the first downside target at 33500.00, BTCUSD is expected to correct in the form of a Flag pattern to return to 38600.00. After that, the instrument may resume trading downwards with the target at 28900.00.

BITCOIN
Risk Warning: the result of previous trading operations do not guarantee the same results in the future

S&P 500

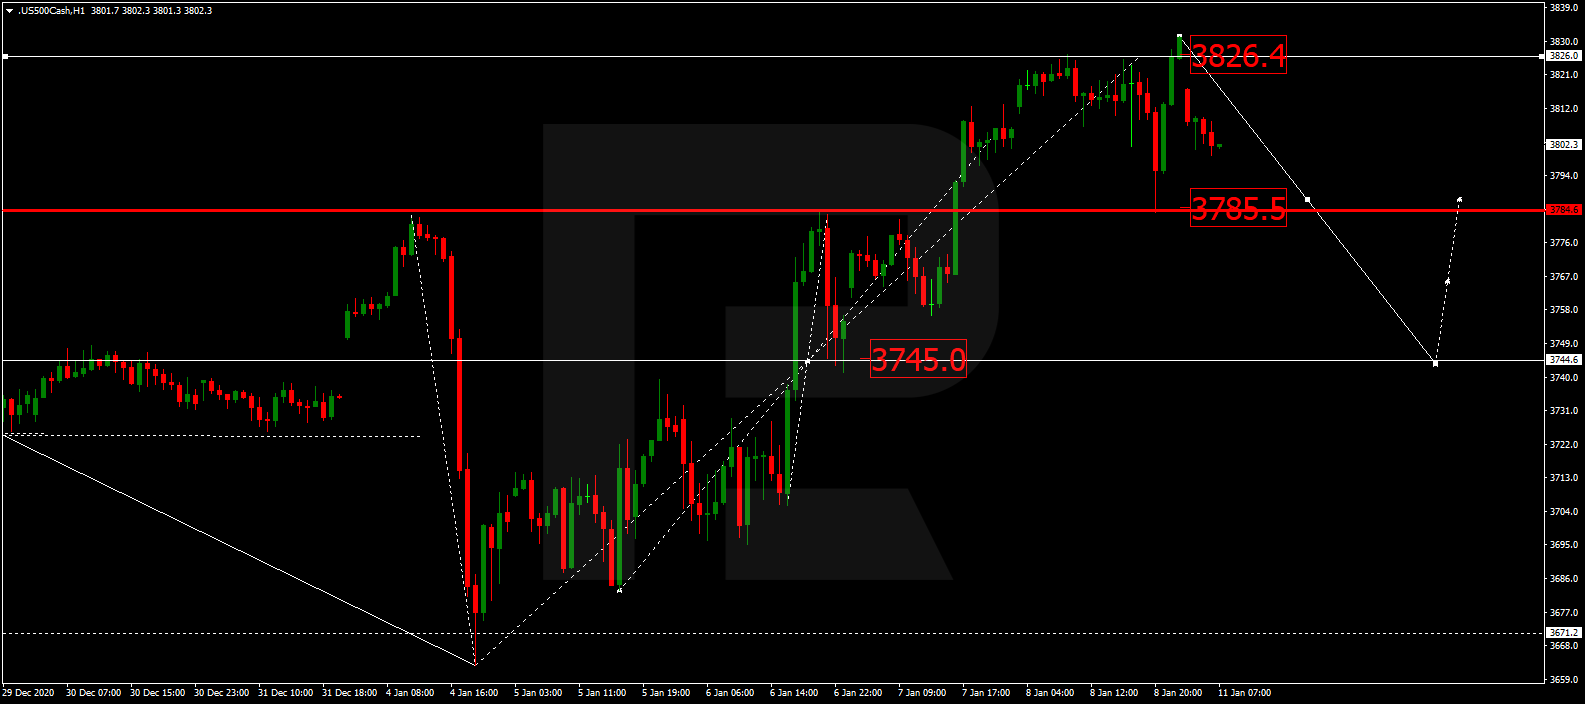
After finishing the ascending wave at 3826.4, the S&P index is falling to reach 3785.5. After that, the instrument may consolidate above the latter level. If later the price breaks this range to the downside, the market may resume moving downwards with the first target at 3745.0.

S&P 500

Article By RoboForex.com

Attention!
Forecasts presented in this section only reflect the author’s private opinion and should not be considered as guidance for trading. RoboForex LP bears no responsibility for trading results based on trading recommendations described in these analytical reviews.

GBPUSD Closes Flat As Consolidation Continues

By Orbex

GBPUSD

The British pound sterling is seen trading flat as the consolidation near the top end of the rally continues.

The cable has been in a strong volatile ride since late last year due to the Brexit trade talks. This has pushed the currency to test highs above 1.3650.

However, following the gains, price has been trading rather flat. On the short term charts, we see the consistent lower highs forming.

This could result in the descending triangle pattern likely to emerge. If the GBPUSD closes below the 1.3500 level of support, then we expect to see further declines lower.

The cable will most likely move back within the sideways range of 1.3500 and 1.3150 levels.

By Orbex

The Analytical Overview of the Main Currency Pairs on 2021.01.11

by JustForex

The EUR/USD currency pair

Technical indicators of the currency pair:
  • Prev Open: 1.2269
  • Prev Close: 1.2217
  • % chg. over the last day: -0.43%

EUR/USD has dropped significantly after a series of economic releases in the US. During the Asian session, the southern movement continued. Although it is too early to talk about a reversal, technical indicators indicate the beginning of a deep correction. Fundamental factors also point to a rise in the dollar against the European currency. The yield spread on the credit market among 10-year bonds widened significantly in the last week in favor of US securities.

Trading recommendations
  • Support levels: 1.2283, 1.2349
  • Resistance levels: 1.2152, 1.2130

The main scenario for trading EUR/USD is selling. The breakdown of the main support level at 1.2216 indicated the beginning of a deep correction. ADX is still weakly reacting to the movement, which indicates the likelihood of consolidation near current levels or a pullback. Convergence has formed on MACD, confirming the bearish trend.

Alternative scenario: if the price can consolidate above the level of 1.2283, the pair may return to the maximum values of 1.2349.

EUR/USD
Важный There is no news feed for today.

The GBP/USD currency pair

Technical indicators of the currency pair:
  • Prev Open: 1.3561
  • Prev Close: 1.3564
  • % chg. over the last day: +0.02%

On Friday, sterling bulls made an unsuccessful attempt to buy. The pound rose to its maximum values; however, it fell back to the American session’s opening price, leaving a long shadow at the top. A breakout of a significant support level indicates the presence of bears in the British currency.

Trading recommendations
  • Support levels: 1.3428, 1.3304
  • Resistance levels: 1.3634, 1.3670

The main scenario in GBP/USD is selling on growth. The price firmly consolidated below the moving averages and the level of 1.3540, which was the key to further movement. ADX showed a strong reaction to the southern movement, which indicates the growth of the bearish trend. Convergence was formed in MACD.

Alternative scenario: if the pair consolidates above 1.3583, the decline is likely to be stopped, and the pair will return to the range.

GBP/USD
There is no news feed for today.

The USD/JPY currency pair

Technical indicators of the currency pair:
  • Prev Open: 103.79
  • Prev Close: 103.94
  • % chg. over the last day: +0.14%

On Friday, the USD/JPY slowed down a bit, although there are no visible obstacles to the continuation of the northern movement. The stock market continues to hit new highs, driven by rising US bond yields. Usually, during such periods, the USD/JPY is in demand.

Trading recommendations
  • Support levels: 103.67, 103.18
  • Resistance levels: 104.76, 105.68

The main scenario is to purchase. The pair managed to consolidate above key levels, but so far, it looks more and more like a return to the range of the first half of December. Specifications indicate solid growth. ADX shows a high potential for an upward movement, but little is left to the overbought area. Accordingly, the first resistance can limit the first wave of correction.

An alternative scenario assumes the price-fixing below 103.67. In this case, the pair may fall to 102.89.

USD/JPY
There is no news feed for today.

The USD/CAD currency pair

Technical indicators of the currency pair:
  • Prev Open: 1.2686
  • Prev Close: 1.2688
  • % chg. over the last day: +0.02%

At the end of Friday, the US dollar closed slightly higher against the Canadian currency. However, there is a long shadow at the top of the daily chart, which does not indicate the instrument’s precise northern movement. Rising prices of the commodity market continue to put pressure on quotes.

Trading recommendations
  • Support levels: 1.2630, 1.2523
  • Resistance levels: 1.2797, 1.2875

The main scenario is cautious buying on growth. Not all indicators point to accelerating growth. Price fixing above the moving averages and convergence in MACD indicates the presence of bulls in the instrument. But the ADX is weak. The first resistance can be overwhelming for the pair.

Alternative scenario: if the price manages to consolidate below 1.2697, the pair may return to 1.2630.

USD/CAD
There is no news feed for today.

by JustForex


This article reflects a personal opinion and should not be interpreted as an investment advice, and/or offer, and/or a persistent request for carrying out financial transactions, and/or a guarantee, and/or a forecast of future events.

Key market events this week

By Han Tan, Market Analyst, ForexTime

Only the second full trading week of the year, and there’s plenty to keep markets on their toes.

Besides the world’s struggles with the Covid-19 pandemic that blanket market sentiment, here are some key events to look out for over the coming days:

  • Monday, 11 January: Key Fed officials may offer clues on asset purchasing pullback this week
  • Wednesday, 13 January: Democrat-controlled House may vote to impeach Trump, again
  • Thursday, 14 January: Biden unveils stimulus plans, Fed chair Powell speech
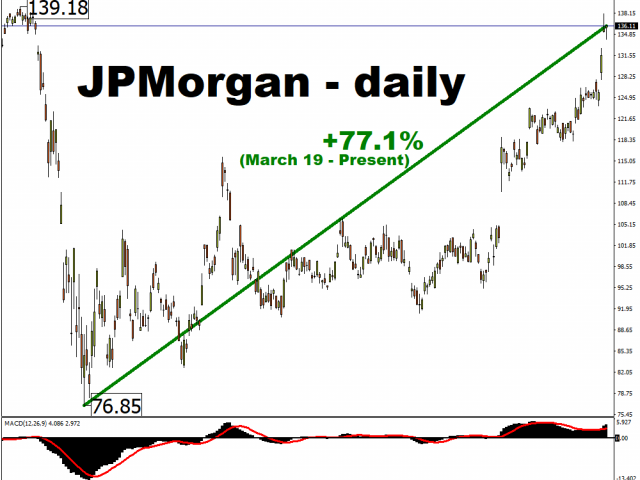
  • Friday, 15 January: JPMorgan kicks off US earnings season


Monday, 11 January

Given the forward-looking nature of the markets, investors have begun pondering when might the Federal Reserve begin easing up on their asset purchasing programme, which has been a major supportive element for financial markets since the pandemic. Starting Monday, various key Fed officials are scheduled to offer their respective economic outlooks over the coming days, culminating in Fed chair Jerome Powell’s webinar appearance on Thursday.

Considering that 10-year US Treasury yields are already at their highest levels since March, the mere hint of a pullback in the Fed’s asset purchasing programme could trigger another yields spike, which could come at the expense of the non-yielding Gold.


Wednesday, 13 January

With the chaotic scenes from last week’s Capitol breach still fresh in the world’s mind, Democrats are moving to impeach outgoing US President Donald Trump. That is, unless Vice President Mike Pence and the cabinet remove Trump first by invoking the 25th amendment, which appears unlikely.

While this could be mere political drama which markets are more than willing to ignore, it still presents a risk that prudent investors must continually monitor.


Thursday, 14 January

The reflation trade could be given fresh legs when President-elect Joe Biden outlines plans for “trillions of dollars” in added US fiscal stimulus. This would be a much-needed boost, especially in light of last Friday’s surprise contraction of 140,000 jobs in the December US non-farm payrolls report.

It remains to be seen which sectors would benefit the most, but Gold prices could see a pickup on heightened expectations for stimulus-fueled inflationary pressures, while US stocks may well ride higher on such optimism.


Friday, 15 January

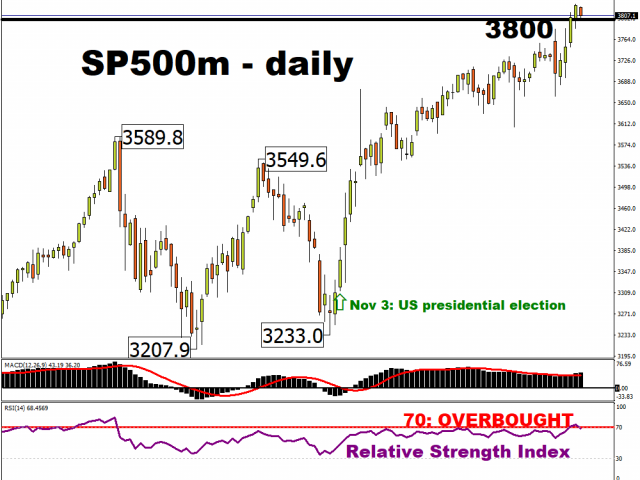
The US earnings season will kick off with JPMorgan leading the way once more. Banking stocks are back in vogue, as investors anticipate more fiscal stimulus as well as an extended ultra-accommodative policy stance by the Fed. The S&P 500 Financials Index has already gained 4.65 percent so far in 2021, making it the third best-performing sector on the benchmark index, behind Materials (+5.68%) and Energy (+9.31%).

Although the Q4 financial results that will be released over the coming weeks are backward-looking in nature, investors would be paying more attention to the business outlooks for these companies. Commentaries that harbour a more positive performance in the year ahead could spell more upside for share prices.


Disclaimer: The content in this article comprises personal opinions and should not be construed as containing personal and/or other investment advice and/or an offer of and/or solicitation for any transactions in financial instruments and/or a guarantee and/or prediction of future performance. ForexTime (FXTM), its affiliates, agents, directors, officers or employees do not guarantee the accuracy, validity, timeliness or completeness, of any information or data made available and assume no liability as to any loss arising from any investment based on the same.


Forex-Time-LogoArticle by ForexTime

ForexTime Ltd (FXTM) is an award winning international online forex broker regulated by CySEC 185/12 www.forextime.com

Crude Oil Keeping Head Up

Author: Dmitriy Gurkovskiy, Chief Analyst at RoboForex

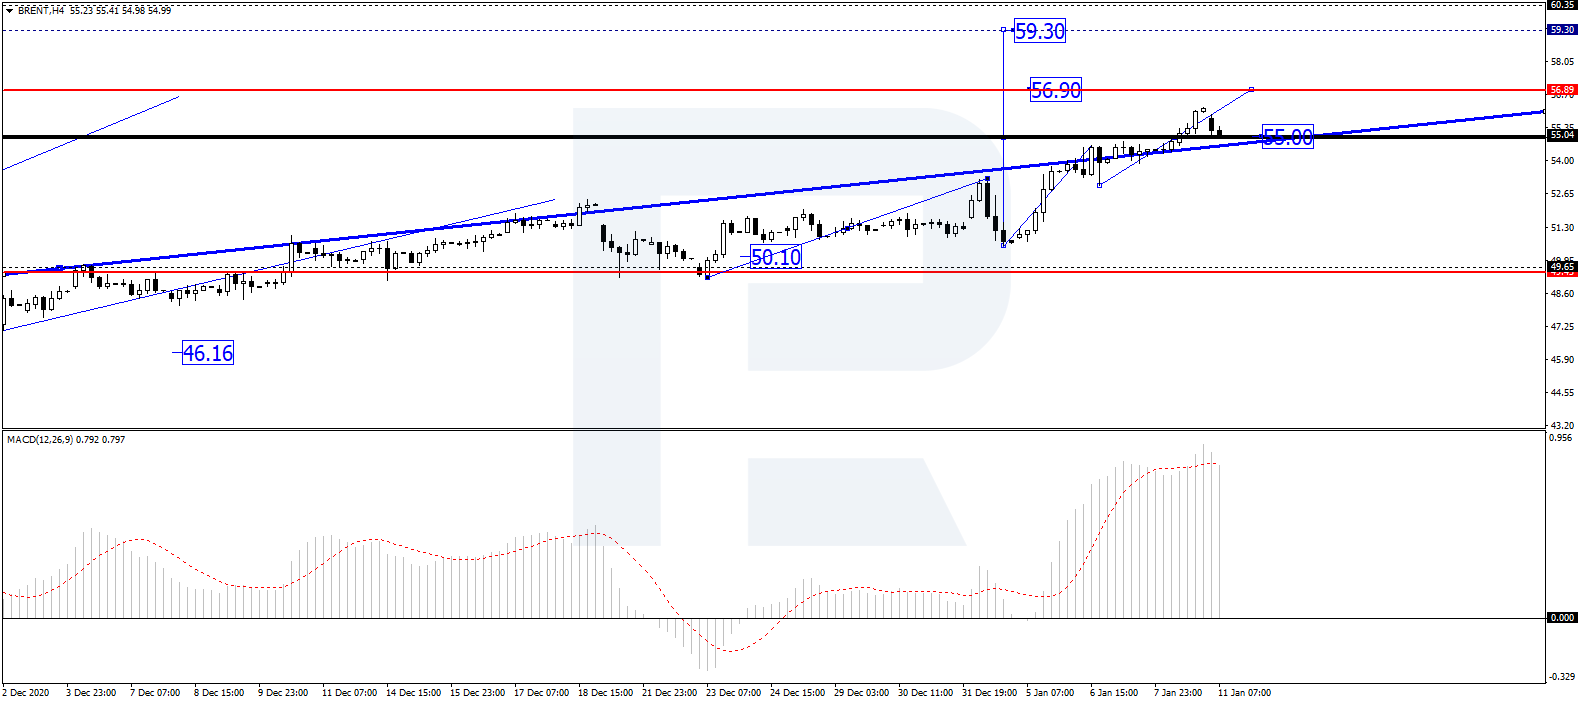
On Monday, January 11th, 2021, Brent is slightly correcting after updating its 11-month highs. The asset is trading at $55.34 USD – it has broken the psychologically important level of $55 for the first since February 2020.

Very few people expected the January meeting of the OPEC+ to bring any breakthrough solutions – it wasn’t the time for any active decisions because the oil market was more or less stable. However, the cartel and some other countries behaved rather atypically. Saudi Arabia and some other members voluntarily decided to cut the oil production in February and March and create “softer” working conditions for Russia and Kazakhstan. In this case, the global oil market will continue decreasing oil production and this fact was positively perceived by investors.

Still, the lion’s share of these emotions has already been included in prices and the black gold may slightly correct if the global demand remains moderate.

Since the beginning of January, Brent added 8%, which seems a bit too much.

In the H4 chart, after breaking 55.00 to the upside, Brent continues forming the third ascending wave with the target at 56.90; right now, the asset is returning to test 55.00 from above and may later resume growing to reach the above-mentioned target. After that, the instrument may form another correction to return to 55.00 and then form one more ascending wave towards 59.30. From the technical point of view, this scenario is confirmed by MACD Oscillator: its signal line is moving within the histogram area again, thus implying further growth on the price chart.
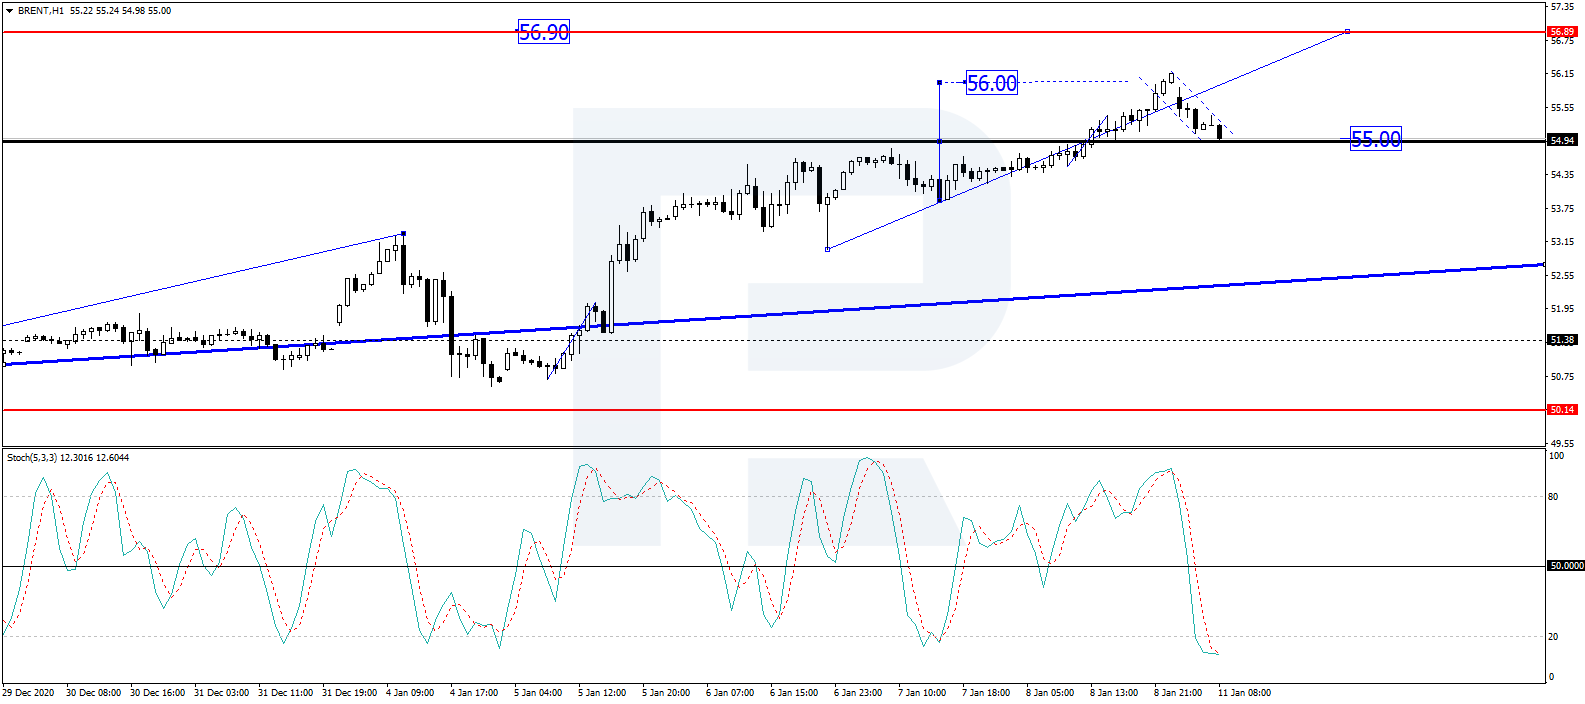
As we can see in the H1 chart, after completing the descending wave to test 55.00 from above, Brent is expected to grow to break 56.00 and then continue trading upwards with the short-term target at 56.90. Later, the market may correct to return to 55.00 and then resume moving within the uptrend. From the technical point of view, this idea is confirmed by Stochastic Oscillator: its signal line is moving below 20, which means that the market is “oversold” and may reverse to the upside to start a new growth towards 50. After that, the line may break this level as well, thus leading to further uptrend on the price chart.

Disclaimer

Any forecasts contained herein are based on the author’s particular opinion. This analysis may not be treated as trading advice. RoboForex bears no responsibility for trading results based on trading recommendations and reviews contained herein.