Why Indian farmers are so angry about the Modi government’s agricultural reforms

By Bhavani Shankar, University of Sheffield 

– India’s farmers have been protesting since the autumn, with a growing intensity that culminated in a violent breaching of barriers in the Red Fort in Delhi during India’s Republic Day celebrations on January 26.

The protests were spurred by the passing of a set of agricultural reform bills in parliament in September 2020 that aimed to fundamentally transform the way in which farm produce is marketed in the country. India’s farming population of more than 100 million is comprised largely of small farmers who fear that the reforms will add considerable uncertainty to their already meagre livelihoods.

India has historically had a strongly regulated marketing system for agricultural produce, originally devised to enable farmers to sell to the market but at the same time to protect the small, often poor farmers from the vagaries of the open market.

Such regulation is a state-level responsibility in India’s federal governance structure. Accordingly, each state devised a system wherein the initial purchase and sale of agricultural products had to be conducted at state-regulated wholesale markets called mandis. These mandis had licensed middlemen and traders who could be regulated by the government to ensure that farmers were not exploited.

The broader legislative framework also acted to limit private sector storage of key food products (to prevent hoarding) and discourage direct contracting between private agribusiness and farmers. There were important variations in regulations across states, and legislation has changed over time, but the broad intention was to protect farmers by limiting the power of agribusiness.

However, the regulatory system did not always work as intended in practice, and deficiencies became apparent over time. Despite the idea of monitoring, traders and middlemen in wholesale markets were found to often collude to the disadvantage of the farmer. Pricing practices were opaque and farmers too often received a very low share of the price.

Variations in regulations across states also hindered interstate trade opportunities. As the Indian economy was liberalised, private enterprise and agribusiness was growing, but found itself shackled by the regulatory framework. Many commentators agreed that reform was needed.

The three bills

A set of three complementary bills was rushed through parliament by the Modi government in September 2020. The first seeks to erode the role of the regulated mandis in marketing farm produce by allowing parallel trade, including electronic trading, outside the mandi system within and across states.

The second loosens the restrictions on private sector storage and stocking of produce, allowing restrictions only in case of strong price spikes when hoarding becomes a strong concern.

The third bill sets up a framework for direct formal contracting between farmers and the agribusinesses that buy from them.

Taken together, these bills are a radical departure from the tightly regulated system for marketing agricultural produce that existed before. The bills would curb the regulatory power of states, allowing the central government to set the agenda more firmly.

The reforms provide a significant fillip to the operation of private enterprise, especially large agribusiness in India. The expectation of the government is that the strengthening of these parallel market channels will create competition for the farmers’ produce from both within and across states, leading to improved remuneration for farmers.

What are the farmers unhappy about?

Although the reforms are ostensibly about empowering farmers, there is deep concern that they will largely boost private agribusiness to the detriment of the livelihoods of small farmers. The bills propose new market channels that are largely unregulated, potentially leaving farmers at the mercy of powerful private sector players.

A related concern is that the emergence of these parallel channels will undermine the longstanding regulated mandi system that farmers understand and are used to operating in, despite its numerous flaws.

Contract farming, which would become more commonplace if the bills become law, theoretically offers farmers the option of cutting out middlemen and their fees to deal directly with a downstream buyer. But experience from India and around the world shows that large buyers often prefer to deal with larger farmers located in well-developed regions who can supply assured large volumes with minimal friction. Thus small farmers from less developed areas with poor infrastructure may find themselves frozen out of such channels.

These serious concerns have led protesting farmers to demand not just alterations to the new bills, but their complete repeal. The direction of travel of the bills – towards private sector entry and government withdrawal – has also left farmers worrying about the future of other government policies that have long supported their livelihoods, such as Minimum Support Prices (MSPs).

MSPs are minimum prices announced periodically by the government for certain essential farm products, and used when the government buys these crops from the farmers for distribution to poor consumers. The MSPs help provide a measure of stability and certainty to prices received by farmers, and the protesting farmers want MSPs to be legally guaranteed in the future. This and a set of other demands, ranging from the cancellation of penalties for crop residue burning that contributes to air pollution, to enhancements to energy subsidies, have now also been added to the farmers’ core demand to cancel reforms.The Conversation

About the Author:

Bhavani Shankar, Professorial Reseach Fellow in Food Systems and Health, University of Sheffield

This article is republished from The Conversation under a Creative Commons license. Read the original article.

 

Oil Rally Helps Exxon Recover

By Orbex

Shares in US energy firm Exxon are trading a little higher pre-market on Thursday, following on from a strong rally over yesterday’s session. Having corrected lower from the recent highs above the 51 level to lows of mid 46, Exxon shares are now in demand again as oil prices continue to breakout higher.

The rally in Exxon comes despite a set of much weaker than expected Q4 earnings reported earlier in the week.

Earnings Miss

Exxon reported fourth-quarter earnings per share of -$4.70, wildly lower than the $0.08 Wall Street was looking for. Q4 losses will be a big disappointment to Exxon following two prior quarters of consecutive earnings growth.

Revenues were also lower than expected at $46.54 billion versus $48.76 billion. This marked a stark drop from the $67.7 billion recorded over the same period a year prior.

Past Year Has Been Most Challenging

Commenting on the results, Exxon CEO Darren Woods acknowledged that:

“the past year has presented the most challenging market conditions. Woods explained that as a result of the disruption caused by the pandemic, the company had adopted an aggressive cost cutting strategy which should help deliver structural expense savings of around $6 billion per year by 2023. Woods went on to say: “We’ve built a flexible capital program that is robust to a range of market scenarios and focused on our highest-return opportunities to drive greater cash flow, cover the dividend, and increase the earnings potential of our business in the near and longer term,”

Investing in Greener Approach

During the earnings release, Exxon outlined its plans to invest $3 billion in carbon capture as well as other technology aimed at helping reduce emissions. This comes on the back of the company recently releasing its emissions data for the first time. It is part of a broader response to investor calls for a greener mandate.

The past 12 months have been brutal for Exxon. This is given the heavy decline in oil prices last year as well as the massive drop in demand seen worldwide.

However, despite still being down 27% over the last 12 months, Exxon shares are up 9% this year as oil prices continue to rally and vaccine optimism helps the outlook improve.

Exxon Capped By Trend Line

The rally in Exxon shares this year saw price climbing as high as a retest of the bearish trend line before reversing lower as selling kicked in. However, while price holds above the 44.44 level, which has seen decent demand so far, the outlook is for a continuation higher in the near term. If bulls can surpass the 50.46 level, the next upside marker to watch is the 55.39 level.

By Orbex

Japanese Candlesticks Analysis 04.02.2021 (GOLD, NZDUSD, GBPUSD)

Article By RoboForex.com

XAUUSD, “Gold vs US Dollar”

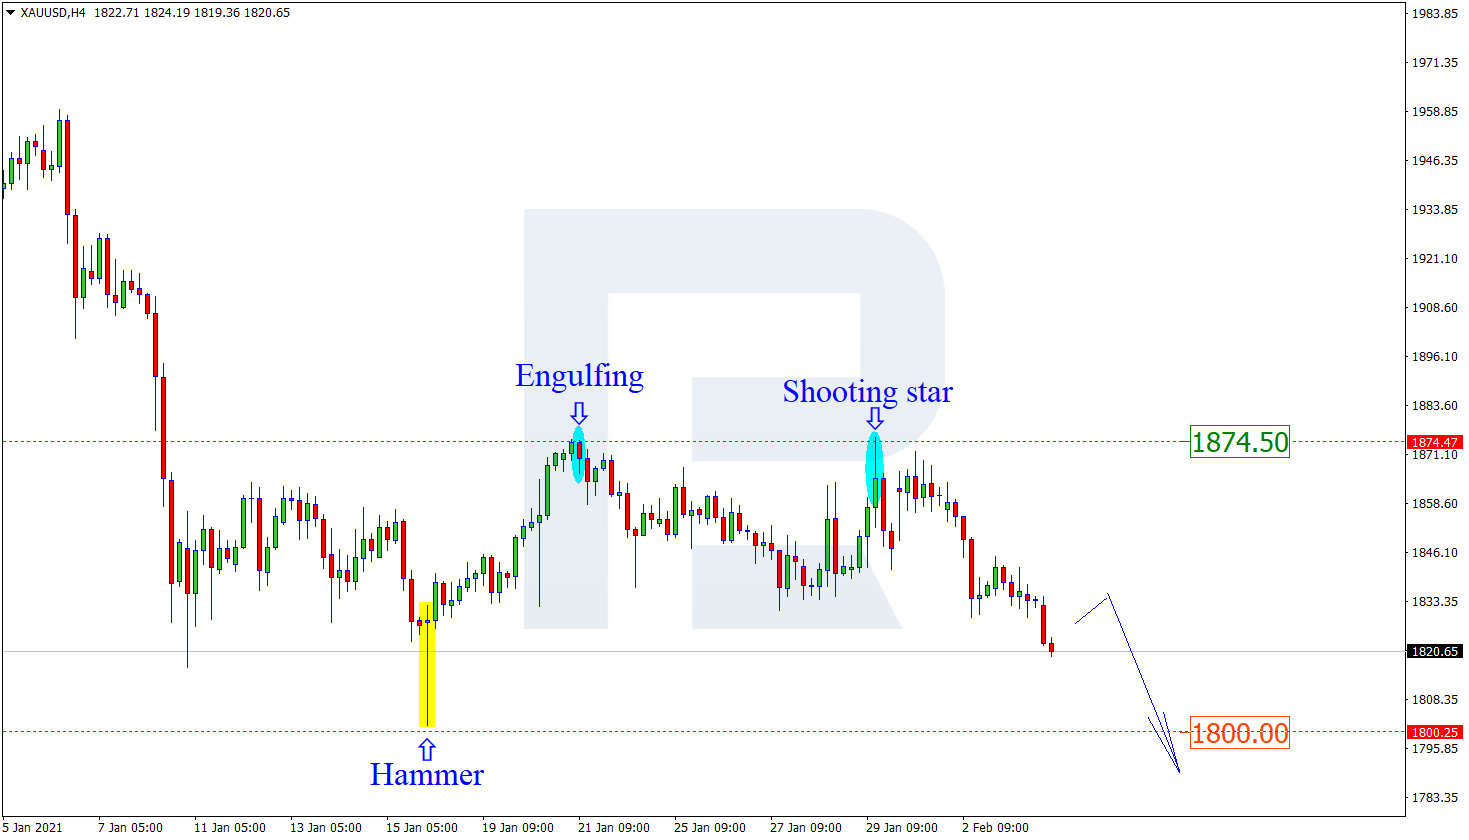
As we can see in the H4 chart, the metal is still trading downwards. Right now, after forming several reversal patterns, such as Shooting Star, close to the horizontal resistance level, XAUUSD is reversing and may resume falling towards the support area. In this case, the downside target will be at 1800.00. At the same time, an opposite scenario implies that the price may continue its growth towards 1874.00 before falling to reach the support area.

XAUUSD
Risk Warning: the result of previous trading operations do not guarantee the same results in the future

NZDUSD, “New Zealand vs. US Dollar”

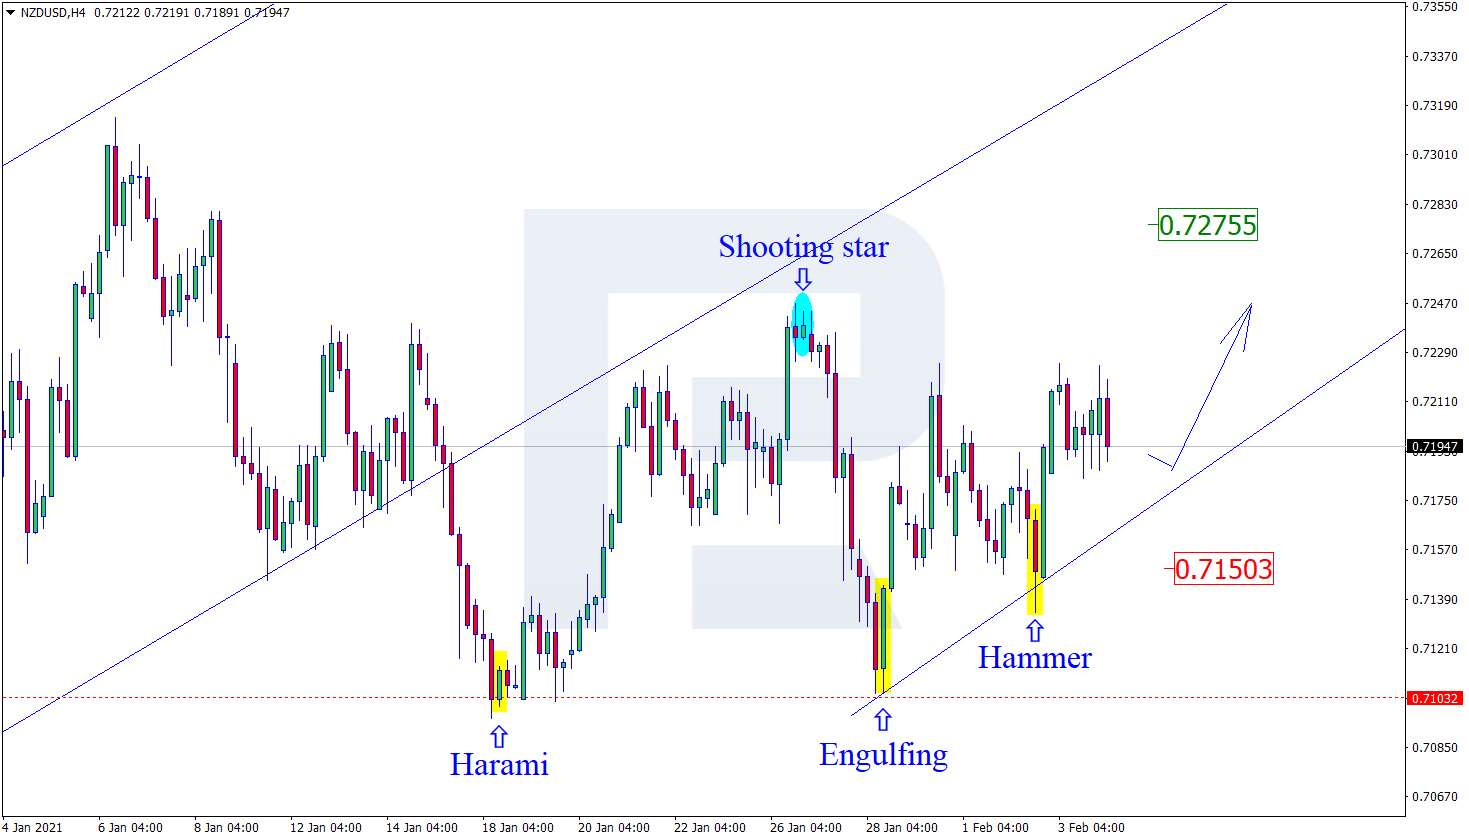
As we can see in the H4 chart, the pair is still moving upwards. Right now, after forming several reversal patterns, such as Hammer, close to the support level, NZDUSD is reversing. Later, the asset may grow and reach the resistance area at 0.7275. However, an alternative scenario implies that the price may continue falling towards 0.7150 before resuming the ascending impulse.

NZDUSD
Risk Warning: the result of previous trading operations do not guarantee the same results in the future

GBPUSD, “Great Britain Pound vs US Dollar”

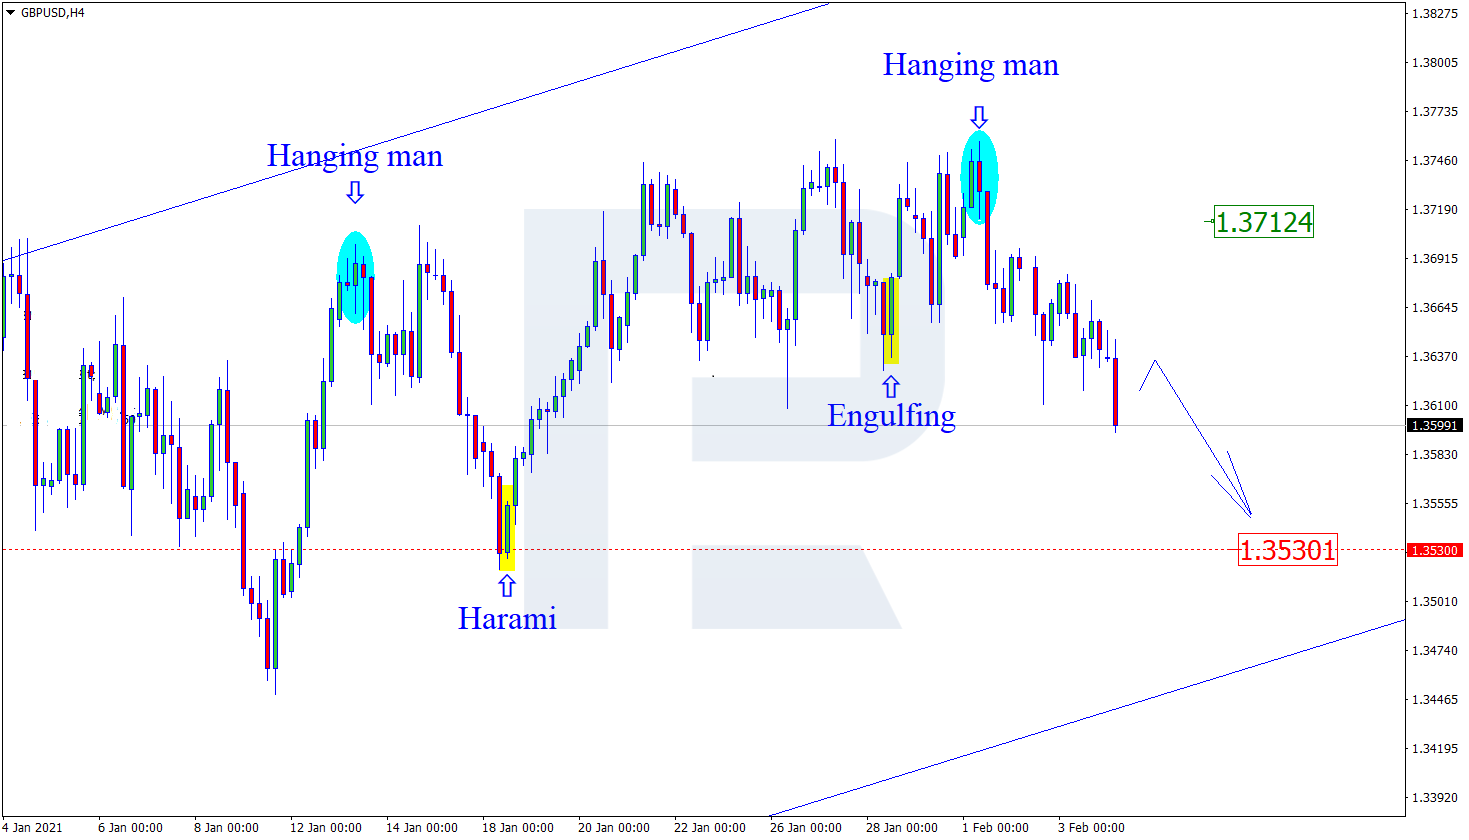
As we can see in the H4 chart, the downtrend continues. Right now, after forming a Hanging Man pattern not far from the resistance area, GBPUSD is reversing. In this case, the downside target is the support level at 1.3530. After that, the instrument may correct to the upside from the support area and then resume moving downwards. Still, there might be an alternative scenario, according to which the asset may correct to reach 1.3712 before resuming its decline.

GBPUSD

Article By RoboForex.com

Attention!
Forecasts presented in this section only reflect the author’s private opinion and should not be considered as guidance for trading. RoboForex LP bears no responsibility for trading results based on trading recommendations described in these analytical reviews.

Gold Prices Subdued Below 1850

By Orbex

xauusd

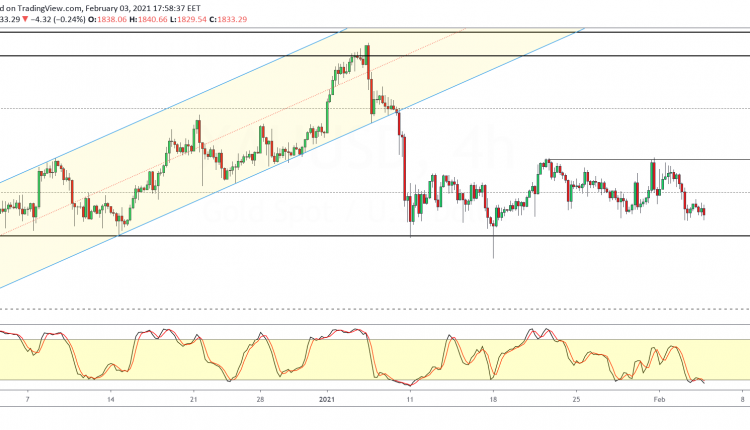
The precious metal is posting modest declines a day after the precious metal fell over 1.2%. However, price action remains well supported above the 1817.80 level.

In the near term, we expect price action to remain trading flat within the 1850 and 1817.80 levels.

The Stochastics oscillator is currently slipping into the oversold level. This could indicate further near-term downside.

Stronger price action is, however, expected on the back of fundamentals. This is especially regarding the Coronavirus stimulus bill.

By Orbex

Forex Technical Analysis & Forecast 04.02.2021

Article By RoboForex.com

EURUSD, “Euro vs US Dollar”

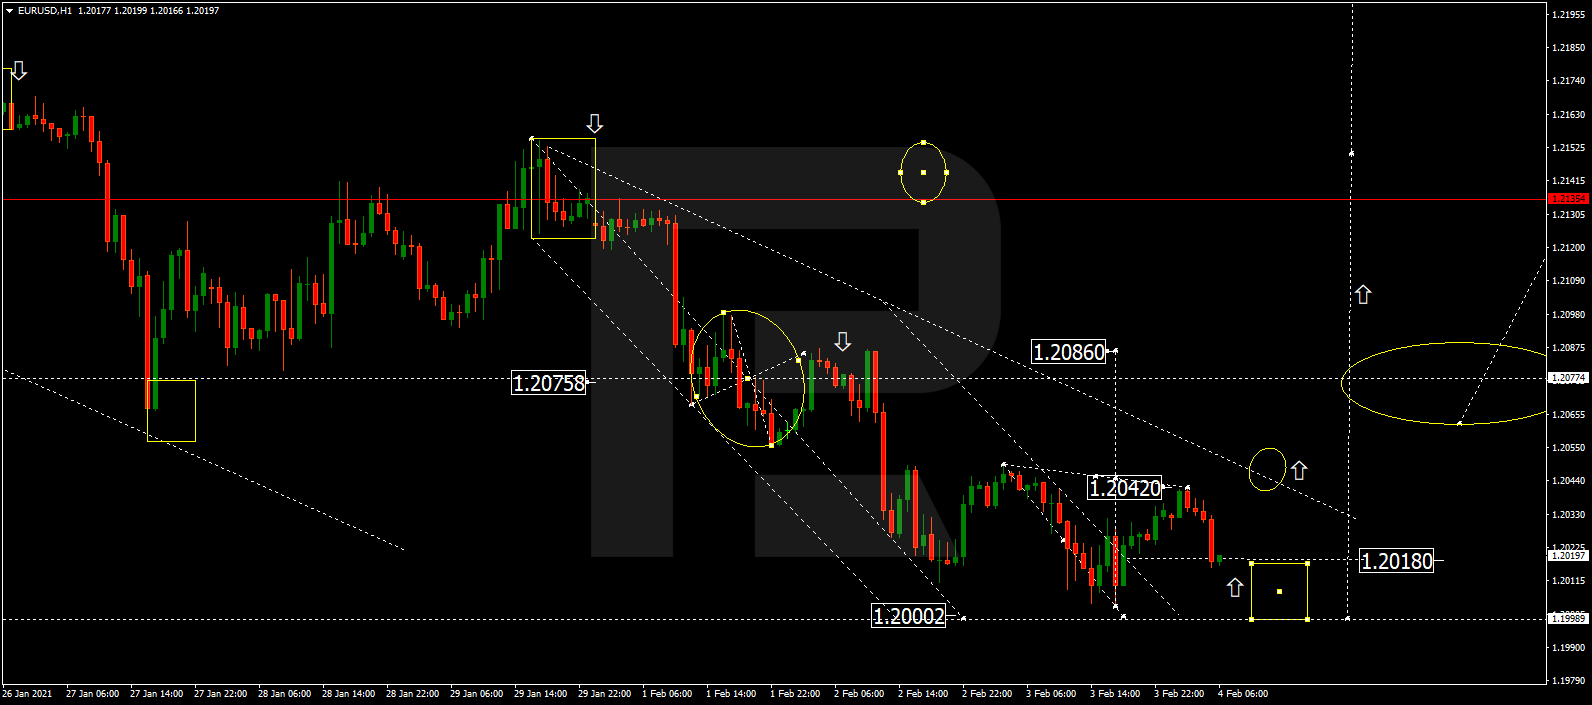
After expanding the range down and up to 1.2003 and 1.2042 respectively, EURUSD is still consolidating around 1.2025. If later the price breaks this range to the upside, the market may resume growing with the target at 1.2086; if to the downside – start a new decline to update 1.2000 and then form one more ascending wave to reach the above-mentioned target.

EURUSD
Risk Warning: the result of previous trading operations do not guarantee the same results in the future

GBPUSD, “Great Britain Pound vs US Dollar”

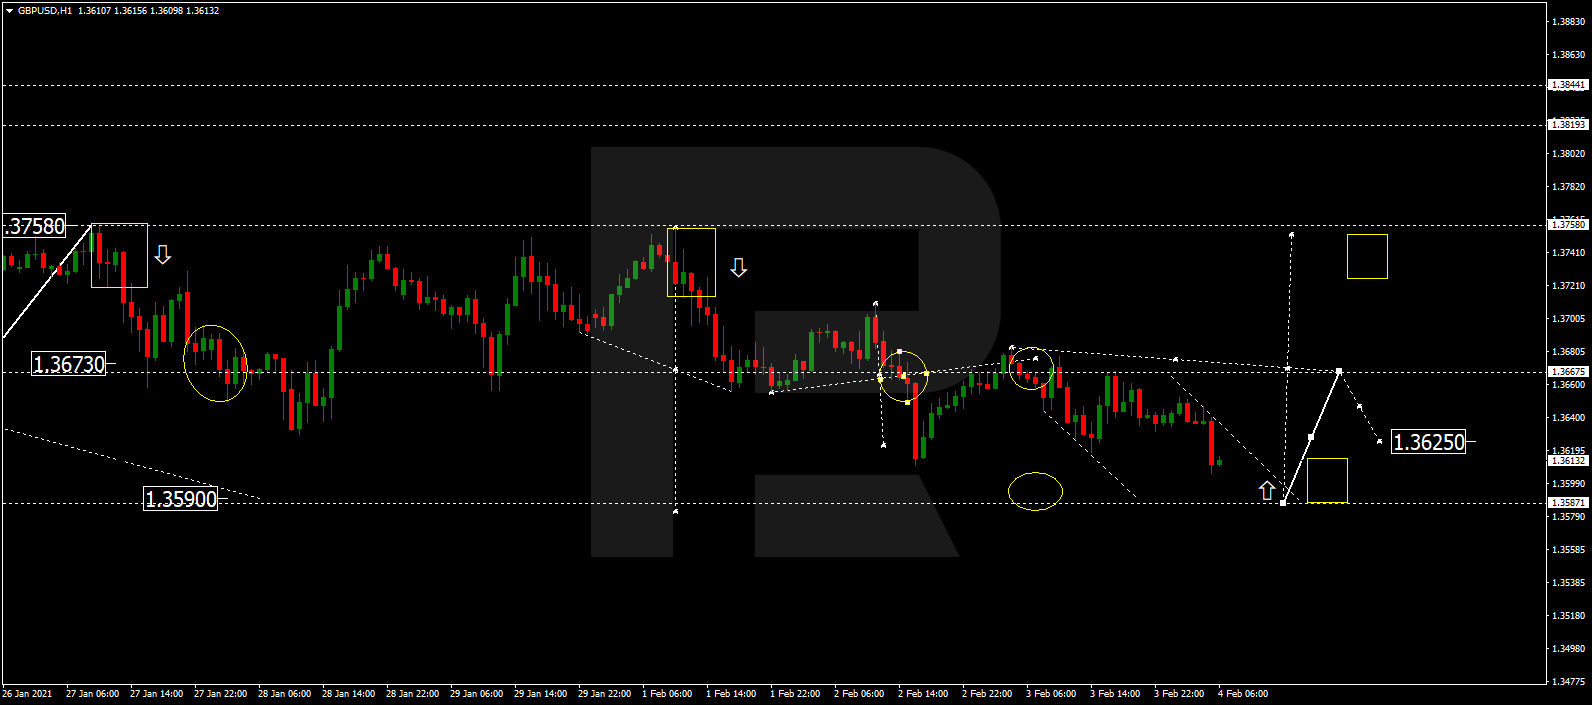
GBPUSD is still falling towards 1.3590 and may later consolidate there. After that, the instrument may break the range to the upside and form one more ascending wave with the target at 1.3750.

GBPUSD
Risk Warning: the result of previous trading operations do not guarantee the same results in the future

USDRUB, “US Dollar vs Russian Ruble”

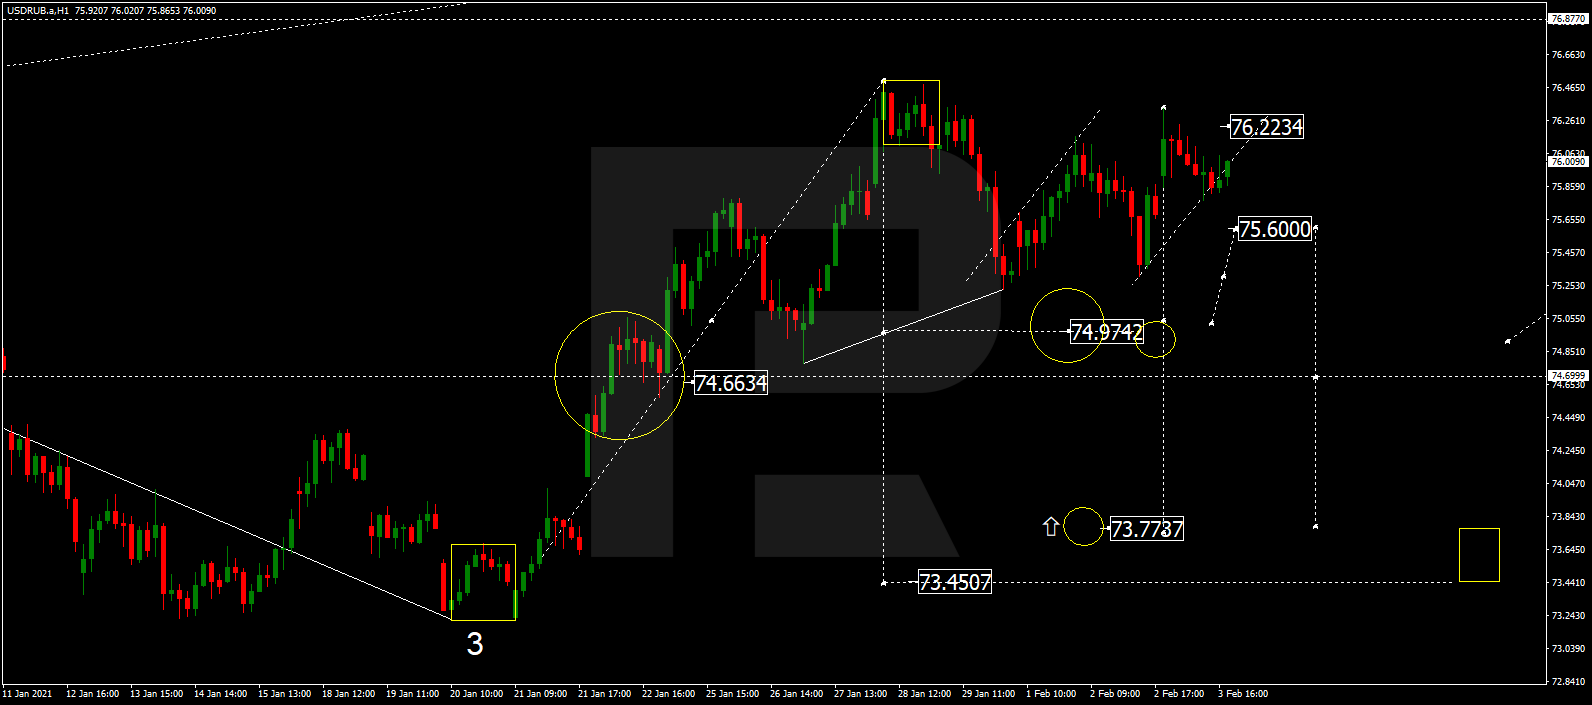
USDRUB has completed the ascending wave 76.22. Today, the pair may start another decline to break 75.60 and continue trading downwards with the target at 74.94.

USDRUB
Risk Warning: the result of previous trading operations do not guarantee the same results in the future

USDJPY, “US Dollar vs Japanese Yen”

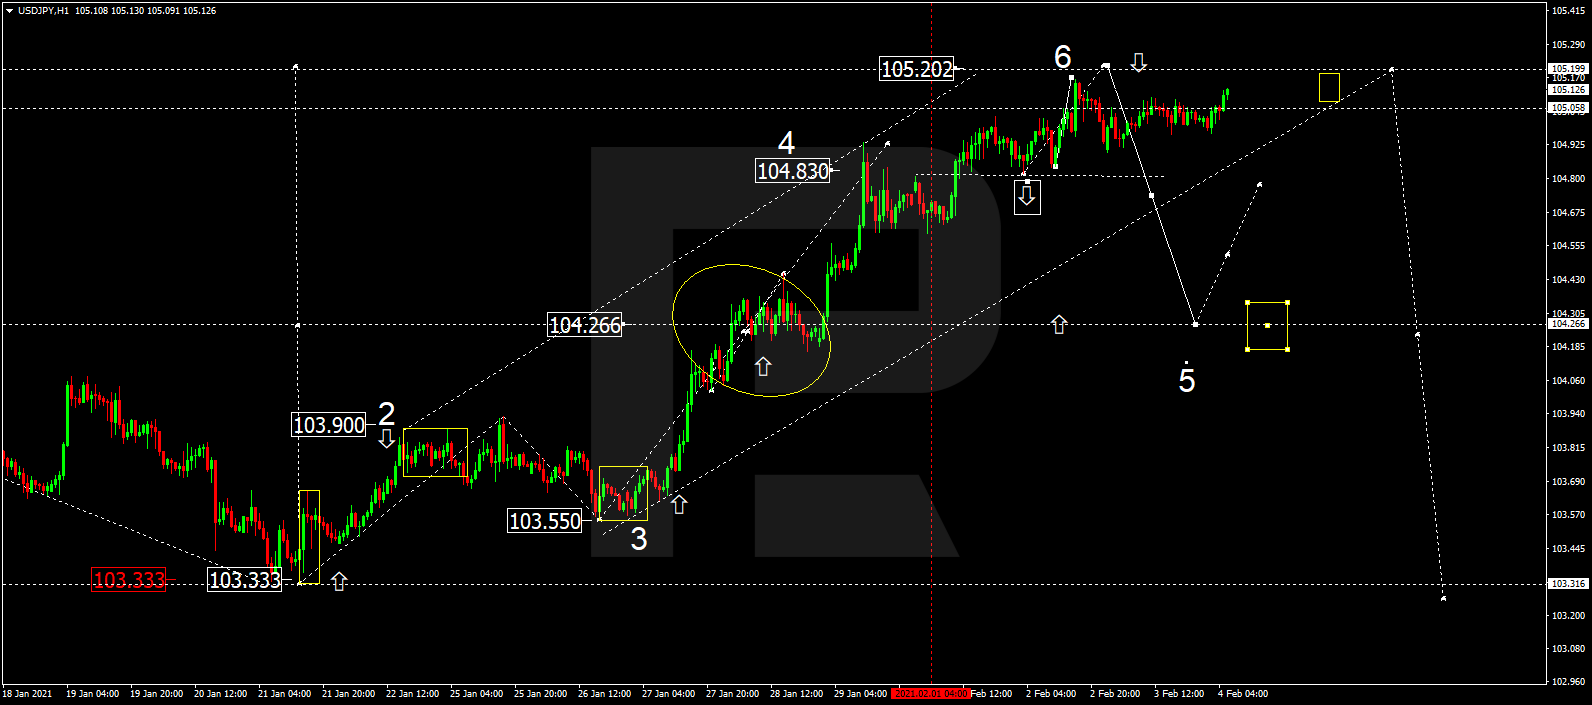
USDJPY is still growing towards 105.20. After that, the instrument may form a new descending structure to break 104.00 and then continue falling with the target at 103.33.

USDJPY
Risk Warning: the result of previous trading operations do not guarantee the same results in the future

USDCHF, “US Dollar vs Swiss Franc”

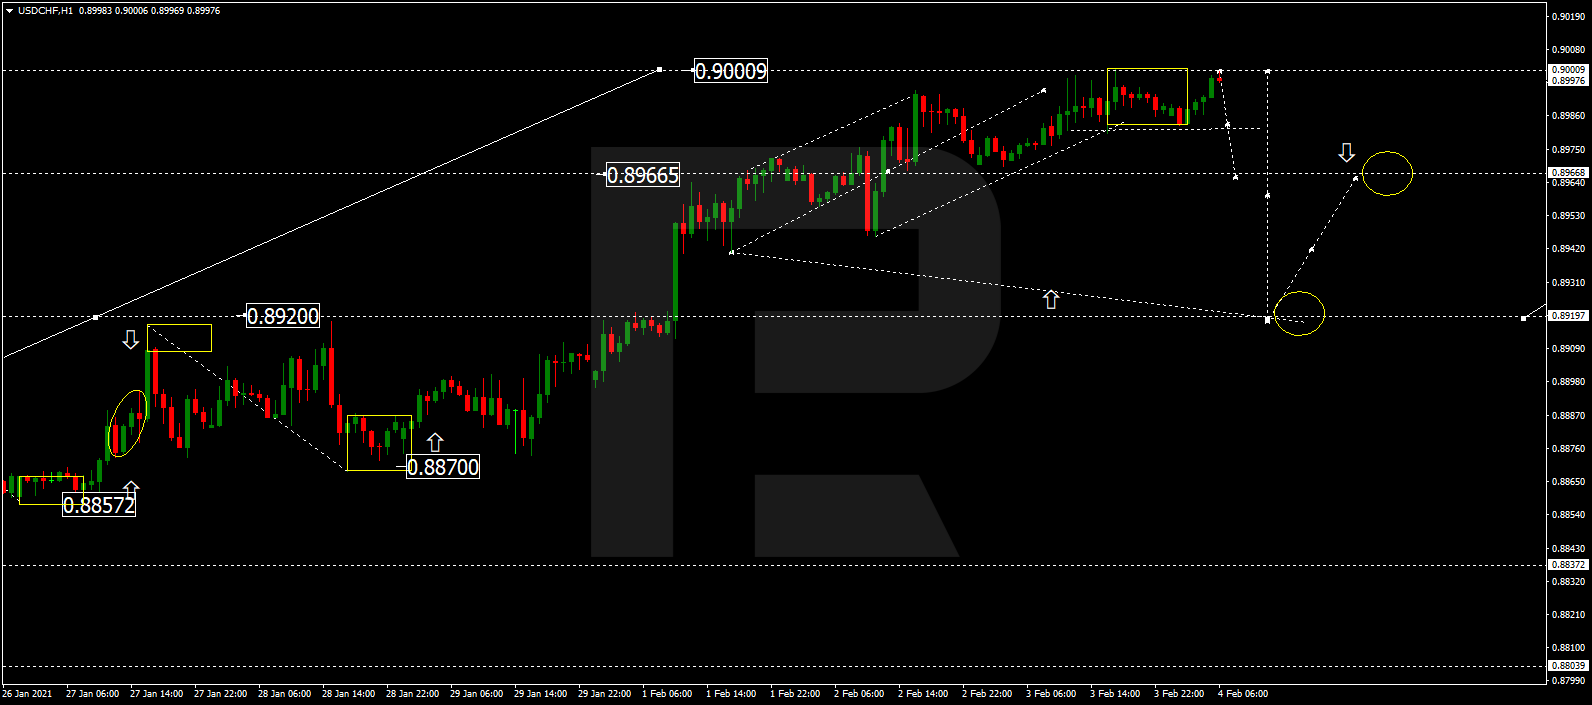
USDCHF has finished the ascending wave at 0.9000; right now, it is forming a new consolidation range around this level. Today, the pair may break the range to the downside and resume trading upwards with the first target at 0.8920.

USDCHF
Risk Warning: the result of previous trading operations do not guarantee the same results in the future

AUDUSD, “Australian Dollar vs US Dollar”

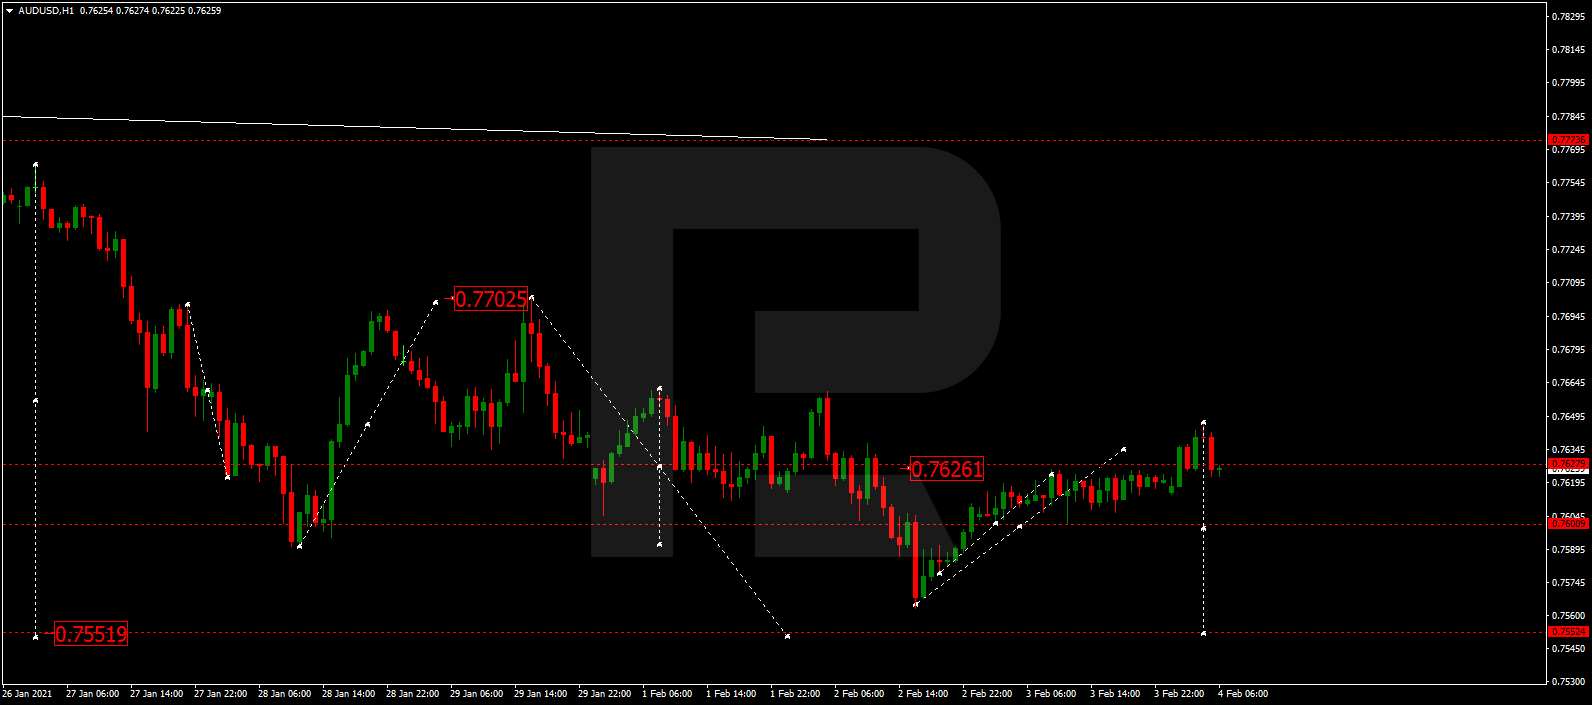
After returning to 0.7626, AUDUSD is consolidating around this level. Possibly, the pair may break the range to the downside and move downwards to reach 0.7552. After that, the instrument may start another growth with the target at 0.7700.

AUDUSD
Risk Warning: the result of previous trading operations do not guarantee the same results in the future

BRENT

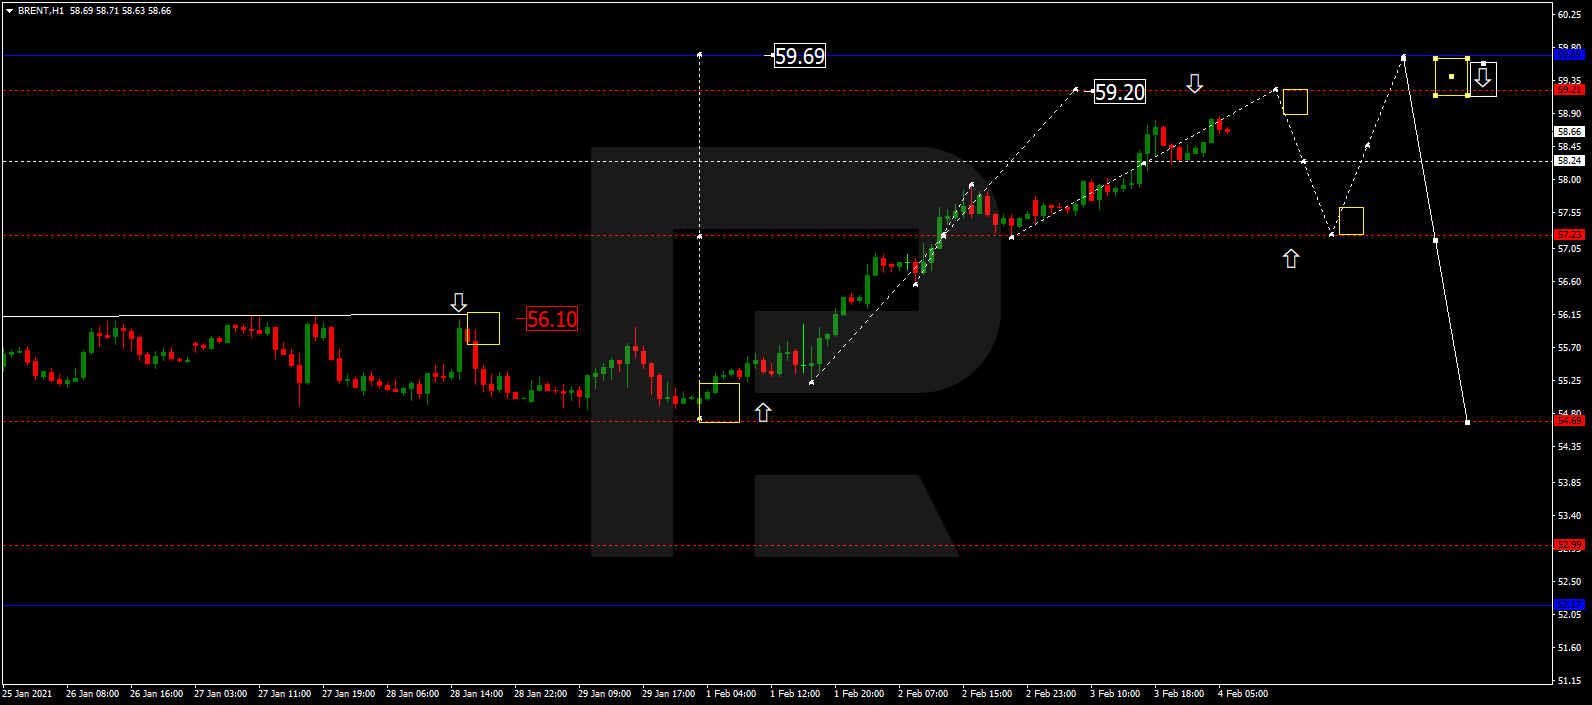
Brent is still growing. Possibly, today the asset may reach 59.20 and then consolidate there. After that, the instrument may break the range to the downside and correct towards 57.30. Later, the market may form one more ascending structure with the target at 59.69.

BRENT
Risk Warning: the result of previous trading operations do not guarantee the same results in the future

GOLD

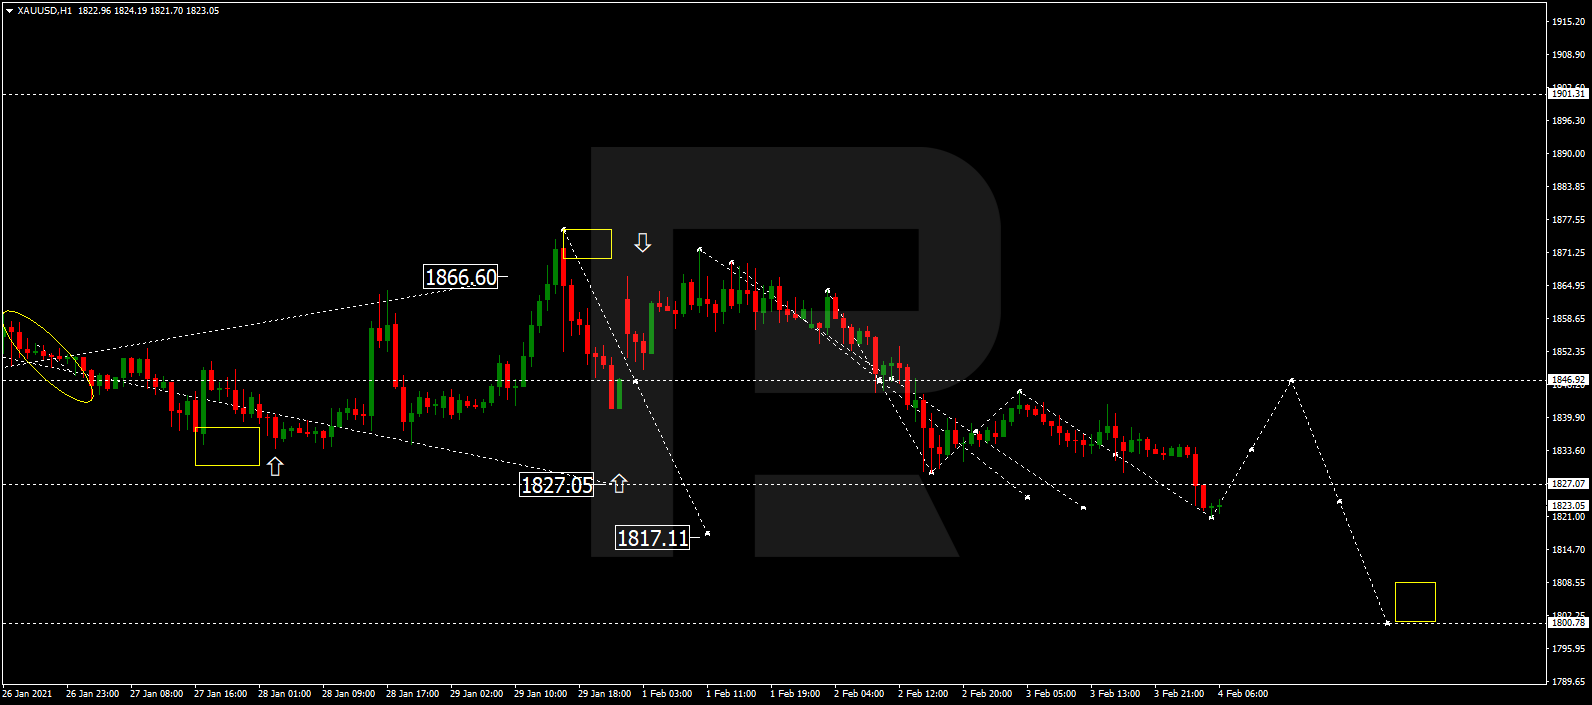
Gold is still forming the descending structure with the target at 1817.11. After that, the instrument may resume trading upwards to reach 1847.00..

GOLD
Risk Warning: the result of previous trading operations do not guarantee the same results in the future

BTCUSD, “Bitcoin vs US Dollar”

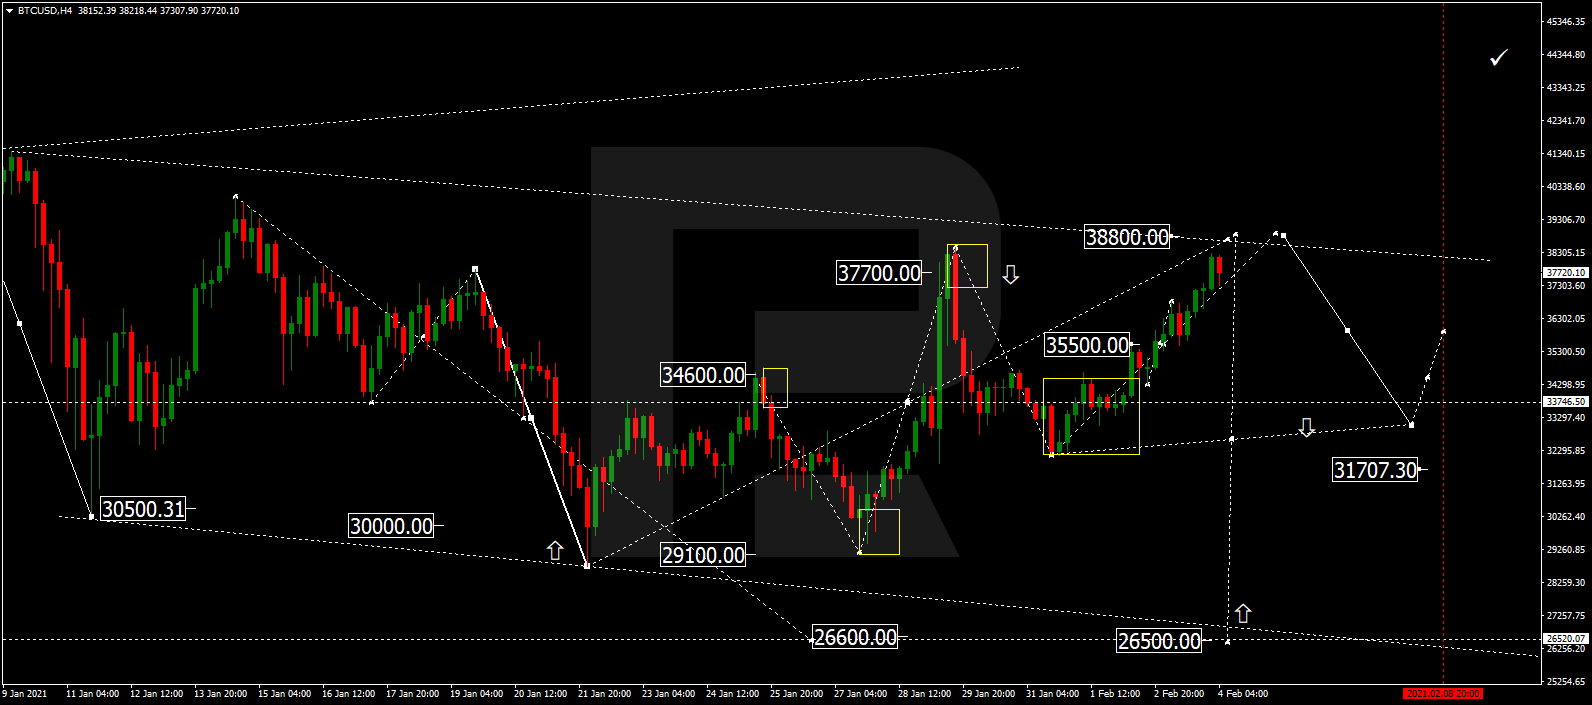
BTCUSD is growing to reach 38800.00. Later, the market may resume trading downwards with the target at 31700.00.

BITCOIN
Risk Warning: the result of previous trading operations do not guarantee the same results in the future

S&P 500

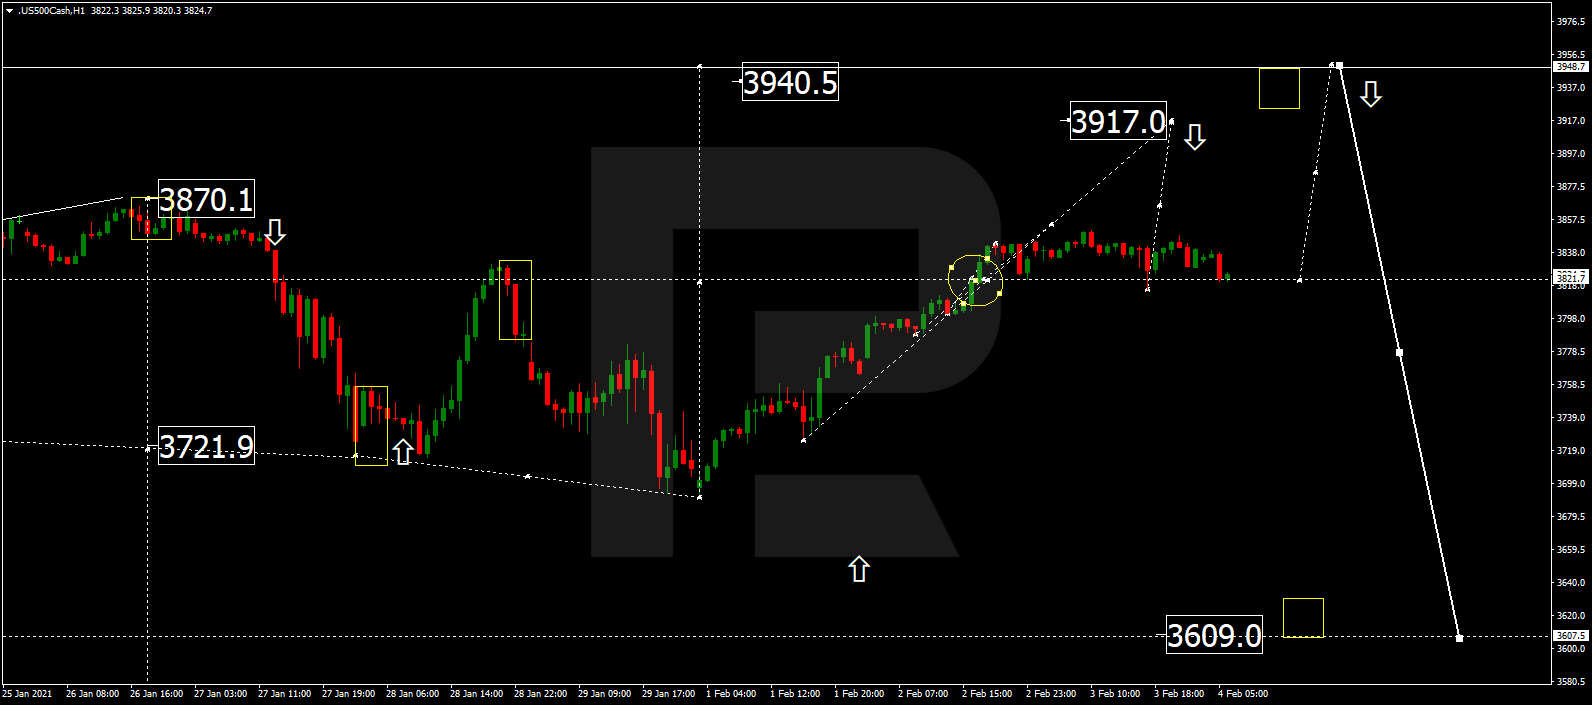
The S&P index is consolidating around 3821.7. If later the price breaks this range to the upside, the market may resume growing to reach 3917.0 and then start a new correction to return to 3821.7; if to the downside – correct towards 3800.0 and then resume growing with the target at 3900.0.

S&P 500

Article By RoboForex.com

Attention!
Forecasts presented in this section only reflect the author’s private opinion and should not be considered as guidance for trading. RoboForex LP bears no responsibility for trading results based on trading recommendations described in these analytical reviews.

The Analytical Overview of the Main Currency Pairs on 2021.02.04

by JustForex

The EUR/USD currency pair

Technical indicators of the currency pair:
  • Prev Open: 1.2041
  • Prev Close: 1.2034
  • % chg. over the last day: -0.06%.

The EUR/USD, one might say, reluctantly reacts to positive statistics from the US. The decline looks more like a symbolic one, although the dynamics of government bonds, where the yield of American securities is growing faster than of the European ones, confirms the development of a southern correction in the pair.

Trading recommendations
  • Support levels: 1.2004, 1.1799
  • Resistance levels: 1.2059

The main scenario for trading the EUR/USD is selling on the rise. Not all indicators show a decline at the moment. A divergence has formed on the MACD, and the ADX shows a decline in bearish potential, which may indicate a corrective rise. However, it is only considered in the short term, as the H4 and the D1 timeframes are all set to the south.

Alternative scenario: if the price consolidates above the level of 1.2059, the pair may return to the previous range of 1.2059 – 1.2155.

EUR/USD
There is no news feed for today.

The GBP/USD currency pair

Technical indicators of the currency pair:
  • Prev Open: 1.3663
  • Prev Close: 1.3640
  • % chg. over the last day: -0.17%

On Wednesday, the sterling showed a greater tendency to decline than the euro, breaking through the key support level. This is a strong signal to sell, but one should take into account that speculative movements in the market are possible ahead of the announcement of the BOE meeting results. The situation can change during the European session, and the breakthrough may turn out false.

Trading recommendations
  • Support levels: 1.3539, 1.3517
  • Resistance levels: 1.3609, 1.3757

The main scenario for trading the GBP/USD pair is cautious selling on the rise. The tech specs can be hardly called bearish. Fixation below the moving averages gives a southern signal. Although the MACD is showing divergence and the ADX is not showing any significant reaction to the southward movement. The aggregate signal is very close to neutral.

Alternative scenario: if the pair consolidates above 1.3609, it is likely to resume growth to 1.3675.

GBP/USD
News feed for 2021.02.04:
  • – The UK Construction Purchasing Managers Index (PMI) (Jan) at 11:30 (GMT+2);
  • – The Bank of England interest rate decision (Feb) at 14:00 (GMT+2).

The USD/JPY currency pair

Technical indicators of the currency pair:
  • Prev Open: 104.95
  • Prev Close: 105.01
  • % chg. over the last day: +0.05%

The dollar-yen in the Asian session was able to renew its Tuesday highs. There are no reasons for it to stop yet. The growth of the dollar index is caused by the publication of positive economic data. Optimism has returned to the stock market, and yields on the credit market are growing. These are all bullish factors for the pair.

Trading recommendations
  • Support levels: 104.82, 104.40
  • Resistance levels: 105.68, 106.12

The main scenario is buying. Apparently, the next target for the pair will be 105.68, as the ADX shows a significant reaction to the growth. About 50 more points are needed to reach the overheating area. Other indicators also speak in favor of growth. Given the fact that the growth is continuing after consolidation, the movement can continue without pullbacks.

An alternative scenario implies the price-fixing below 104.82. In this case, the pair may decline to 104.40.

USD/JPY
There is no news feed for today.

The USD/CAD currency pair

Technical indicators of the currency pair:
  • Prev Open: 1.2776
  • Prev Close: 1.2781
  • % chg. over the last day: +0.04%

After a strong decline on Wednesday, the pair practically froze. Bullish and bearish factors put pressure on the instrument from both sides. On the one hand, the continuing rise in oil prices is driving the Canadian dollar up. On the other hand, the growth of the US dollar puts pressure on the quotes. In a situation like this, determining the main direction is difficult.

Trading recommendations
  • Support levels: 1.2737, 1.2686
  • Resistance levels: 1.2818, 1.2875

The main scenario is trading in a sideways range between 1.2818 and 1.2737. The ADX fell to the minimum values, while the MACD is close to zero. The price has stopped near the moving averages, which altogether gives a neutral signal.

Alternative scenario: if the price manages to gain a foothold above 1.2818, the pair may resume its growth to the resistance level of 1.2875. A breakthrough at the 1.2737 level could trigger a further decline.

USD/CAD
There is no news feed for today.

by JustForex


This article reflects a personal opinion and should not be interpreted as an investment advice, and/or offer, and/or a persistent request for carrying out financial transactions, and/or a guarantee, and/or a forecast of future events.

Gold poised to form a death cross

By Han Tan, Market Analyst, ForexTime

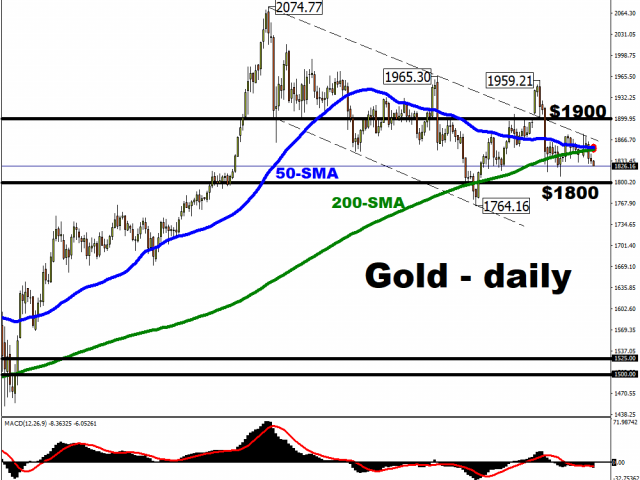
Spot gold’s 50-day simple moving average (SMA) is very close to crossing below its 200-day counterpart.

The last time we saw such a technical event, in June 2018, bullion fell by another 9 percent over the following two months. However, the precious metal then went on to climb by nearly 80 percent over the subsequent two years, a run that culminated in setting a new record high in August 2020.

Spot gold is now more than 11 percent lower from that record peak, and bulls must be frustrated at how 2021 has panned out so far.

Despite a breach of the psychologically-important $1900 mark at the onset of the year, it has failed to live up to its early promise so far, and is currently trading below its 200-day SMA.


Why has Gold failed to shine so far in 2021?

Gold has an inverse relationship with the US dollar, which means that when the dollar goes up, gold tends to go down (and vice versa).

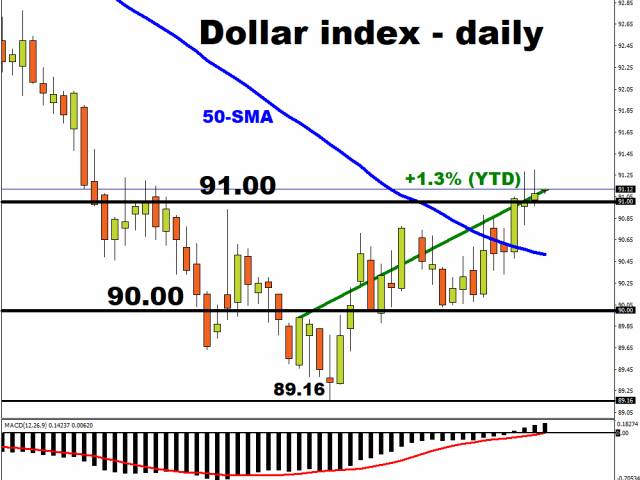
The greenback has so far defied the market consensus coming into 2021 that we would see a weaker dollar environment. Instead, the dollar index (DXY) is up 1.3 percent on a year-to-date basis, which has in turn heaped downward pressure on the precious metal.

Gold’s expected rise is based on these assumptions:

  1. More incoming US fiscal stimulus.
  2. More government spending to help the US economy recover from the pandemic would then boost the prices of goods and services.
  3. Faster inflation is then seen to erode the dollar’s purchasing power, which would translate into weakening demand for the greenback.
  4. Weaker dollar would then boost gold prices (due to that earlier-mentioned inverse relationship).


What’s the latest on the US fiscal stimulus that’s supposed to give bullion a boost?

Lawmakers are still wrangling over the total size of the economic support package, with the $1.9 trillion figure still being featured in the headlines. However, President Biden’s agenda is already facing stiff resistance from Republicans, who are angling for a smaller fiscal stimulus package.

The Republicans may have a stronger argument to make if the US economy can show signs of further improvements. Wednesday’s jobs data release by the ADP Research Institute showed that company payrolls increased by 174,000 in January, compared to the 70,000 figure expected by economists polled by Bloomberg.

That better-than-expected ADP number sets us up for a positive surprise in this Friday’s non-farm payrolls. Markets have already revised their NFP expectations upwards, from 70,000 to 100,000, since the ADP numbers were released.

A stronger than expected recovery in the US jobs market may prompt a dilution in the incoming fiscal stimulus package, and that narrative is now weakening the case for Gold bulls.

Such an outcome could see the $1800 psychologically-important mark beckoning closer for gold prices.


Disclaimer: The content in this article comprises personal opinions and should not be construed as containing personal and/or other investment advice and/or an offer of and/or solicitation for any transactions in financial instruments and/or a guarantee and/or prediction of future performance. ForexTime (FXTM), its affiliates, agents, directors, officers or employees do not guarantee the accuracy, validity, timeliness or completeness, of any information or data made available and assume no liability as to any loss arising from any investment based on the same.


Forex-Time-LogoArticle by ForexTime

ForexTime Ltd (FXTM) is an award winning international online forex broker regulated by CySEC 185/12 www.forextime.com

Biden Waves Off Republican Opposition

By Orbex

Weekly Strength for the Greenback

The dollar index rose for a fourth consecutive session, confirming its place above the 91 handle.

ADP figures showed that the US private sector increased by 174,000 jobs in January after shedding 78,000 in the prior month.

However, concerns remain in full force as economists warned a job market recovery is still a long way off.

Joe Biden and congressional Democrats are moving ahead with plans to pass a $1.9tn economic relief plan.

This decision is without significant support from Republican lawmakers, which could damage the bipartisanship pledged by the new administration after only two weeks in office.

Eurozone Inflation Back in Positive Territory

The euro fell 0.10% lower on Wednesday as it flirted with the 1.20 level.

After being in negative territory for the back end of 2020, consumer inflation jumped by much more than expected in January.

However, the ECB’s target of 2% inflation seems a long way off, as economists are predicting that core inflation will be stuck around 1% for the foreseeable future.

UK Passes Pandemic Peak

Sterling closed 0.20% lower yesterday as traders now look towards the 1.36 level.

PMI data pointed to the sharpest contraction in the services sector since May of 2020.

The impact of restrictions on trade and temporary business closures during the third national lockdown was the main factor.

This comes despite the UK apparently passing the peak in the current wave of the pandemic.

However, any hope of lifting restrictions was dashed by the Prime Minister, as he stated that infection levels were still very high.

Indices Open with Mixed Results

The major US indices closed indecisively on Wednesday as the Nasdaq led the way closing 0.55% higher. The Dow, however, ended the session 0.24 lower.

Shares of Google parent Alphabet hit new highs yesterday, rising nearly 8% after the company reported fourth-quarter earnings that surpassed analysts’ expectations.

It seems this earnings season keeps on giving.

Gold on the Decline

Gold closed 0.22% yesterday as it spends the majority of the week on the back foot.

A strong US dollar, combined with an upbeat tone to risk appetite that has seen stocks and crude oil make further upward strides, are both hurting demand for the yellow metal.

In addition, risk appetite continues to shift on mass vaccination headlines, and new data suggests encouragingly strong levels of efficacy amongst existing vaccine candidates.

Oil at Highest Level Since the Pandemic Began

WTI moved 1.61% higher yesterday, confirming a fourth consecutive rise for the black gold.

Upbeat data from the EIA showed that crude inventories fell by 1 million barrels last week.

In addition, the Administration expects total US energy consumption to return to 2019 levels by 2029, but also said that forecast is highly dependent on the pace of the economic recovery.

Will we now see a push for $60?

By Orbex

The ISM data cheered the dollar bulls. US Treasuries yield returned to 1.14%

by JustForex

On Wednesday, ISM pleased market participants with data from the service sector. Business activity accelerated growth to 58.7 in January from 57.7 in December last year, beating the market forecast of 56.8. The numbers point to the strongest growth in the services sector since February 2019. New orders showed the best dynamics (61.8 versus 58.6), and employment returned to growth after contraction (55.2 versus 48.7). On the other hand, production slowed down a bit (59.9 versus 60.5) and new export orders decreased (47 versus 57.3). Inflation in the sector remains high (64.2 vs. 64.4).

The Supply Management Institute’s comments indicate that the respondents are more optimistic about the business environment and the economy than a month ago. Various local and national COVID-19 restrictions continue to negatively impact companies and industries. Problems with manufacturing capacity and logistics continue to cause problems in the supply chain.

The market took the information positively. The US 10-year debt securities yield showed an immediate increase to 30 basis points to 1.40%. The dollar continued its upward correction.

Despite the rise in inflationary expectations, the 2-year bonds yield remains depressed. The indicators are near the December lows. Options to change the rates of the Fed still assume a small probability of further decline, completely excluding an increase until the end of the year. This moment is a bullish factor for the stock market, which continues to consolidate near its historic highs. Gold fell again to January lows ($1820) per troy ounce.

Main market quotes:

S&P 500 (F) 3,821.62 -1.98 (-0.05%)

Dow Jones 30,723.60 +36.12 (+0.12%)

DAX 13,963.90 +30.27 (+0.22%)

FTSE 100 6,522.55 +14.73 (+0.23%)

USD Index 91.338 +0.236 (+0.26%)

Important events:
  • – UK Construction PMI (Jan) at 11:30 (GMT+2);
  • – Bank of England Interest Rate Decision (Feb) at 14:00 (GMT+2).

by JustForex


This article reflects a personal opinion and should not be interpreted as an investment advice, and/or offer, and/or a persistent request for carrying out financial transactions, and/or a guarantee, and/or a forecast of future events.

Have the rules changed for trading the US Dollar?

By Hussein Sayed, Chief Market Strategist (Gulf & MENA), ForexTime

Throughout the past several months, a risk rally ordinarily meant a weaker US Dollar. The DXY index, which measures the greenback’s value against a basket of six world currencies, slid 6.7% in 2020 recording its second worst annual performance since the global financial crisis. Global expansionary monetary and fiscal policies led by the US along with new record high equity markets swayed investors from the safety of the world’s reserve currency towards high beta emerging market and developed market currencies.

Factors that have dragged on the US currency since late March 2020 remain in play as monetary and fiscal policies are likely to stay loose throughout 2021. In fact, we are likely to get another bold Covid-19 relief package from the US, while low interest rates are going nowhere in the medium term. However, the dollar is up 1.5% year-to-date despite the massive, short speculative positions.

This recovery rally has caught many traders by surprise and some are questioning whether the rules have changed. Whether the dollar’s strength is to be short-lived or a longer-lasting theme remains to be seen. But fundamentals now appear to be on its side.

From an economic growth perspective, the US is in a better position than Europe. The extended lockdowns in several European economies will likely lead to negative growth in the first quarter of 2021, while Washington is moving fast towards stimulating the economy following four per cent growth in the final quarter of 2020. This narrative won’t change with the EU rolling out vaccines at a slower pace compared to the US.

US 10-year Treasury bond yields are back again near March 2020 highs having gained more than 13% from late January. The spread between US and German 10-year yields has been widening since early August and has now reached 159 basis points. Further extension suggests additional relative strength on the dollar’s side.

The US ADP employment report showed private payrolls increased 174,000 in January, after dropping 78,000 in December and came in well above expectations of 50,000. The service industry is also showing signs of recovery with the non-manufacturing ISM increasing to a two-year high at 58.7. The ISM index’s employment component reached an 11-month high of 55.2, indicating that vaccine distribution is playing a substantial role in boosting employers’ confidence.

If these two data releases are any guide, we would expect to see a positive surprise in Friday’s non-farm payrolls report. This release will be a crucial test for the US dollar to see whether it is genuinely reacting positively to strong data and vice versa.

Another interesting aspect to monitor is the daily chart on the dollar’s index. The DXY has completed an inverse head-and-shoulders pattern on the daily chart and broke above the neckline resistance of 91. Staying above this level for couple of more days suggests further gains towards 92.8.

Disclaimer: The content in this article comprises personal opinions and should not be construed as containing personal and/or other investment advice and/or an offer of and/or solicitation for any transactions in financial instruments and/or a guarantee and/or prediction of future performance. ForexTime (FXTM), its affiliates, agents, directors, officers or employees do not guarantee the accuracy, validity, timeliness or completeness, of any information or data made available and assume no liability as to any loss arising from any investment based on the same.


Forex-Time-LogoArticle by ForexTime

ForexTime Ltd (FXTM) is an award winning international online forex broker regulated by CySEC 185/12 www.forextime.com