
Article By RoboForex.com
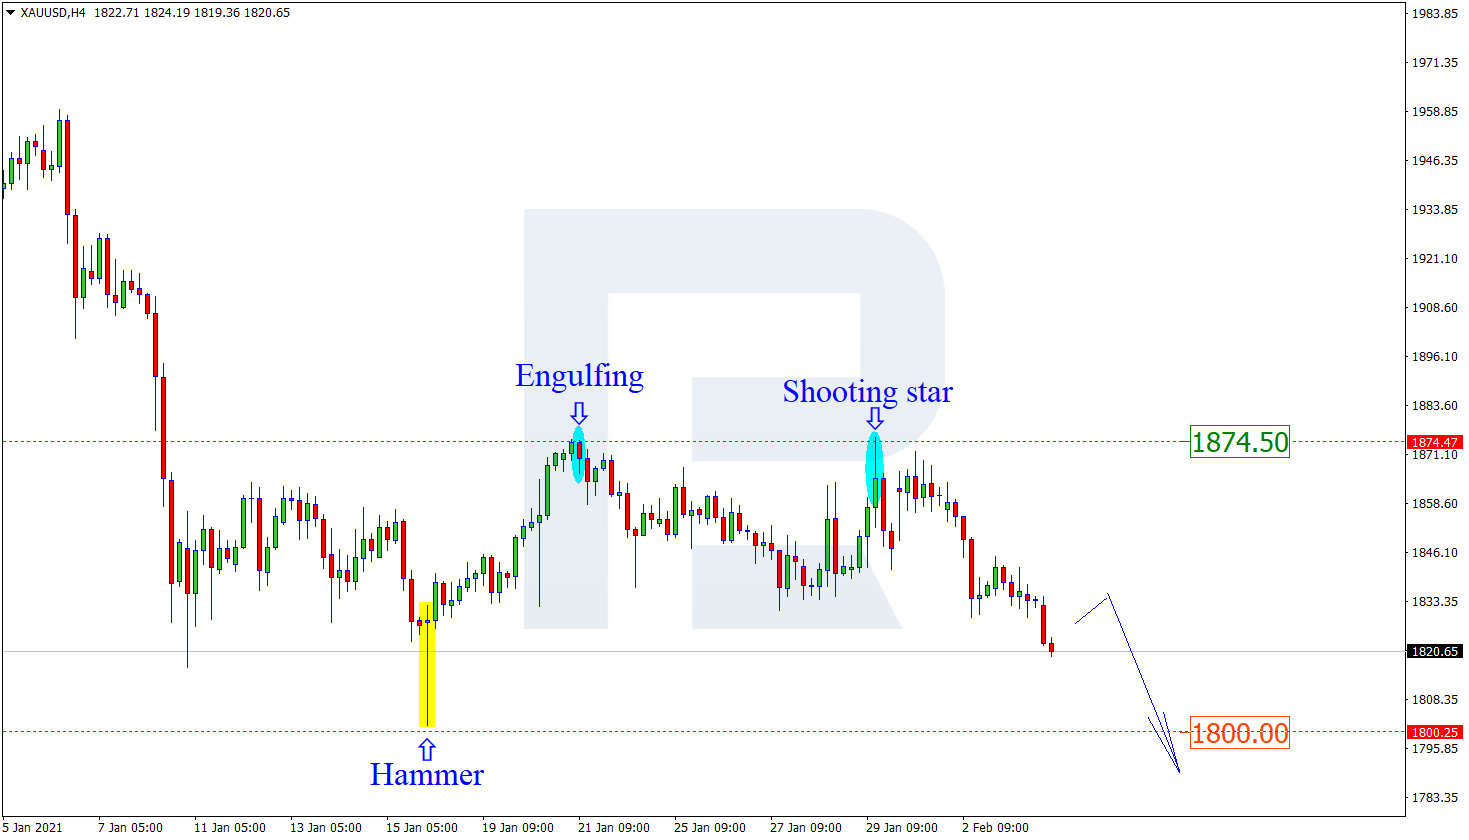
XAUUSD, “Gold vs US Dollar”
As we can see in the H4 chart, the metal is still trading downwards. Right now, after forming several reversal patterns, such as Shooting Star, close to the horizontal resistance level, XAUUSD is reversing and may resume falling towards the support area. In this case, the downside target will be at 1800.00. At the same time, an opposite scenario implies that the price may continue its growth towards 1874.00 before falling to reach the support area.

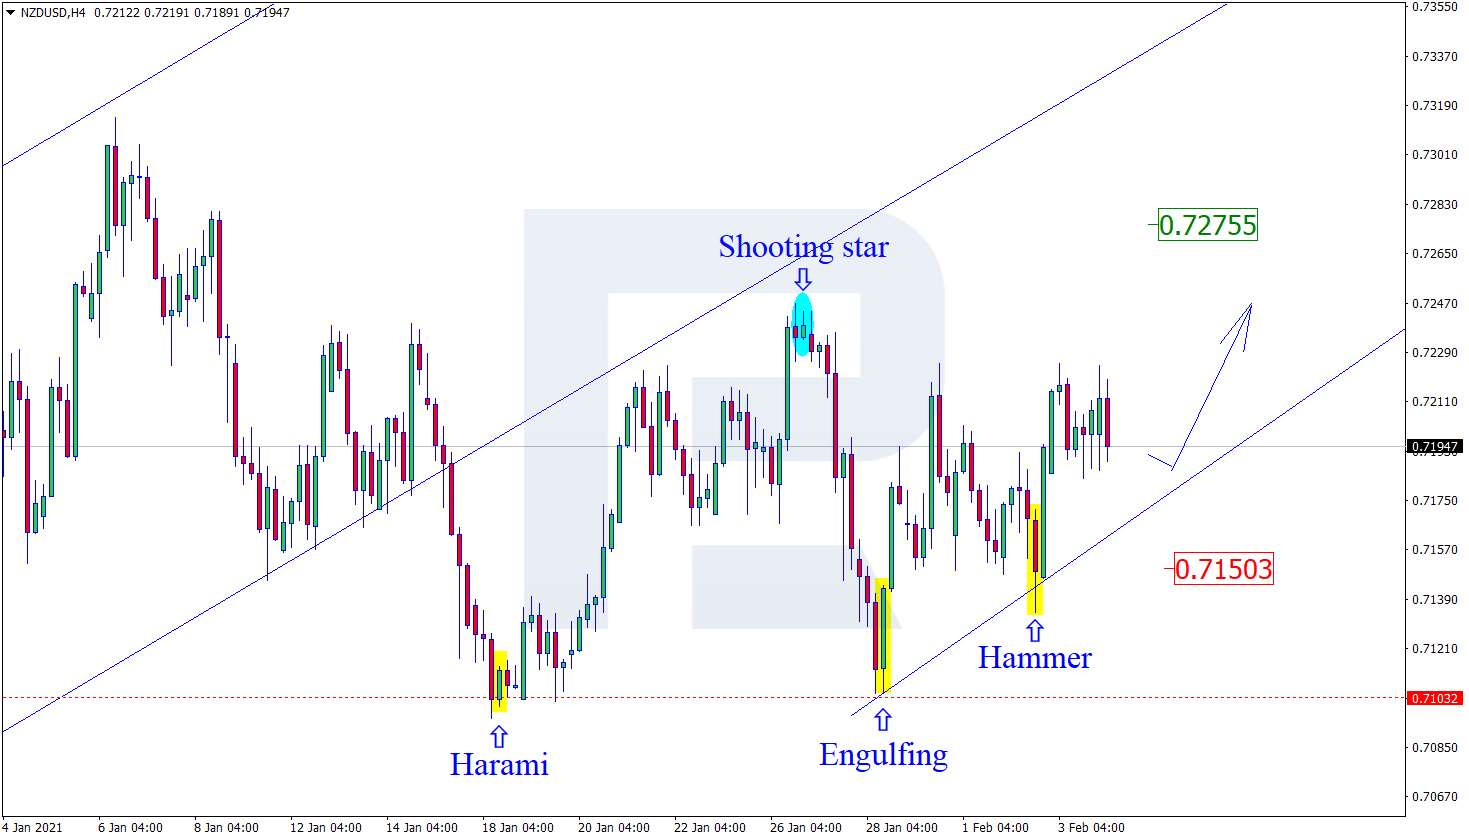
NZDUSD, “New Zealand vs. US Dollar”
As we can see in the H4 chart, the pair is still moving upwards. Right now, after forming several reversal patterns, such as Hammer, close to the support level, NZDUSD is reversing. Later, the asset may grow and reach the resistance area at 0.7275. However, an alternative scenario implies that the price may continue falling towards 0.7150 before resuming the ascending impulse.
Free Reports:
 Get our Weekly Commitment of Traders Reports - See where the biggest traders (Hedge Funds and Commercial Hedgers) are positioned in the futures markets on a weekly basis.
 Download Our Metatrader 4 Indicators – Put Our Free MetaTrader 4 Custom Indicators on your charts when you join our Weekly Newsletter
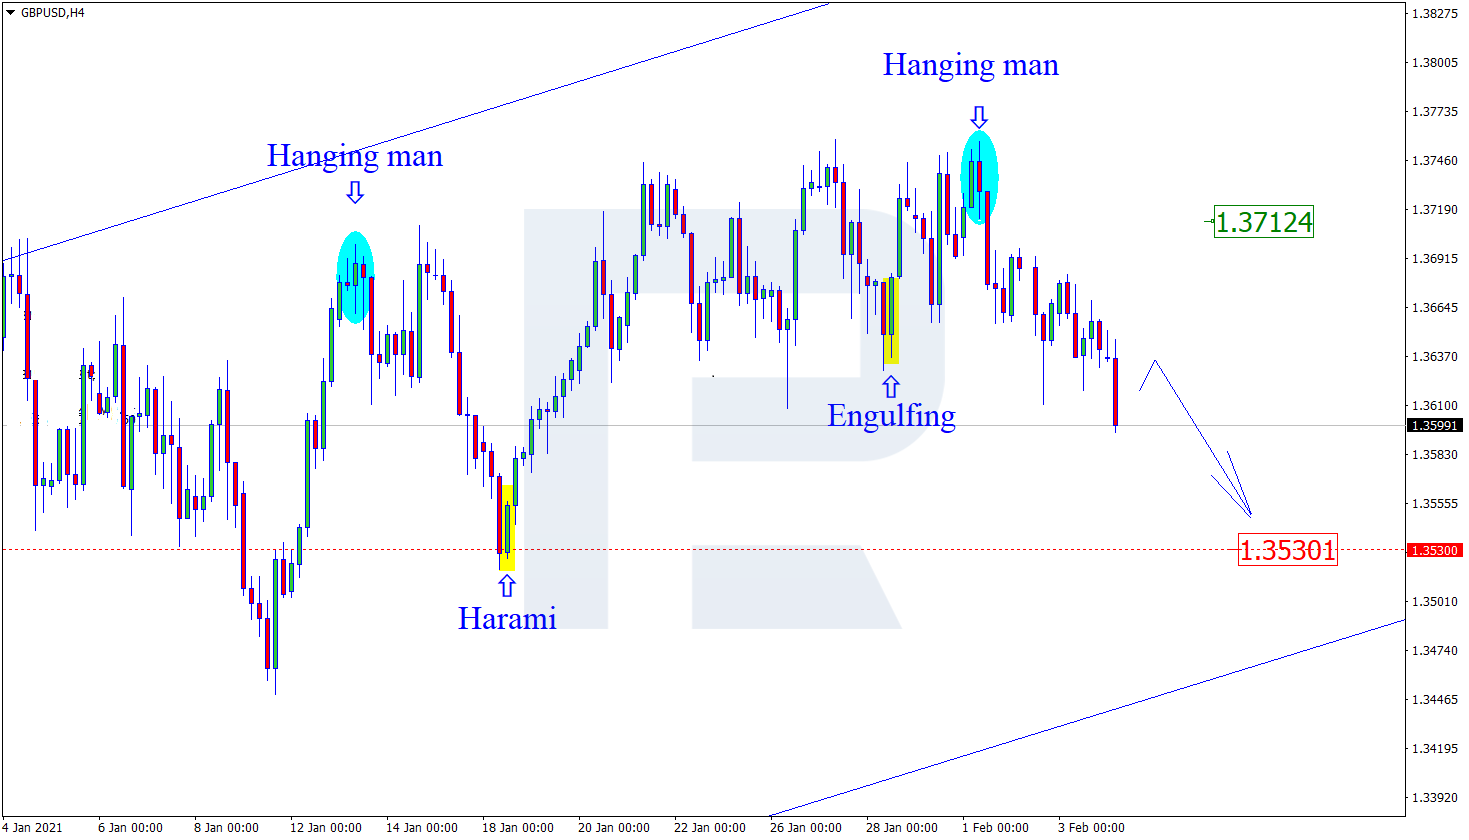
GBPUSD, “Great Britain Pound vs US Dollar”
As we can see in the H4 chart, the downtrend continues. Right now, after forming a Hanging Man pattern not far from the resistance area, GBPUSD is reversing. In this case, the downside target is the support level at 1.3530. After that, the instrument may correct to the upside from the support area and then resume moving downwards. Still, there might be an alternative scenario, according to which the asset may correct to reach 1.3712 before resuming its decline.
Article By RoboForex.com
Attention!
Forecasts presented in this section only reflect the author’s private opinion and should not be considered as guidance for trading. RoboForex LP bears no responsibility for trading results based on trading recommendations described in these analytical reviews.

- The US Tech sector hit by sell‑off. Oil prices decline on renewed negotiations Jul 28, 2026
- Gold Declines, Focus on Fed and Falling Oil Prices Jul 28, 2026
- This week will be one of the most crowded for central‑bank meetings Jul 27, 2026
- EUR/USD Ahead of a Key Week: Holding Near Lows Jul 27, 2026
- COT Metals Charts: Weekly Speculator Changes led by Copper Jul 26, 2026
- COT Bonds Charts: Speculator Bets led by SOFR 3-Months & 5-Year Bonds Jul 26, 2026
- COT Energy Charts: Weekly Speculator Bets led by WTI Crude & Natural Gas Jul 26, 2026
- COT Soft Commodities Charts: Weekly Speculator Bets led by Corn & Soybeans Jul 26, 2026
- The US introduces new import tariffs for 60 countries. Brent crude surpasses $100 per barrel Jul 24, 2026
- USD/JPY Breaks Records: Nothing Slows the Yen’s Decline Jul 24, 2026