This “Lopsided” Stock Market Ratio Is Sending a Clear Signal

Investors always find ways to “rationalize” bearish or bullish stances

By Elliott Wave International

For a stock market investor who understands that markets are not random or chaotic but instead patterned, the most important information to know is the price pattern of the market in question.

For an Elliott wave investor, the task is even more defined. As Frost & Prechter’s Wall Street classic book, Elliott Wave Principle, says:

The market’s progression unfolds in waves. Waves are patterns of directional movement.

So, familiarity with the Elliott wave model for forecasting financial markets is a must.

Another key factor in analyzing the stock market is sentiment. The reason why is because when bullish or bearish sentiment reaches an extreme, financial history shows that a “tipping point” — in the opposite direction — is usually just around the corner.

With that in mind, let’s review a chart and commentary from the April 7 U.S. Short Term Update, an Elliott Wave International thrice weekly publication which provides near-term forecasts for major U.S. financial markets:

Investment advisors are lopsidedly bullish … as shown on this chart of the Investors Intelligence bull/bear ratio, which pushed to 3.64 last week. At the end of the previous [downward Elliott wave] the ratio was 0.72:1, with more bears than bulls. Investors herd. They become more bearish when the trend is declining and more bullish when the trend is rising. All “reasons” that are offered as to why they are becoming more bearish or bullish are just rationalizations. …

As an example, consider this March 31 Business Insider headline:

Stocks are expensive and retail inflows are soaring, but Goldman Sachs says history shows the market is not in a bubble

Hmm — if stocks are expensive and the public is investing like there’s no tomorrow, isn’t that the definition of a frothy market — i.e., a bullish extreme in the sentiment?

An April 6 Marketwatch article cited $5.3 trillion in COVID economic stimulus, an economic organization’s doubling of its projections for U.S. GDP growth and a strong March jobs report. It then followed by saying:

What this means is that the U.S. market is poised to outperform other major stock markets in the 2020s just as it did in the 2010s … .

The U.S. market might outperform major European or other stock markets around the globe for the remainder of the decade. Yet, the point is that “reasons” can always be found to support a particular stock market sentiment.

Yes, knowledge of sentiment extremes often serves as a red flag that a change of trend may be at hand.

Yet, as said, it’s also important to focus on the market’s wave pattern.

As Frost & Prechter’s book, Elliott Wave Principle: Key to Market Behavior, says:

The Wave Principle often indicates in advance the relative magnitude of the next period of market progress or regress. Living in harmony with those trends can make the difference between success and failure in financial affairs.

If you’d like to read the entire online version of the book, you can do so for free.

That’s right — all that’s required for free access to this Wall Street classic is a Club EWI membership. Club EWI is the world’s largest Elliott wave educational community with about 350,000 members and is free to join. When you join Club EWI, you are instantly granted free access to a treasure trove of Elliott wave resources on investing and trading.

Just follow this link to get started: Elliott Wave Principle: Key to Market Behavior — free and unlimited access.

This article was syndicated by Elliott Wave International and was originally published under the headline This “Lopsided” Stock Market Ratio Is Sending a Clear Signal. EWI is the world’s largest market forecasting firm. Its staff of full-time analysts led by Chartered Market Technician Robert Prechter provides 24-hour-a-day market analysis to institutional and private investors around the world.

Stocks take a flesh wound

By Lukman Otunuga Research Analyst, ForexTime

The seemingly unending rise of global stock markets has suffered consecutive days of losses, a jolt to the system for sure but it’s probably nothing to write home about. For sure, rising Covid-19 infection rates in places like India and Brazil are shocking, but stock markets generally are forward looking indicators so should ordinarily keep being pumped up by the extraordinary stimulus that abounds across the globe.

US stock futures are modestly in the green as reopening plays led the market lower overnight. The Vix index, a volatility measure that tracks movement in the S&P500 over the coming 30 days is pushing higher today once more, after hitting a 14-month low last week. But Wall Street’s fear gauge is still below 20 and only teetering on levels seen back in March.

Netflix takes a pounding

The streaming giant and in many ways, stay-at-home bell weather plunged nearly 10% in extended trading after subscriber additions fell way short of Wall Street estimates, as the demand boost from the pandemic started to fade. A delay to some of its big-name shows and films was blamed for adding just 3.98 million paid new customers against forecasts of 6.2 million.

Although the company posted better than expected earnings for the first quarter, there is much focus on the first of the FAANG stocks to report and those companies that might be at risk for slowing momentum as economies reopen.

EUR traders watching 1.20

The risk-off environment has helped the greenback over the past couple of sessions as the Covid contagion hotspots grab the headlines. Commodity currencies have been hurt but whether USD can sustain more gains is up for debate. US bond yields, a key driver of the dollar’s rise this year, are treading water around 1.56% while any stabilisation in sentiment should see a resumption of this month’s dollar decline.

EUR/USD is probably in a holding pattern now until the ECB meeting tomorrow, although no fireworks are expected from President Lagarde.

So, it is global risk sentiment which will determine if the euro can stay above 1.20 with yesterday’s shooting star and the 100-day moving average capping higher prices of the time being.

Disclaimer: The content in this article comprises personal opinions and should not be construed as containing personal and/or other investment advice and/or an offer of and/or solicitation for any transactions in financial instruments and/or a guarantee and/or prediction of future performance. ForexTime (FXTM), its affiliates, agents, directors, officers or employees do not guarantee the accuracy, validity, timeliness or completeness, of any information or data made available and assume no liability as to any loss arising from any investment based on the same.


Forex-Time-LogoArticle by ForexTime
ForexTime Ltd (FXTM) is an award winning international online forex broker regulated by CySEC 185/12 www.forextime.com

Canadian dollar bruised ahead of BoC decision

By Han Tan Market Analyst, ForexTime

Canadian Prime Minister Justin Trudeau has just announced that the country will keep its border restrictions intact for at least another month, until May 21. The decision was made as the country continues battling Covid-19, especially in Ontario, which is Canada’s largest province and home to some 14.7 million people.

The country recently had more new Covid-19 cases than the US for the first time since the pandemic hit. Ontario has been in a state of emergency since 8 April amid a third wave of cases. According to Bloomberg data, Canada has enough vaccines for almost 14% of its population, lagging behind the US and the UK which have enough to account for over 30% of their respective populations.

Trudeau’s announcement apparently prompted the knee jerk reaction in USDCAD. The pair has eased off since, pulling away from overbought territory on the hourly chart.


Zooming out to the daily chart, USDCAD has now breached its 50-day simple moving average (SMA) though remains unable to breach the 1.263 resistance level (as highlighted in Monday’s report) which has repelled any attempt by this pair to break higher since early March.


The recent drop puts the Canadian dollar in third place among the best-performing G10 currency against the US Dollar so far this year. The Norwegian Krone is still in first place, while the British Pound overtook the loonie in second place this week. Also on a year-to-date basis, the Canadian dollar had strengthened against all G10 currencies except for the NOK and the GBP.

However, the CAD has weakened against all of its G10 peers on a month-to-date basis.


From a fundamental perspective, the Canadian dollar’s strength in Q1 had been fuelled by the robust recovery in Canada’s economy. The country added 303,100 jobs in March, which was three times more than market expectations, while also being about 17% higher than the jobs added in the month prior.

Canada’s economic fundamentals should be bolstered by the government’s recently-released budget; its first in two years. This past Monday, Prime Minister Trudeau released the government’s US$80.6 billion spending plan which would span the next three years, featuring over 200 new measures.

This prospects of increased spending, while noting Canada’s aim to keep its debt-to-GDP ratio in check, should also help the loonie take advantage of the softer greenback while keeping the overall downward trend in USDCAD intact.

Bank of Canada to make rate decision Wednesday

With the economy apparently on firmer footing, the Bank of Canada could announce the paring back of its weekly bond purchases, from the current rate of C$4 billion down to C$3 billion, and may even comment about a potential rate hike sooner than 2023.

Should that happen, that could drive up Canada’s government bond yields even higher, which may then serve as a tailwind for the CAD. Such commentary could move USDCAD back below its 50-SMA and closer towards the 1.247 mark.

However, should the BOC adopt a dovish tone in light of Covid-19’s resurgence within its borders, that could surprise markets and trigger another round of weakness in CAD.

Such a dovish surprise could see USDCAD climb towards its 100-SMA and possibly even test the 1.2690 resistance line.


Disclaimer: The content in this article comprises personal opinions and should not be construed as containing personal and/or other investment advice and/or an offer of and/or solicitation for any transactions in financial instruments and/or a guarantee and/or prediction of future performance. ForexTime (FXTM), its affiliates, agents, directors, officers or employees do not guarantee the accuracy, validity, timeliness or completeness, of any information or data made available and assume no liability as to any loss arising from any investment based on the same.


Forex-Time-LogoArticle by ForexTime

ForexTime Ltd (FXTM) is an award winning international online forex broker regulated by CySEC 185/12 www.forextime.com

Declines in the US dollar boost gold

By Admiral Markets 

– In March we noted that the strength of the US dollar and US bond yields were negatively affecting the price of gold. However, during the last few sessions we have seen that this pressure is now easing. Bond yields are falling and, after several weeks of rises in the dollar index, it is now experiencing a pullback that has taken it back to the lower band of its channel after facing its 200 session average which acts as the main resistance level and briefly surpassing the upper band of the bullish channel.

Source: Admirals (formerly Admiral Markets) MetaTrader 5 – US Dollar Index Daily Chart. Date Range: 17 December 2019 – 19 April 2021. Date Captured: 19 April 2021. Past performance is not necessarily an indication of future performance.

Price evolution of the last five years:

  • 2020: -6.42%
  • 2019: 0.34%
  • 2018: 4.26%
  • 2017: -10.22%
  • 2016: 3.59%

As we can see below, the correlation between the dollar index and gold is negative. This implies that declines in the US dollar benefit the price of gold as investors stop seeking refuge in the US currency and turn their attention towards gold.

Source: Admirals MetaTrader Supreme Edition Add-on – Correlation Matrix


Gold Analysis

As we have mentioned in previous analyses, during the first part of 2020 gold was one of the best performing assets in the market, experiencing a rise of more than 25% that took it to 2,089 dollars per ounce. But after reaching this high at the beginning of August, the price began falling within the bearish channel until it reached the key support in the area coinciding with the lower red band around 1,675 dollars and the 61.8% fibonacci retracement level of the previous uptrend.

At this last support level, gold has recovered after making a double bottom formation that has led it, not only to break above its 18-session and 40-session moving average, but also to overcome both its previous support level in red and its important resistance represented by the trend line or upper band of the bearish channel, leading the price to confront its 200-session average.

The break of this level could trigger a strong bullish momentum that would lead the price to break above its next resistance level. This would open the door for the precious metal to seek levels not seen since the beginning of the year. Therefore, it is very important that we keep an eye on the price’s behaviour in the coming sessions – as a failure in this attempt could cause gold to re-enter its bearish channel.

Source: Admirals MetaTrader 5 – Gold Daily Chart. Date Range: 17 December 2019 – 19 April 2021. Date Captured: 19 April 2021. Past performance is not necessarily an indication of future performance.

Price evolution of the last five years:

  • 2020: 21.86%
  • 2019: 15.45%
  • 2018: -3.22%
  • 2017: 12.75%
  • 2016: 10.12%


Brent Analysis

As we can see in the weekly chart, after reaching a low of 15.32 dollars per barrel in March 2020, Brent has experienced a strong recovery following a bullish channel that has led it to reach a high of 72.03 dollars per barrel in just one year in the area close to the blue band.

After this high, the price started a pullback that led it to lose 10 dollars per barrel and, after several hesitant weeks characterised by a rather sideways price movement, last week the price ended at 66.75 dollars after rising by 5.82% per week. This initial rise was driven mainly by optimism related to the economic recovery in the United States and after good GDP data was published in China. As always, we will have to keep an eye on the evolution of the pandemic in Europe and the vaccination process, as perceived problems persist with the AstraZeneca and Janssen vaccines.

Technically speaking, the price is continuing in a very similar situation to that of the last few weeks, confirming the sideways consolidation movement of the price in the middle zone of its channel. As long as it maintains its main support levels at its 18 session average and the 60 dollar level, sentiment will remain positive as we are gradually coming out of the accumulated overbought levels. The loss of support would open the door to look for the lower band of the bullish channel.

Source: Admirals MetaTrader 5 – Brent Weekly Chart. Date Range: 3 August 2014 – 19 April 2021. Date Captured: 19 April 2021. Past performance is not necessarily an indication of future performance.

Price evolution of the last five years:

  • 2020: -21.52%
  • 2019: 22.68%
  • 2018: -19.55%
  • 2017: 17.69%
  • 2016: 52.41%

With Premium Analytics from Admirals, you can follow all the important news related to gold or oil and get the latest macroeconomic data through the news and economic calendar provided by Dow Jones:

Depicted: Admirals Premium Analytics Portal


Furthermore, with a Trade.MT5 account from Admirals, you can trade Contracts For Difference (CFDs) on gold, Brent crude and many other instruments!

In addition, with the Admirals Trade.MT5 account, you can trade Contracts for Difference (CFDs) on Gold, Brent and many more instruments. CFDs allow traders to try and profit from bull and bear markets, as well as the use of leverage. Click on the banner below to open an account today:

Trade With MetaTrader 5

INFORMATION ABOUT ANALYTICAL MATERIALS:

The given data provides additional information regarding all analysis, estimates, prognosis, forecasts, market reviews, weekly outlooks or other similar assessments or information (hereinafter “Analysis”) published on the websites of Admiral Markets investment firms operating under the Admiral Markets trademark (hereinafter “Admiral Markets”) Before making any investment decisions please pay close attention to the following:

  1. This is a marketing communication. The content is published for informative purposes only and is in no way to be construed as investment advice or recommendation. It has not been prepared in accordance with legal requirements designed to promote the independence of investment research, and that it is not subject to any prohibition on dealing ahead of the dissemination of investment research.
  2. Any investment decision is made by each client alone whereas Admiral Markets shall not be responsible for any loss or damage arising from any such decision, whether or not based on the content.
  3. With view to protecting the interests of our clients and the objectivity of the Analysis, Admiral Markets has established relevant internal procedures for prevention and management of conflicts of interest.
  4. The Analysis is prepared by an independent analyst, Roberto Rojas (analyst), (hereinafter “Author”) based on their personal estimations.
  5. Whilst every reasonable effort is taken to ensure that all sources of the content are reliable and that all information is presented, as much as possible, in an understandable, timely, precise and complete manner, Admiral Markets does not guarantee the accuracy or completeness of any information contained within the Analysis.
  6. Any kind of past or modeled performance of financial instruments indicated within the content should not be construed as an express or implied promise, guarantee or implication by Admiral Markets for any future performance. The value of the financial instrument may both increase and decrease and the preservation of the asset value is not guaranteed.
  7. Leveraged products (including contracts for difference) are speculative in nature and may result in losses or profit. Before you start trading, please ensure that you fully understand the risks involved.

By Admiral Markets

What To Expect Out Of Bank Of Canada Interest Rate Decision

By Orbex

There is an increasing consensus that we will get some action out of the BOC following their interest rate decision tomorrow.

Of course, it’s too soon to expect a change in the interest rate. So, there is a unanimous agreement that rates will stay at 0.25%.

But, the market understood that the BOC has taken a more hawkish tone after the last meeting when they raised their forecast for economic growth. The bank has repeated a line that a lot of other central banks have said: that inflation is expected to rise above the average, but then subside afterwards.

This is the justification for keeping rates low.

Turning to fiscal policy

Several analysts have pointed to stimulus for the Canadian economy shifting more towards government spending than monetary policy.

The government’s budget has increased substantially, and they project that the debt to GDP ratio will continue to increase this year. The Finance Minister, on the other hand, acknowledges that there is a limit to the amount of borrowing they can do.

In this context, the expectation is for the BOC to announce the beginning of their taper. The current quantitative easing program is budgeted at CAD4.0B a week. There isn’t a firm consensus on how much the BOC will taper by.

Some analysts point to just a reduction of CAD1.0B a month. Some are predicting as much as CAD4.0B a month.

The market reaction

The purpose of asset purchases is to keep interest rates lower.

So, if the BOC begins to taper, we’d expect to see interest rates rising in general. However, the market has anticipated that a taper will happen and has already adjusted.

So, in the short term, if the BOC doesn’t deliver as much of a taper as expected, we could see a short-term drop in interest rates. However, that trend would be expected to adjust going forward.

Higher interest rates would likely translate into a stronger CAD, and the opposite for lower rates. So, the question is: where is the market position?

It appears that the bond markets are expecting an announcement of the CAD1.0B taper to reach CAD3.0B in three months. If the taper is more than that, we could see a stronger loonie.

And if the BOC doesn’t announce a taper, we’d probably see a weaker loonie.

The environment to predict a trend

Though it should be pointed out that there already is a bias towards the upside for the Canadian dollar.

Commodity prices remain high, and the vaccine rollout is going better than initially expected. The BOC and Canadian government both recently increased their economic forecasts for the year, expecting to avoid a second recession despite the recent lockdown in Ontario.

So, a larger taper than expected might be in line with the outlook, so will have a smaller impact on the markets.

That said, if the BOC doesn’t taper, it might come as a shock to the system. They are already cutting back on their holdings, even though they haven’t officially announced a policy change.

By Orbex

China’s record first quarter fuels strong expansion in 2021

By Dan Steinbock

– China’s 1st quarter record performance will accelerate momentum in China and support recovery in the US and global economic prospects – as long as unwarranted geopolitical tensions remain in check.

A year ago, China’s first quarter plunge was -6.8 percent, due to the pandemic effect. In the West, it was widely seen as the “end of China’s growth story.”

Instead, in early February 2020 I predicted a turnaround in the increase of new virus cases in China, with the beginning of the economic rebound in the second quarter. Following the 6.5 percent expansion in the fourth quarter of 2020, the GDP rose to a record 18.3 percent year-on-year in the past quarter.

Obviously, the performance benefited from the base effect, due to the pandemic plunge a year ago. Nonetheless, it reflects a strong impetus for normalization.

Expansive momentum from manufacturing to services

The strategic rebound effort began with supply-side expansion. Now it is broadening, thanks to improving domestic demand and higher exports.

All major indicators are already above the pre-crisis level. The Purchasing Managers’ Index (PMI) has grown 13 months in a row. Production of machineries and health care-related products continue to show strong growth.

As the supply-side performance is driving turnaround in consumption, even the services PMI has been expanding almost a year.

With the easing of social distancing, retail sales, which have been expanding for 8 months, are likely to strengthen. Due to new variants and lingering pandemic waves in many parts of the world, international travel restrictions are likely to foster domestic spending in the Chinese mainland.

After the severe pandemic-induced economic plunge, the international auto sector is recovering with US retail sales at 26 percent in the first quarter. However, China’s auto production has increased for 12 months at over 40 percent year-on-year.

Exaggerated concerns over monetary tightening

Last year, Chinese performance relied on fiscal and monetary support, while a surge of debt sparked unease among some observers. With recovery, government authorities have urged banks to shun disproportionate lending growth.

Nonetheless, concerns over monetary tightening seem overblown.

In line with its normalization objectives, China’s central bank seeks to cool credit growth to preempt debt and financial risks. But it is moving cautiously not to disrupt the recovery.

Moreover, inflation has strengthened and been in positive territory since March.

Furthermore, China’s gradual financial integration with the global markets is supporting its domestic momentum.

Chinese government bonds attract diversifying foreign investors

In particular, Chinese government bonds (CGBs) are growing in popularity across global fixed income portfolios. In just two years, foreign holdings of CGBs have nearly doubled to almost $310 billion.

Despite US government’s efforts at China’s geopolitical containment, US investors seek steadiness and diversification through CGBs’ high and stable yield. Chinese 10-year bonds have yields over 3.2%, while the U.S. 10-year Treasury yield is at 1.7%.

And this is just a prelude. Over the next 20 months, more than 360 onshore Chinese bonds will be added to major investment indexes tracked by global investors. The full inclusion is projected to attract around $150 billion of foreign inflows into China’s $13 trillion bond market; the third-largest in the world after the U.S. and Japan.

The huge inflows will support the yuan, even as China’s current account surplus is shrinking.

From exports and investment to innovation and consumption

With increasing investment by both private and state-owned enterprises, public investment will rise faster, thanks to the push under the 14th Five Year Plan.

Gradually, that investment will shift from manufacturing and real estate, which fueled China’s old growth model, toward research and development (R&D), as the new growth model takes hold. The latter, in turn, is accelerating, thanks to the rapid expansion of China’s Silicon Valley; the Greater Bay Area across Guangdong, Hong Kong, and Macao.

As China has begun the transition to higher value-added, parts of the cost-focused supply-chains in the Chinese mainland are relocating to Southeast Asia.

That is likely to boost regional integration under the Regional Comprehensive Economic Partnership (RCEP), which is a market-led regional win-win for economic development – despite ongoing geopolitical attempts to split Asia.

Global recovery or worldwide divisions

The key international uncertainty involves the question whether the US will put global interdependency – cooperation in climate change and international trade and investment – ahead the divide-and-rule geopolitics against multiple major economies.

The implications will not reverberate only outside America.

Economic instability and geopolitical tensions have potential to derail the Biden administration’s own domestic programs, which rely on huge debt-taking, multi-trillion-dollar stimulus packages, continual monetary easing; and what Democratic economist Paul Krugman has termed “super-core inflation amid a year of bottlenecks and blips.”

With progressive normalization and relative international stability, China’s expansion momentum will steady toward the end of the year, while the strong rebound will allow it to exceed the 2021 growth target of “above 6 percent.”

Even with moderation, growth is likely to exceed 6.5 percent and has potential up to 8.5 to 9.5 percent in 2021, with likely deceleration 6 percent or so in 2022.

Assuming peaceful evolution in Asia Pacific, China’s GDP is on track to surpass the US as the world’s largest economy in the late 2020s. That’s not away from the US. Thanks to global interdependency, such expansion can support both US and global economic prospects.

About the Author:

Dr. Dan Steinbock is an internationally recognized strategist of the multipolar world and the founder of Difference Group. He has served at the India, China and America Institute (USA), Shanghai Institutes for International Studies (China) and the EU Center (Singapore). For more, see https://www.differencegroup.net

The original version was published by China Daily on April 20, 2021

Fibonacci Retracements Analysis 20.04.2021 (EURUSD, USDJPY)

Article By RoboForex.com

EURUSD, “Euro vs US Dollar”

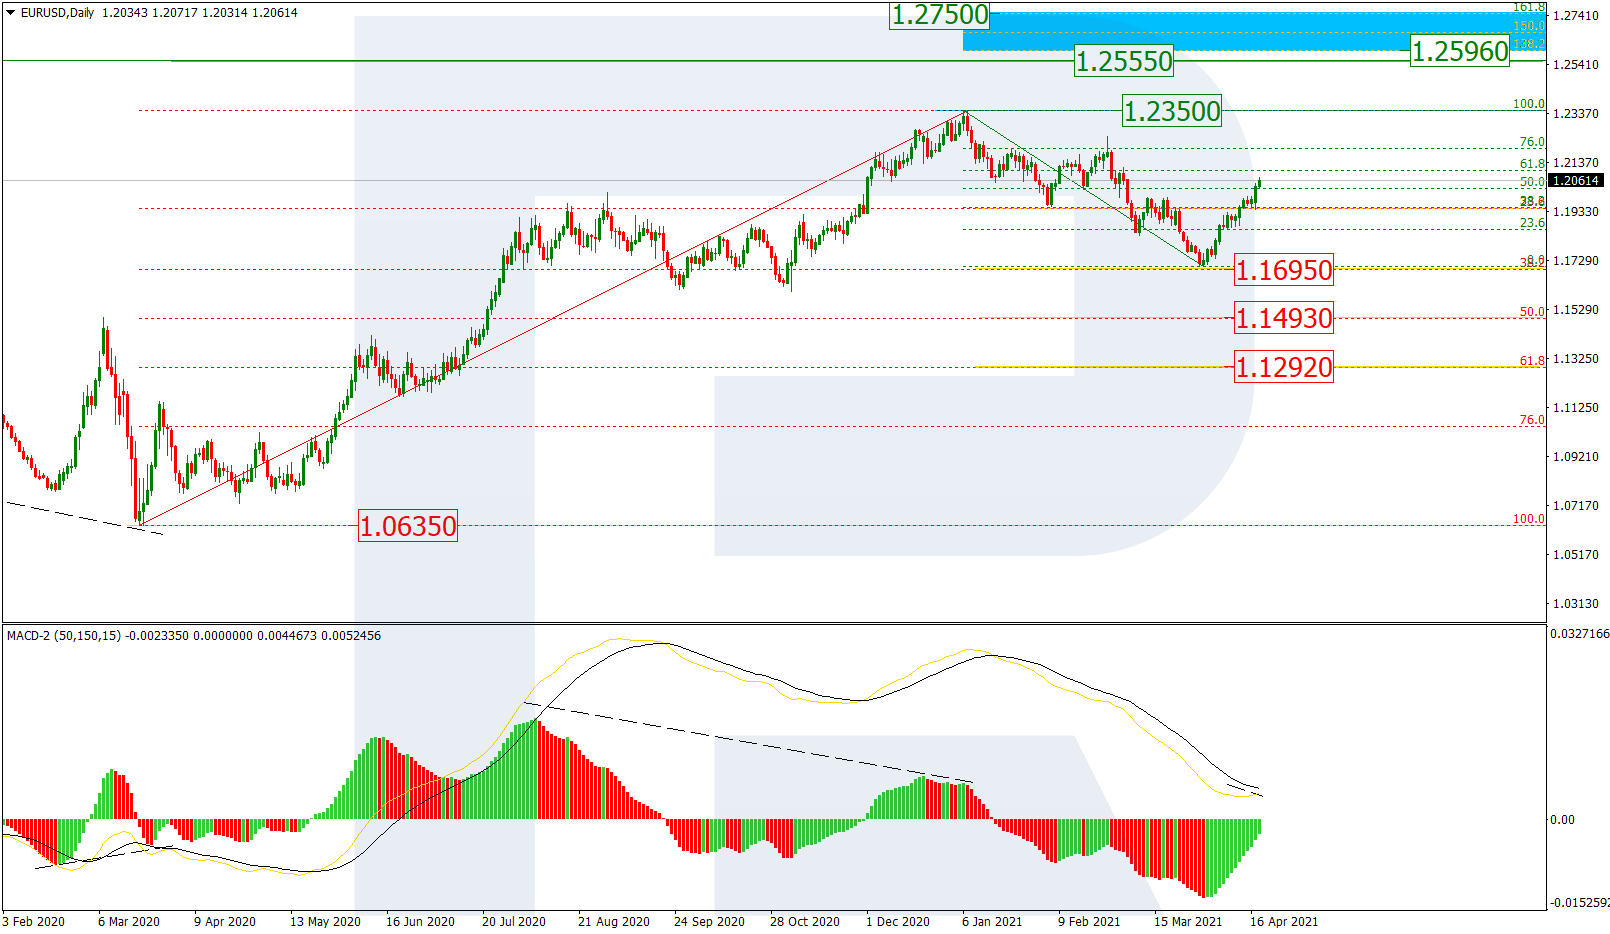
As we can see in the daily chart, after finishing the correctional decline at 38.2% fibo, the asset is forming a stable rising impulse, which may be considered as a new eave within the long-term uptrend. The closest upside target is the current high at 1.2350, a breakout of which may lead to a further uptrend towards the fractal at 1.2555 and the post-correctional extension area between 138.2% and 161.8% fibo at 1.2596 and 1.2750 respectively.

EURUSD_D1
Risk Warning: the result of previous trading operations do not guarantee the same results in the future

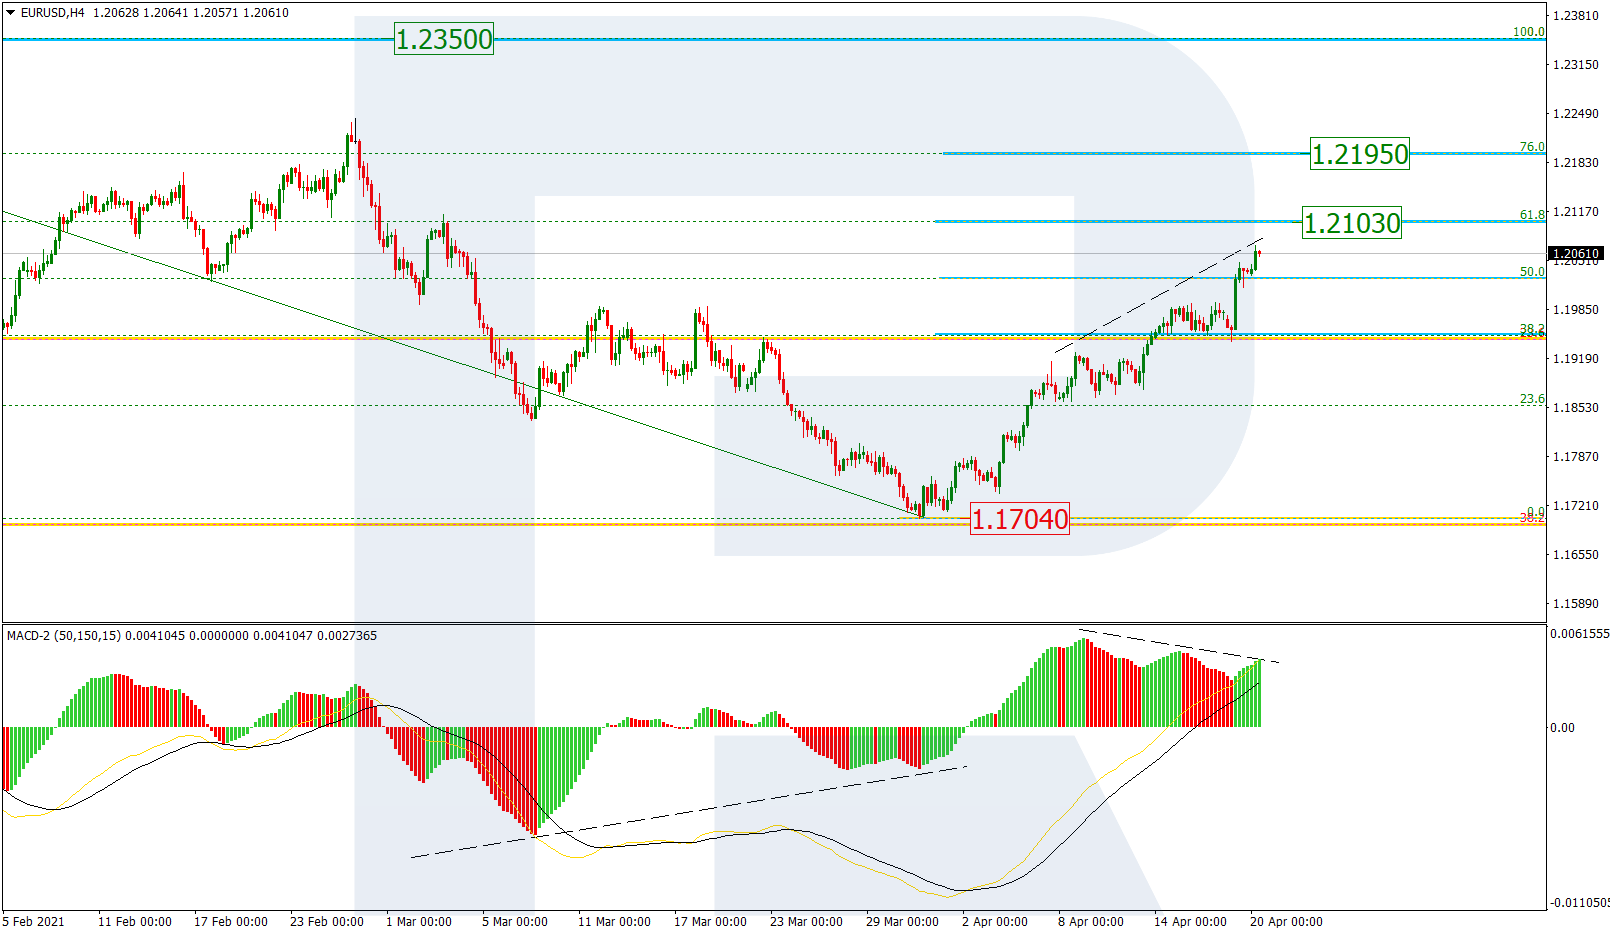
The H4 chart shows a more detailed structure of the current ascending wave. After breaking 50.0% fibo, the asset is approaching 61.8% fibo at 1,2103. Later, the market may continue growing to reach 76.0% fibo and the high at 1.2195 and 1.2350 respectively but a divergence on MACD may indicate a possible decline soon. If the pair breaks the low at 1.1704, the instrument may continue falling towards the mid-term 50.0% and 61.8% fibo at 1.1493 and 1.1292 respectively.

EURUSD_H4
Risk Warning: the result of previous trading operations do not guarantee the same results in the future

USDJPY, “US Dollar vs. Japanese Yen”

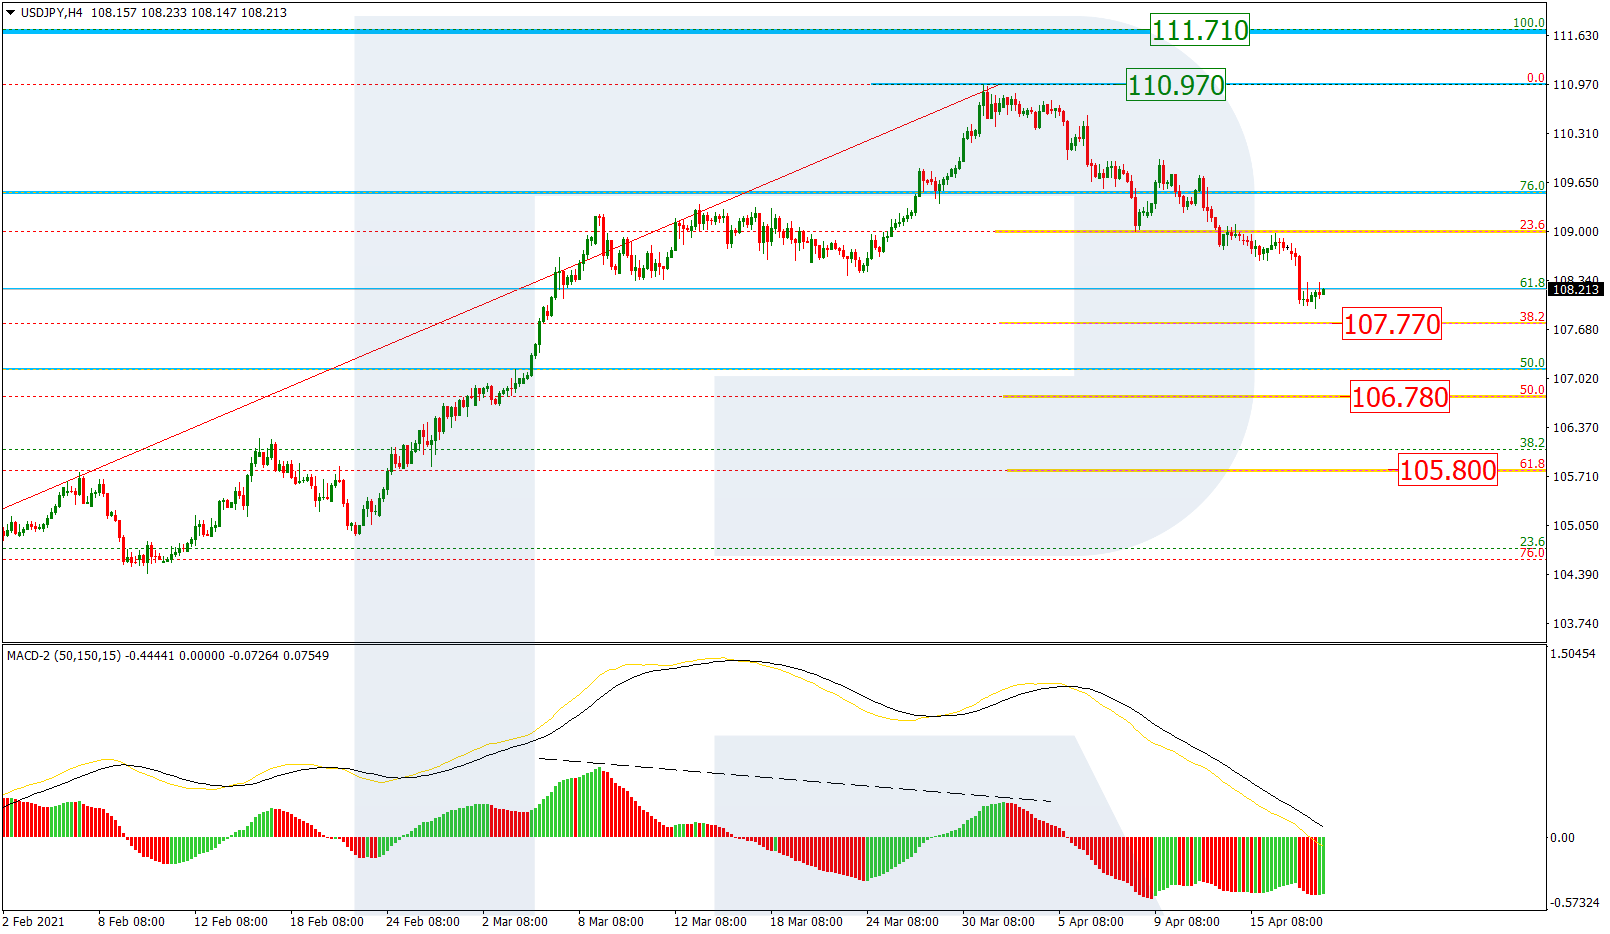
As we can see in the H4 chart, the pair is steadily correcting to the downside after a divergence on MACD. After testing 23.6% fibo, USDJPY is approaching 38.2% fibo at 107.77. the next downside targets may be 50.0% and 61.8% fibo at 106.78 and 105.80 respectively. Later, the market may complete the correction and start a new growth towards the high and the fractal high at 110.97 and 111.71 respectively.

USDJPY_H4
Risk Warning: the result of previous trading operations do not guarantee the same results in the future

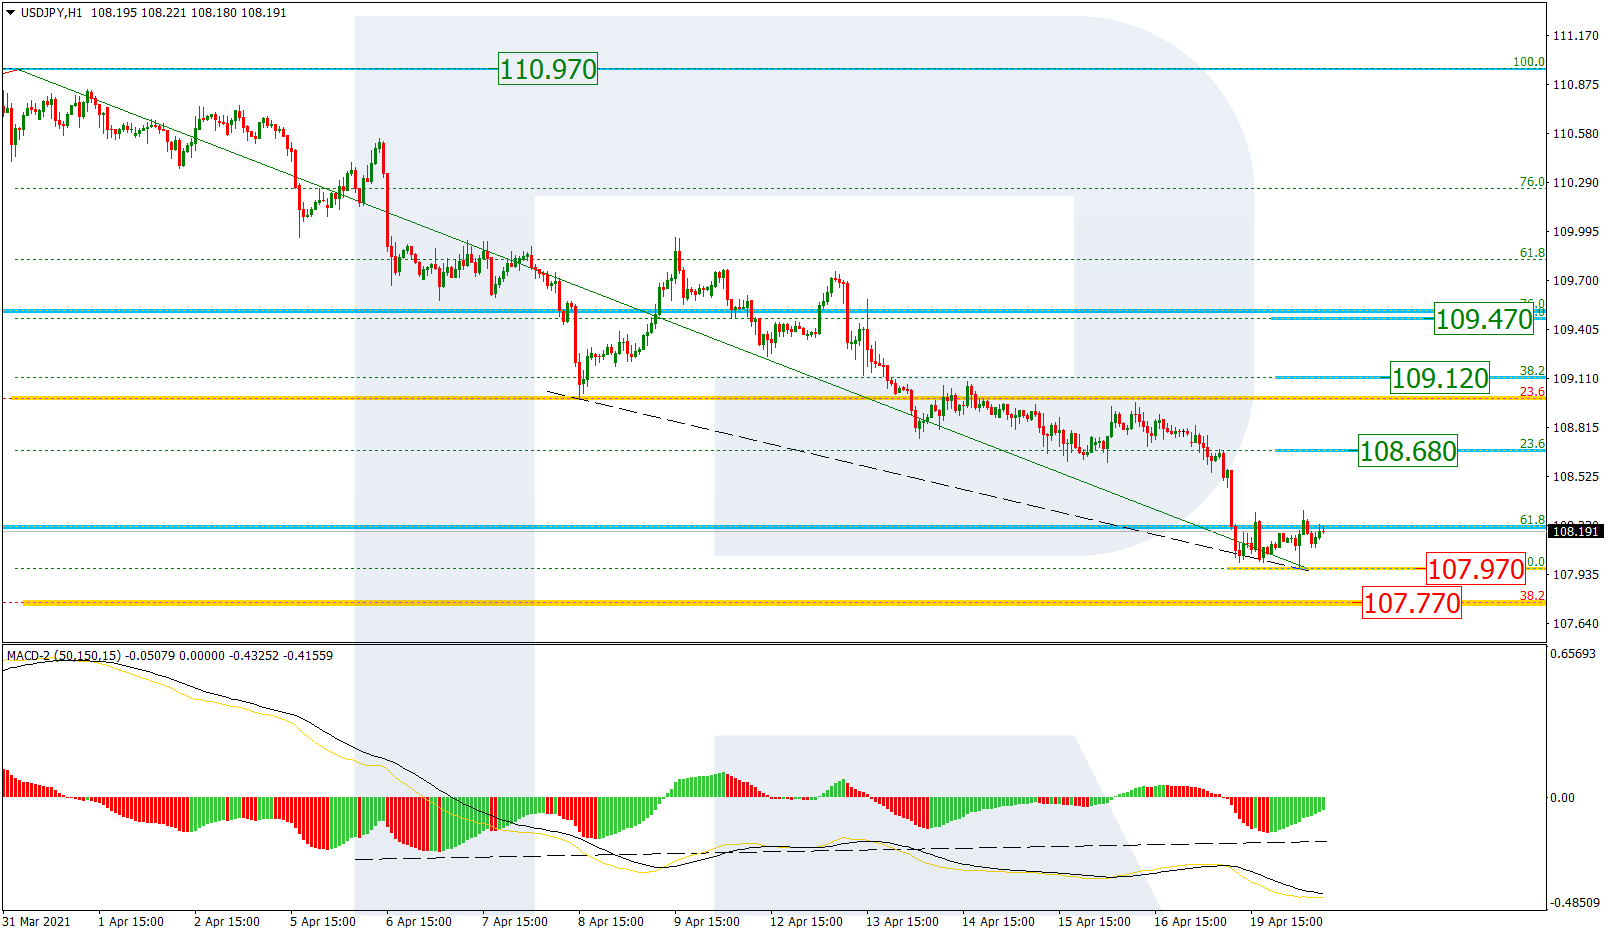
In the H1 chart, there is a convergence on MACD, which may indicate a possible reversal towards 23.6%, 38.2%, and 50.0% fibo at 108.68, 109.12, and 109.47 respectively.

USDJPY_H1

Article By RoboForex.com

Attention!
Forecasts presented in this section only reflect the author’s private opinion and should not be considered as guidance for trading. RoboForex LP bears no responsibility for trading results based on trading recommendations described in these analytical reviews.

Intraday Market Analysis – Recovery Momentum

By Orbex

EURUSD breaks above key resistance

eurusd

The euro recoups last month’s losses as traders reposition themselves for this week’s ECB meeting.

After a few days of consolidation under the key level of 1.1990 from the daily chart, the strong momentum above this resistance is a confirmation that buyers are in control of the price action.

1.2110 would be the next target as the pair makes its way back.

An overbought RSI may lead to a brief pullback. If so, the demand area between 1.1880 and 1.1940 may see strong buying interest.

USDJPY faces strong supply

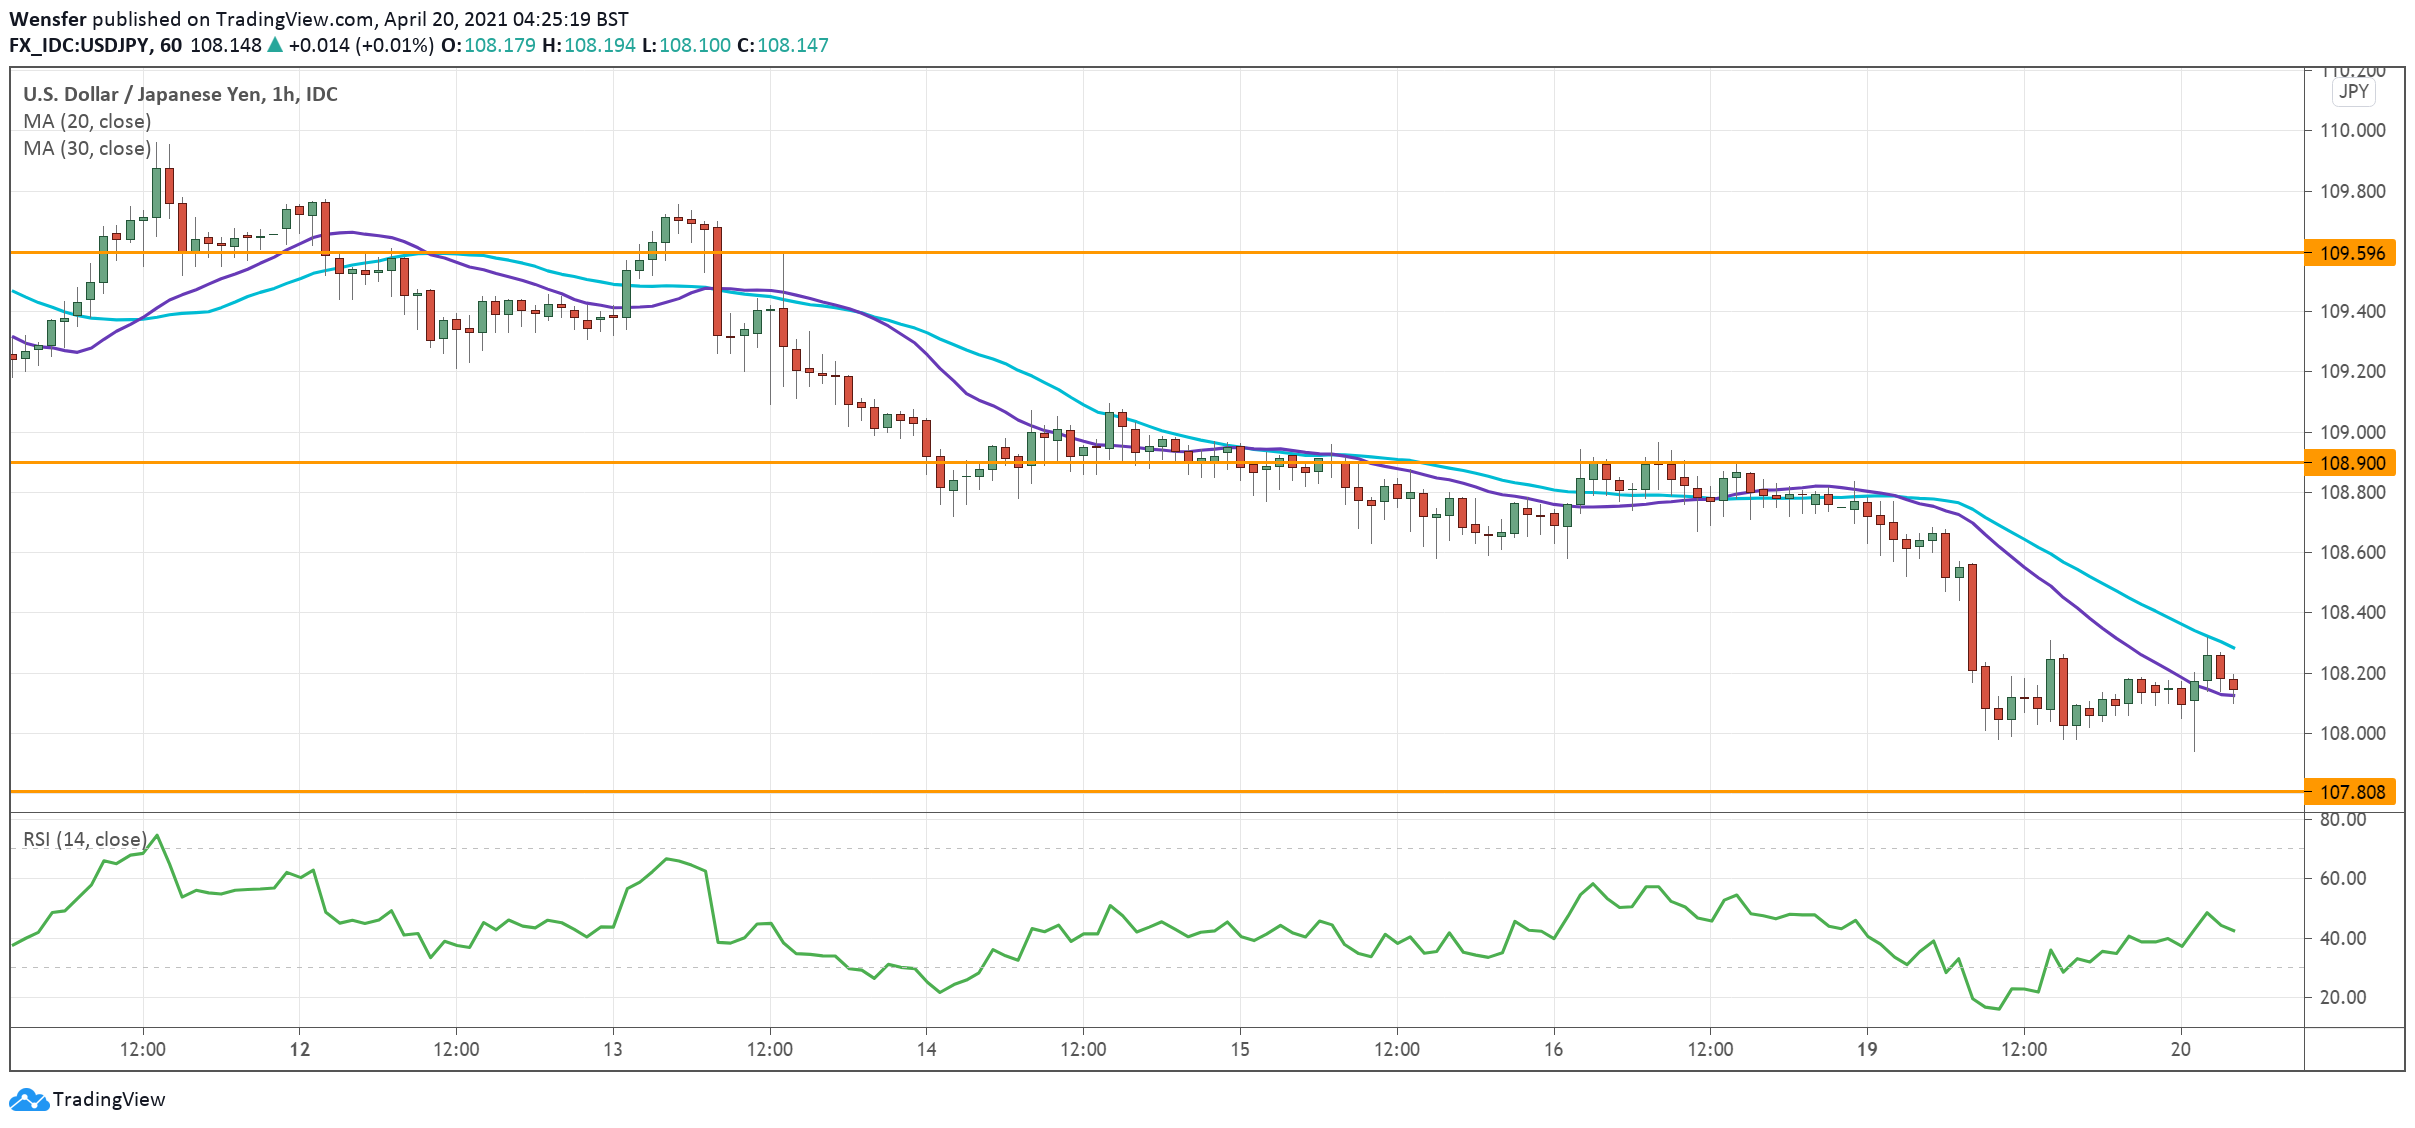
usdjpy

The market’s expectation of further falls in US Treasury yields keeps sending the greenback lower.

The pair’s successive breakouts below the daily moving averages and the critical support at 108.40 have triggered a new round of sell-off.

There is a chance of a rebound as traders take profit after the RSI went deeply into the oversold territory. Bears are likely to sell into strength in the supply zone around 108.90.

On the downside, 107.80 would be the next target as a continuation of the bearish momentum.

SP 500 tests rising trendline

sp500

Major stock indices stay high on hopes that the recovery is firmly on track. The S&P 500 has been grinding up along a rising trendline established earlier this month.

However, a double top in the RSI’s overbought area may temper buyers’ willingness to chase bids.

The trendline (4150) is the immediate support as the index makes a retreat. 4120 is a key level to keep the uptrend intact in the short term.

On the upside, the psychological level of 4200 could be the target as buyers push for a new record high.

By Orbex

The Analytical Overview of the Main Currency Pairs on 2021.04.20

by JustForex

The EUR/USD currency pair

Technical indicators of the currency pair:
  • Prev Open: 1.1972
  • Prev Close: 1.2036
  • % chg. over the last day: +0.53%

Yesterday, the EUR/USD currency pair was trading in a strong upward movement and closed the day with a result of +0.53%. On the H1 and H4 timeframes, the price is above the moving average. The MACD is in the positive zone. The upward movement is still possible.

Trading recommendations
  • Support levels: 1.2047, 1.1990, 1.1927, 1.1860, 1.1797, 1.1700
  • Resistance levels: 1.2100, 1.2242

The EUR/USD currency pair is showing a strong upward movement. We recommend looking for entry points to buy. It is best to look for entry points after the price corrects to the support level of 1.1990.

Alternative scenario: after the price breaks through and fixes below the level of 1.2047, it may go to the support level of 1.1990.

EUR/USD
There is no news feed for today.

The GBP/USD currency pair

Technical indicators of the currency pair:
  • Prev Open: 1.3818
  • Prev Close: 1.3985
  • % chg. over the last day: +1.20%

Yesterday, the GBP/USD currency pair was trading in an uptrend and closed the day with a result of +1.20%. On the hourly chart, GBP/USD is trading above the moving average MA (200). The situation is similar on the four-hour chart. The MACD indicator is in the positive zone on the H1. Based on the above, it is probably worth buying the asset.

Trading recommendations
  • Support levels: 1.3667, 1.3750, 1.3807,1.3917
  • Resistance levels: 1.4000

At the moment, the price has approached the resistance level – 1.4000. Only the purchase of an asset should be considered. It is best to look for entry points on the price correction to the 1.3917 level.

Alternative scenario: after the price breaks through and consolidates below the level of 1.3917, short positions to the level of 1.3800 should be considered.

GBP/USD
There is no news feed for today.

The USD/JPY currency pair

Technical indicators of the currency pair:
  • Prev Open: 108.76
  • Prev Close: 108.12
  • % chg. over the last day: -0.59%

Yesterday, the USD/JPY currency pair was trading in a downtrend and showed a change of -0.59%. On the H1 and H4 timeframes, the price is below the moving average, which tells us about the continuation of the downward movement. For now, it is worth sticking to the bearish trade.

Trading recommendations
  • Support levels: 107.00
  • Resistance levels: 108.60, 109, 109.75

While the price is below the moving average on the H1 timeframe, it is worth looking for entry points to sell the instrument. The main scenario is looking for a sell entry point after price correction to the level of 108.60.

Alternative scenario: if the price breaks through and consolidates above the level of 109.08, it is worth buying to the level of 109.75.

USD/JPY
There is no news feed for today.

The USD/CAD currency pair

Technical indicators of the currency pair:
  • Prev Open: 1.2502
  • Prev Close: 1.2529
  • % chg. over the last day: +0.21%

Yesterday, the USD/CAD currency pair was trading in the range of 1.2475 – 1.2545, showing an increase of 0.21%. At the moment, the currency pair is below the moving average, and the MACD indicator is in the negative zone. Based on the above, it is worth selling the instrument.

Trading recommendations
  • Support levels: 1.2475, 1.2364
  • Resistance levels: 1.2628, 1.2560

At this point, it is best to consider selling. The entry point should be sought after the price breaks through and consolidates below the level of 1.2475.

Alternative scenario: after breaking through and fixing above the level of 1.2560, you can open buy deals to 1.2628.

USD/CAD
There is no news feed for today.

by JustForex


This article reflects a personal opinion and should not be interpreted as an investment advice, and/or offer, and/or a persistent request for carrying out financial transactions, and/or a guarantee, and/or a forecast of future events.

Ichimoku Cloud Analysis 20.04.2021 (EURAUD, EURJPY, XAGUSD)

Article By RoboForex.com

EURAUD, “Euro vs Australian Dollar”

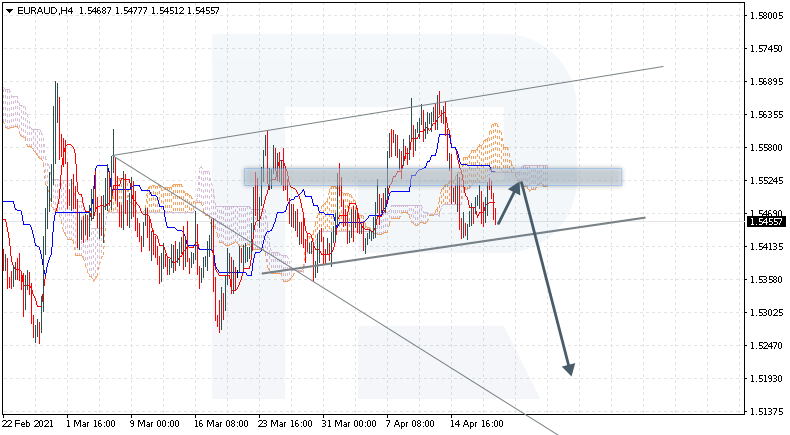
EURAUD is trading at 1.5455; the instrument is moving below Ichimoku Cloud, thus indicating a descending tendency. The markets could indicate that the price may test the cloud’s downside border at 1.5520 and then resume moving downwards to reach 1.5195. Another signal in favor of a further downtrend will be a rebound from the resistance level. However, the bearish scenario may be canceled if the price breaks the cloud’s upside border and fixes above 1.5575. In this case, the pair may continue growing towards 1.5665. To confirm further decline, the asset must break the neckline of a Head & Shoulders reversal pattern and fix below 1.5415. The pattern materialization target is at 1.5175.

EURAUD
Risk Warning: the result of previous trading operations do not guarantee the same results in the future

EURJPY, “Euro vs Japanese Yen”

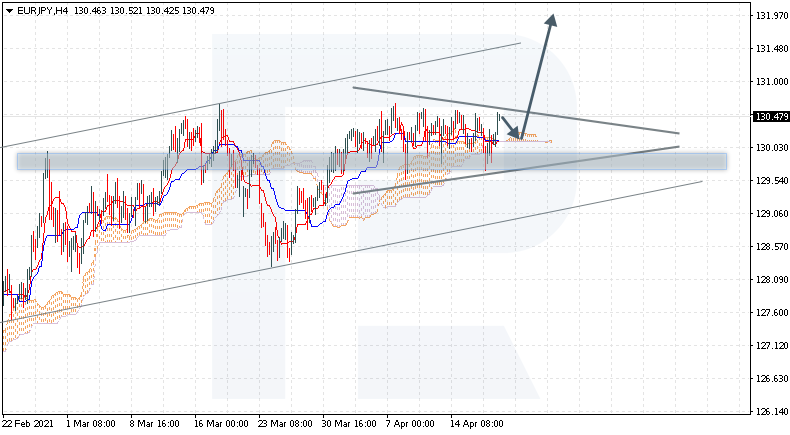
EURJPY is trading at 130.47; the instrument is moving above Ichimoku Cloud, thus indicating an ascending tendency. The markets could indicate that the price may test the cloud’s upside border at 130.10 and then resume moving upwards to reach 131.95. Another signal in favor of a further uptrend will be a rebound from the downside border of the Triangle pattern. However, the bullish scenario may no longer be valid if the price breaks the cloud’s downside border and fixes below 129.50. In this case, the pair may continue falling towards 128.65. To confirm further growth, the asset must break the pattern’s upside border and fix above 130.85. The pattern materialization target is at 131.35.

EURJPY
Risk Warning: the result of previous trading operations do not guarantee the same results in the future

XAGUSD, “Silver vs US Dollar”

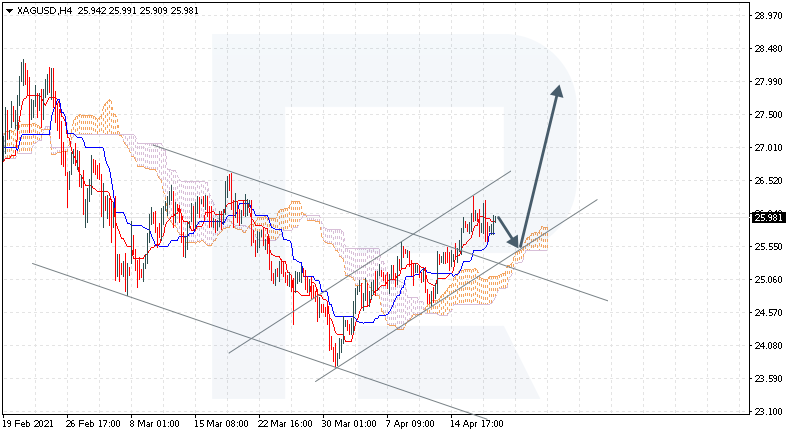
XAGUSD is trading at 25.98; the instrument is moving above Ichimoku Cloud, thus indicating an ascending tendency. The markets could indicate that the price may test the cloud’s upside border at 25.55 and then resume moving upwards to reach 27.95. Another signal in favor of a further uptrend will be a rebound from the rising channel’s downside border. However, the bullish scenario may no longer be valid if the price breaks the cloud’s downside border and fixes below 24.45. In this case, the pair may continue falling towards 23.55.

XAGUSD

Article By RoboForex.com

Attention!
Forecasts presented in this section only reflect the author’s private opinion and should not be considered as guidance for trading. RoboForex LP bears no responsibility for trading results based on trading recommendations described in these analytical reviews.