Important macroeconomic statistics for the U.S. and Canada are expected today. Volatility will increase sharply

by JustForex

U.S. indices rose yesterday amid the expectations of positive unemployment statistics, which will be published today. Investors are again actively investing in the stocks financial and industrial companies with large cap, as a result the Dow Jones index is much stronger than other American indices.

European indices also followed the uptrend. Economic statistics in Europe are good – retail sales are rising faster than expected and manufacturing orders in Germany have doubled. Considering the US Treasury Department planning to redeem about $502 billion of Treasury bonds over the quarter, this situation will allow the euro to take a medium-term upward trend.

The situation on the oil market remains the same. OPEC+ countries have planned to increase oil production, but amid the raging coronavirus in Asia, there are concerns that demand for oil products may fall.

The gold price returned above $1800 per troy ounce, but analysts believe that the “yellow metal” will not be able to keep upward momentum, as it reflects fears about inflation in the US with a big delay.

Siemens AG, BMW AG, AbbVie Inc, Cigna Corp, Enbridge Inc. и Colgate-Palmolive Co. are reporting for Q1 2021 today.

Main market quotes:

S&P 500 (F) 4,201.62 +34.03 (+0.82%)

Dow Jones 34,548.53 +318.19 (+0.93%)

DAX 15,196.74 +25.96 (+0.17%)

FTSE 100 7,076.17 +36.87 (+0.52%)

USD Index 90.89 -0.42 (-0.46%)

Important events:
  • – Australian RBA Monetary Policy Statement at 04:30 (GMT+3);
  • – China Markit Composite PMI at 04:45 (GMT+3);
  • – China Trade Balance at 06:00 (GMT+3);
  • – ECB President Christine Lagarde Speaks at 13:00 (GMT+3);
  • – BOE Deputy Governor for Monetary Policy Ben Broadbent Speaks at 14:15 (GMT+3);
  • – US Unemployment Rate at 15:30 (GMT+3);
  • – US Non-Farm Employment Change at 15:30 (GMT+3);
  • – US Average Hourly Earnings at 15:30 (GMT+3);
  • – Canada Unemployment Rate at 15:30 (GMT+3);
  • – Canada Employment Change at 15:30 (GMT+3);
  • – Canada Part-Time Employment Change at 15:30 (GMT+3);
  • – Canada Ivey PMI at 17:00 (GMT+3).

by JustForex


This article reflects a personal opinion and should not be interpreted as an investment advice, and/or offer, and/or a persistent request for carrying out financial transactions, and/or a guarantee, and/or a forecast of future events.


US stocks to climb on jobs optimism

By Han Tan Market Analyst, ForexTime

Asian markets are climbing on the back of Thursday’s gains for US benchmark indices, following fresh signs that the US economy is healing from the wounds inflicted by the pandemic.

The S&P 500 is now just 0.23% away from its record high, while the Dow Jones Industrial Average posted a fresh record high. The Nasdaq 100 ended a 4-day losing streak, though remains about 3% lower from its highest ever closing price recorded on 16 April.

At the time of writing, the futures contracts are pointing to further gains for US and European stocks before the weekend.

Nonfarm payrolls to validate risk-on sentiment

Yesterday, the US recorded its first sub-500k weekly jobless claims since the pandemic forced lockdowns across the country. With more Americans re-entering the workforce, that would help bring the US economy further along into the post-pandemic era.

Such optimism has to be endorsed by today’s US nonfarm payrolls data, with markets forecasting that one million jobs were added in April.

While anything above March’s print of 916,000 would still demonstrate an improvement in the US jobs market, a payrolls tally that’s higher than the-expected one million could well trigger another wave of risk-taking activities across global markets.

Investors will also be monitoring how US consumer price pressures would react to more slack being taken out of the jobs market. More importantly, markets want to know whether such inflation would persist once the low base effect fades, and force the Fed’s hands into adjusting its policy settings earlier than what these central bankers have conveyed to the markets so far.

The Fed’s commitment to its ultra-accommodative stance is arguably the biggest theme in play at the moment, despite the concerted attempts by officials to play down any talk about a premature paring of its stimulus measures.

Gold breaches psychologically-important mark

Spot gold has broken above the $1800 level for the first time since February, and is set to register its biggest weekly gain of the year so far. Gold’s climb has been aided by stabilizing Treasury yields, which in turn has led to a US dollar that’s been moderating since April, noting the inverse relationship between gold and the greenback.

The precious metal is now up by almost 7.8% over the past two months, since it registered its year-to-date low on 8 March, and has now broken above its 100-day simple moving average.

Real yields on 10-year Treasuries remain firmly in negative territory, while its breakeven rates are now around their highest since 2013. Such conditions have implored gold prices to pare its year-to-date losses, considering its trait as a zero-yielding asset.

In order for gold to push higher from current levels, spot prices must carve out an extended presence above $1800 in order to encourage more bulls to get off the sidelines, especially those who cling to the belief that the precious metal is a worthy hedge against faster inflation.


Disclaimer: The content in this article comprises personal opinions and should not be construed as containing personal and/or other investment advice and/or an offer of and/or solicitation for any transactions in financial instruments and/or a guarantee and/or prediction of future performance. ForexTime (FXTM), its affiliates, agents, directors, officers or employees do not guarantee the accuracy, validity, timeliness or completeness, of any information or data made available and assume no liability as to any loss arising from any investment based on the same.


Forex-Time-LogoArticle by ForexTime

ForexTime Ltd (FXTM) is an award winning international online forex broker regulated by CySEC 185/12 www.forextime.com

Sterling Whipsaws On BoE Rate Decision

By Lukman Otunuga Research Analyst, ForexTime

Sterling was injected with a burst of volatility on Thursday after the BoE announced they will reduce the pace of weekly asset purchases to £3.4 billion from the previous rate of £4.4 billion.

As widely expected, the central bank voted unanimously to leave interest rates unchanged at their current record low of 0.1%.

Falling Covid-19 cases, the rapid progress in vaccine rollouts, easing lockdown restrictions, and improving domestic conditions have brightened the UK’s economic outlook. Reflecting these positive developments, GDP is forecast to expand sharply in the second quarter of Q2. Annual economic growth for 2021 is projected to be around 7.25% – the strongest seen since the second world war. In 2022, the bank sees GDP at 5.75% versus the previous estimate of 7.25%.

In regards to inflation, this is expected to reach 2.5% by the end of 2021 before dropping back to 2% in the medium term.

Overall, the Bank of England sounded optimistic over the UK’s post-pandemic economic recovery. However, it felt like the bank took a leaf out of the Federal Reserve’s book in regards to messaging and cooling expectations around tightening monetary policy. Bank of England Governor, Andrew Bailey stated during the press conference that the decision to reduce gilt purchases was not tapering.

What does this mean for the Pound?

After the initial whipsaw, the British Pound later weakened against the Dollar and other G10 currencies.

The weakness could be based around the Bank of England not sounding as hawkish as expected and BoE Governor Bailey’s comments during the press conference. Nevertheless, Pound bulls remain supported by the positive developments in the United Kingdom. Looking at the currency’s performance since the start of 2021, it has appreciated against most of its peers in the G10 space excluding the Canadian Dollar and Norwegian Krone.

GBPUSD trapped within 200 pip range

The currency pair remains trapped in a wide 200 pip range on the daily charts.

Support can be found at 1.3800 and resistance at 1.4000. Given how prices are hovering above the 20-day and 50-day Simple Moving Average, this could provide a platform for bulls to attack with the first level of interest back at 1.4000. Given how the GBPUSD has been trapped within this current range since mid-April, it may take a fundamental catalyst to break out if the technicals fail.

Should prices secure a solid close above 1.4000, this could open a path towards 1.4110. Alternatively, a move below 1.3800 may trigger a decline towards 1.3715.

Disclaimer: The content in this article comprises personal opinions and should not be construed as containing personal and/or other investment advice and/or an offer of and/or solicitation for any transactions in financial instruments and/or a guarantee and/or prediction of future performance. ForexTime (FXTM), its affiliates, agents, directors, officers or employees do not guarantee the accuracy, validity, timeliness or completeness, of any information or data made available and assume no liability as to any loss arising from any investment based on the same.


Forex-Time-LogoArticle by ForexTime

ForexTime Ltd (FXTM) is an award winning international online forex broker regulated by CySEC 185/12 www.forextime.com

Will Copper’s 135% rally break the all-time high?

By Admiral Markets

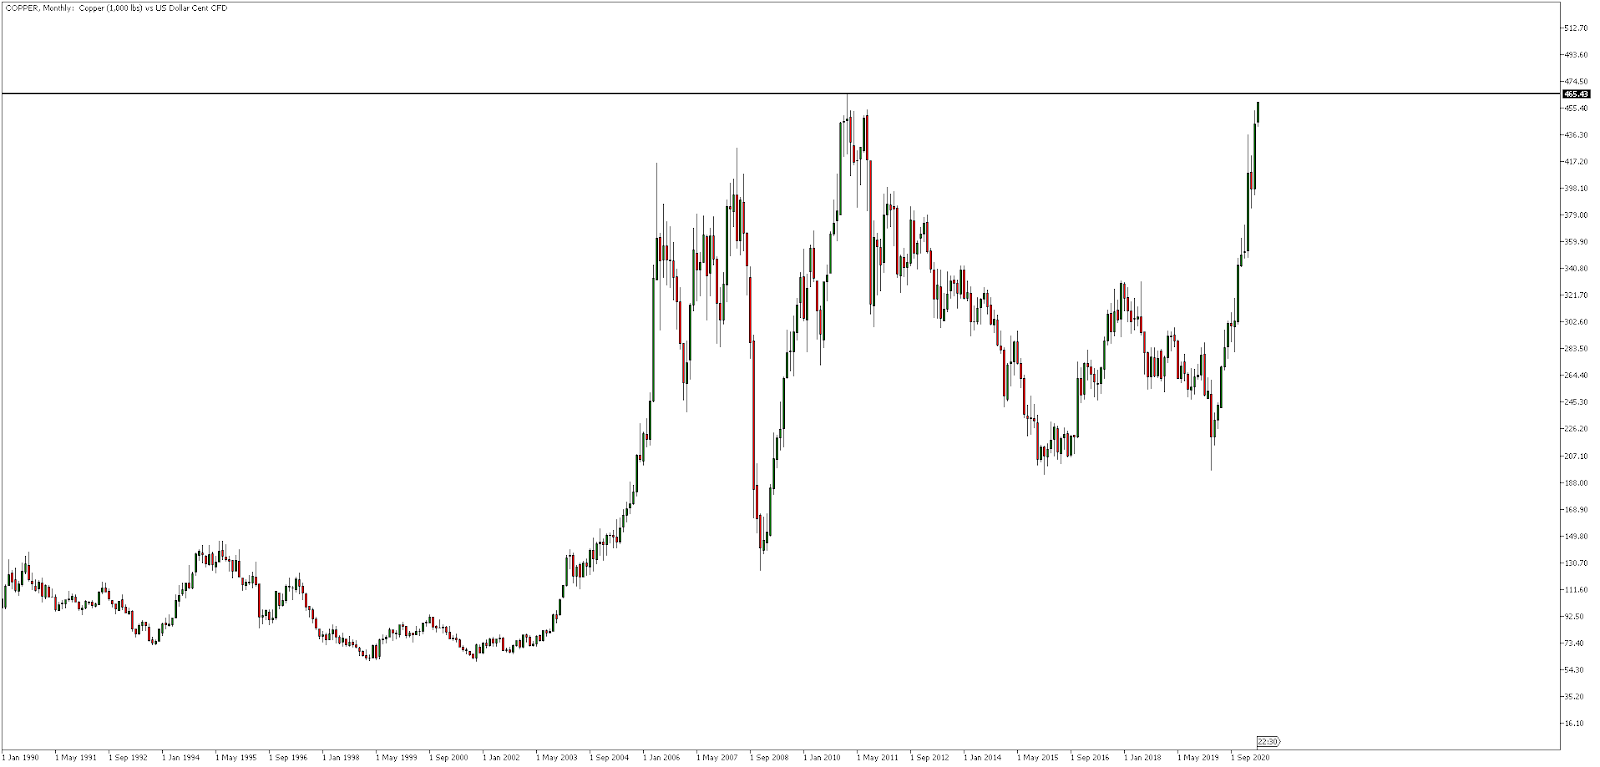
The price of copper has been a monster rally since the lows of the pandemic in 2020. Only a year later and the metal dubbed ‘the new oil’ is up by more than 135% and threatening to break to a new all-time high.

The demand for the metal has caused investment banks such as the Bank of America to state that the world is running out of copper due to supply deficits. They highlight that inventories are now at levels seen 15 years ago which can only cover three weeks of demand.

As the global economy starts to reopen, a huge surge in demand for copper is expected, potentially driving prices up even further.

Source: Admirals MetaTrader 5, COPPER, Monthly – Data range: from Jan 1, 1990, to May 6, 2021, performed on May 6, 2021, at 8:30 pm GMT. Please note: Past performance is not a reliable indicator of future results. 


The long-term price chart of copper shown above shows a very choppy trend. However, the recent surge higher in the metal has occurred before, most notably from 2001 to 2006 and 2008 to 2011.

With demand increasing and supply levels remaining constrained, analysts are forecasting a break to new record highs and the start of a new commodity super cycle, making it a metal to watch.

Did you know that you can use the Trading Central Technical Ideas Lookup indicator to find actionable trading ideas on Amazon’s share price and thousands of other instruments across Forex, stocks, indices, commodities and more?

You can get this indicator completely FREE by upgrading your MetaTrader 5 trading platform provided by Admirals (formerly Admiral Markets) to the exclusive Supreme Edition!

Start your free download by clicking on the banner below:

Download MetaTrader 5 Supreme Edition INFORMATION ABOUT ANALYTICAL MATERIALS:

The given data provides additional information regarding all analysis, estimates, prognosis, forecasts, market reviews, weekly outlooks or other similar assessments or information (hereinafter “Analysis”) published on the websites of Admiral Markets investment firms operating under the Admiral Markets trademark (hereinafter “Admiral Markets”) Before making any investment decisions please pay close attention to the following:

  1. This is a marketing communication. The content is published for informative purposes only and is in no way to be construed as investment advice or recommendation. It has not been prepared in accordance with legal requirements designed to promote the independence of investment research, and that it is not subject to any prohibition on dealing ahead of the dissemination of investment research.
  2. Any investment decision is made by each client alone whereas Admiral Markets shall not be responsible for any loss or damage arising from any such decision, whether or not based on the content.
  3. With view to protecting the interests of our clients and the objectivity of the Analysis, Admiral Markets has established relevant internal procedures for prevention and management of conflicts of interest.
  4. The Analysis is prepared by an independent analyst, Jitan Solanki (analyst), (hereinafter “Author”) based on their personal estimations.
  5. Whilst every reasonable effort is taken to ensure that all sources of the content are reliable and that all information is presented, as much as possible, in an understandable, timely, precise and complete manner, Admiral Markets does not guarantee the accuracy or completeness of any information contained within the Analysis.
  6. Any kind of past or modeled performance of financial instruments indicated within the content should not be construed as an express or implied promise, guarantee or implication by Admiral Markets for any future performance. The value of the financial instrument may both increase and decrease and the preservation of the asset value is not guaranteed.
  7. Leveraged products (including contracts for difference) are speculative in nature and may result in losses or profit. Before you start trading, please ensure that you fully understand the risks involved.

By Admiral Markets

Big Money In The Market Rotating Out Of Equities Into Gold Bonds And Utilities

By TheTechnicalTraders 

– Chris Vermeulen joins Adelaide Capital to share his latest market analysis. When we are looking at the broad indexes in the stock market we are beginning to see some pretty obvious divergence between them and defensive sectors such as consumer staples bonds utilities and precious metals. This means big money is going to “risk off” on some more speculative plays and moving to defensive positions. This is the same scenario as what happened in September before equities went sideways for months and in February before the market crashed.  Watch our special hour long interview to learn more.

Click on the image below to watch the interview

Stay on top of these crazy markets with Chris’s daily pre-market walkthrough of the charts of all the major asset classes with BAN Trader Pro


Ichimoku Cloud Analysis 06.05.2021 (AUDCHF, CADCHF, CHFJPY)

Article By RoboForex.com

AUDCHF, “Australian Dollar vs Swiss Franc”

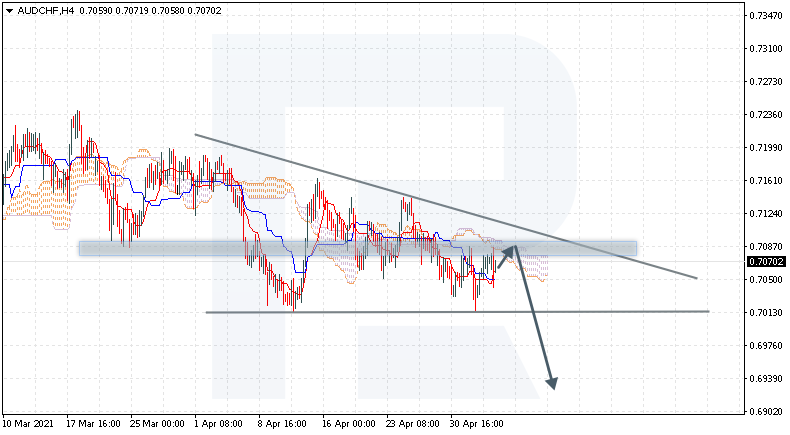
AUDCHF is trading at 0.7070; the instrument is moving below Ichimoku Cloud, thus indicating a descending tendency. The markets could indicate that the price may test the cloud’s upside border at 0.7075 and then resume moving downwards to reach 0.6925. Another signal in favor of a further downtrend will be a rebound from the resistance level. However, the bearish scenario may no longer be valid if the price breaks the cloud’s upside border and fixes above 0.7105. In this case, the pair may continue growing towards 0.7210. To confirm further decline, the asset must break the downside border of the Triangle pattern and fix below 0.6995.

AUDCHF
Risk Warning: the result of previous trading operations do not guarantee the same results in the future

CADCHF, “Canadian Dollar vs Swiss Franc”

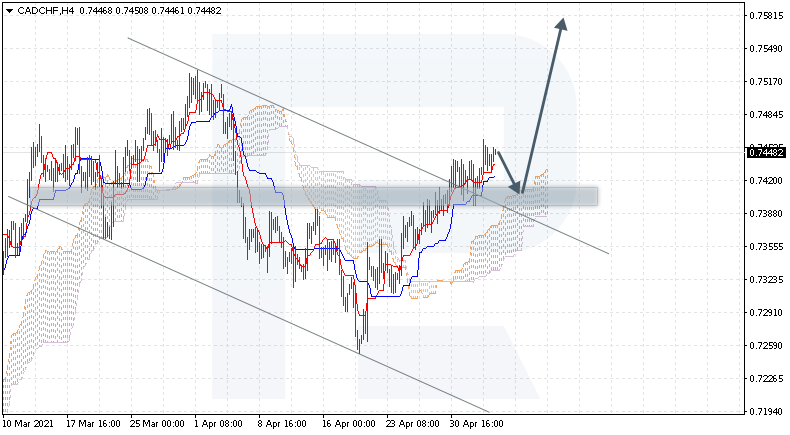
CADCHF is trading at 0.7448; the instrument is moving above Ichimoku Cloud, thus indicating an ascending tendency. The markets could indicate that the price may test the cloud’s upside border at 0.7415 and then resume moving upwards to reach 0.7585. Another signal in favor of a further uptrend will be a rebound from the support level. However, the bullish scenario may no longer be valid if the price breaks the cloud’s downside border and fixes below 0.7310. In this case, the pair may continue falling towards 0.7225.

CADCHF
Risk Warning: the result of previous trading operations do not guarantee the same results in the future

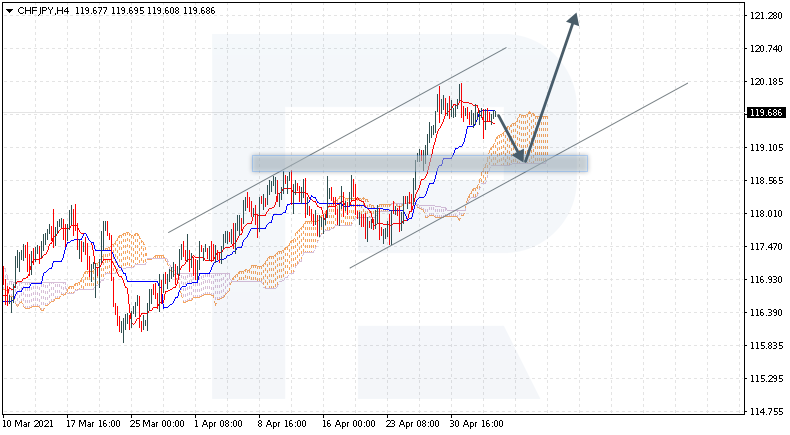
CHFJPY, “Swiss Franc vs Japanese Yen”

CHFJPY is trading at 119.68; the instrument is moving above Ichimoku Cloud, thus indicating an ascending tendency. The markets could indicate that the price may test the cloud’s downside border at 119.05 and then resume moving upwards to reach 121.30. Another signal in favor of a further uptrend will be a rebound from the rising channel’s downside border. However, the bullish scenario may no longer be valid if the price breaks the cloud’s downside border and fixes below 118.45. In this case, the pair may continue falling towards 117.55.

CHFJPY

Article By RoboForex.com

Attention!
Forecasts presented in this section only reflect the author’s private opinion and should not be considered as guidance for trading. RoboForex LP bears no responsibility for trading results based on trading recommendations described in these analytical reviews.

Forex Technical Analysis & Forecast 06.05.2021

Article By RoboForex.com

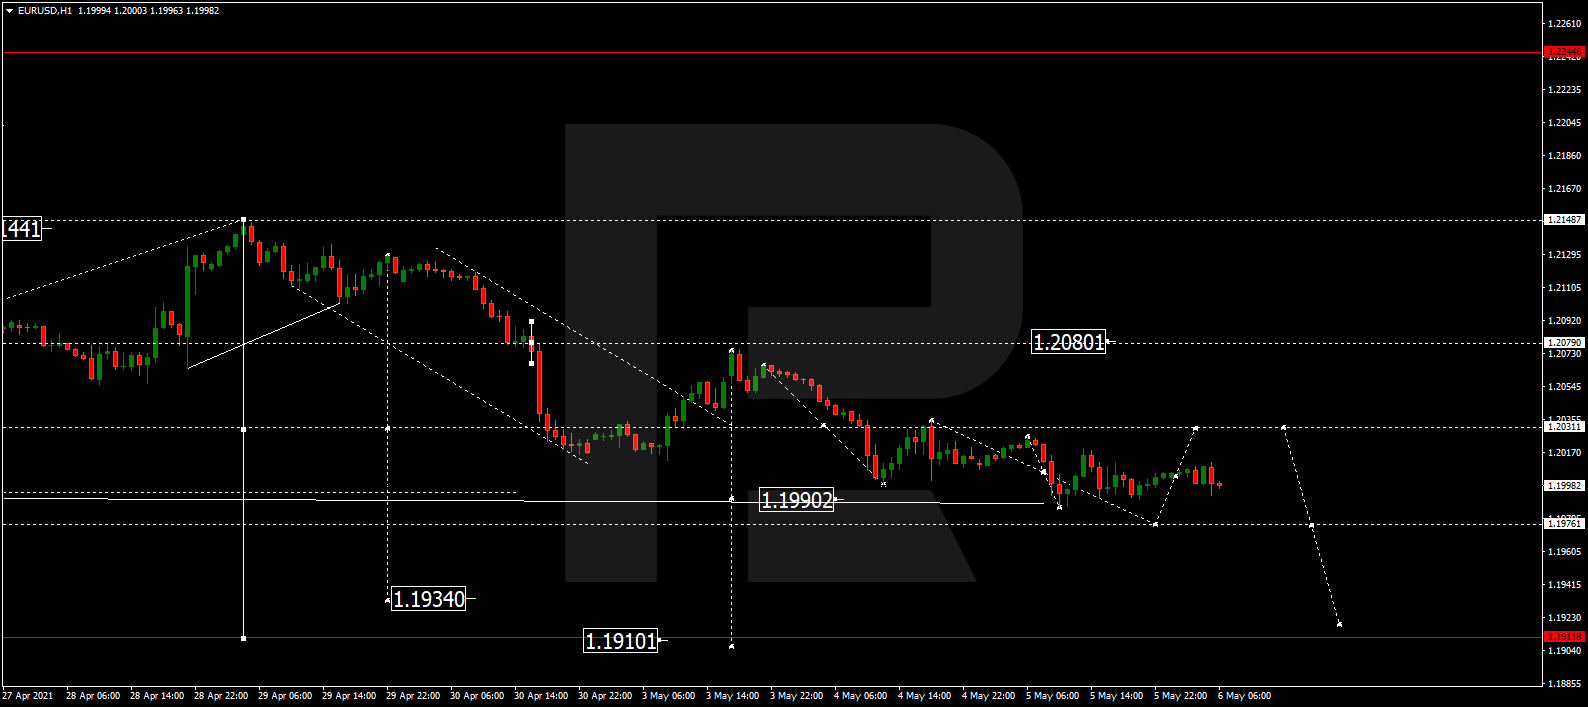
EURUSD, “Euro vs US Dollar”

After reaching another downside target at 1.1990, EURUSD is forming a new consolidation range around 1.2000. Possibly, the pair may expand the range up to 1.2030. If later the price breaks this range to the upside, the market may start a new correction towards 1.2080; if to the downside – resume trading downwards to extend this wave and reach the short-term target at 1.1934.

EURUSD
Risk Warning: the result of previous trading operations do not guarantee the same results in the future

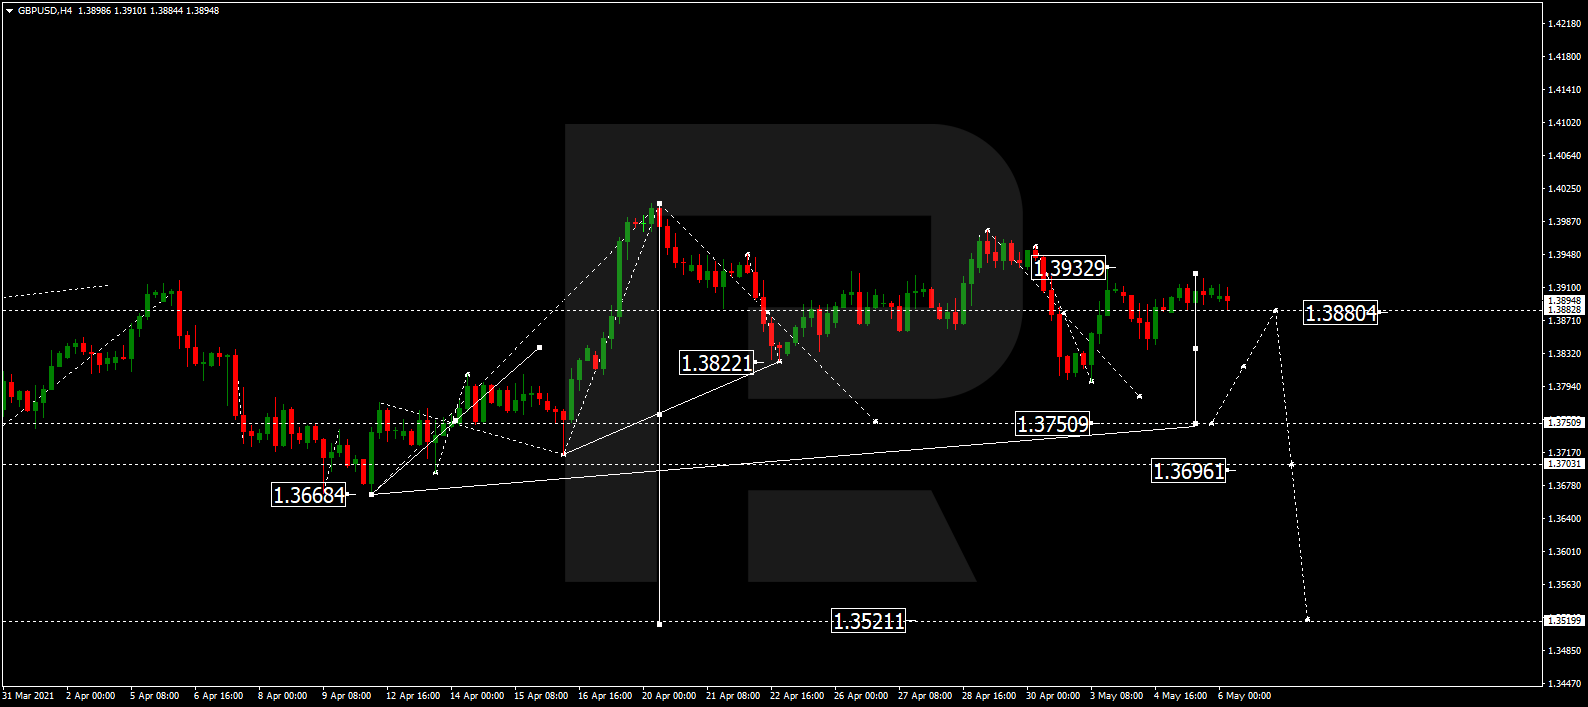
GBPUSD, “Great Britain Pound vs US Dollar”

GBPUSD is still consolidating around 1.3880. Possibly, today the pair may expand the range up to 1.3933 and resume trading downwards to reach 1.3750. Later, the market may break this level and continue falling with the target at 1.3696.

GBPUSD
Risk Warning: the result of previous trading operations do not guarantee the same results in the future

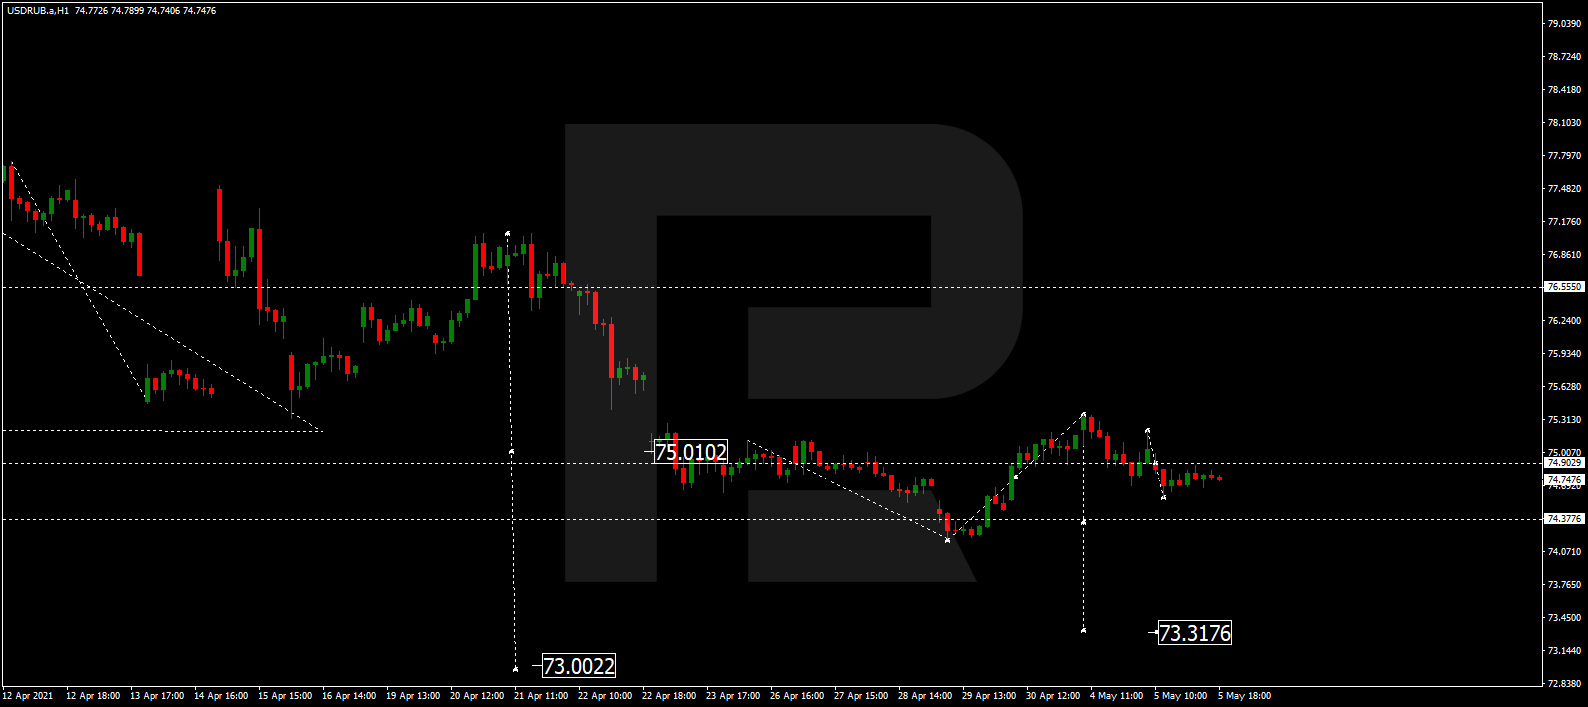
USDRUB, “US Dollar vs Russian Ruble”

USDRUB is still consolidating around 74.90. Today, the pair may fall to break 74.40. After that, the instrument may continue trading downwards with the short-term target at 73.30.

USDRUB
Risk Warning: the result of previous trading operations do not guarantee the same results in the future

USDJPY, “US Dollar vs Japanese Yen”

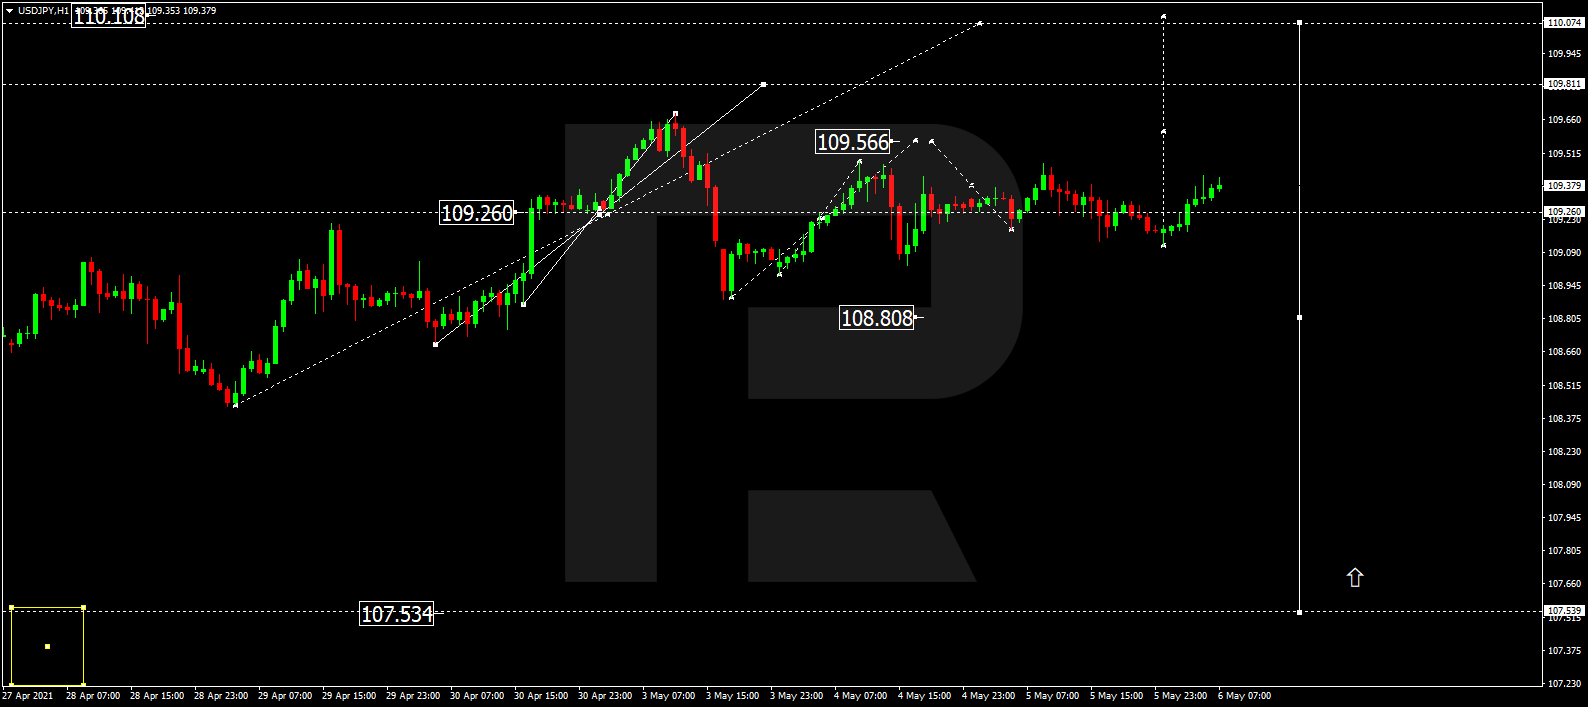
USDJPY is still consolidating around 109.26 without any particular direction. Possibly, the pair may form one more ascending structure towards 109.56 and then start a new decline to reach 109.30. Later, the market may resume growing with the target at 109.80.

USDJPY
Risk Warning: the result of previous trading operations do not guarantee the same results in the future

USDCHF, “US Dollar vs Swiss Franc”

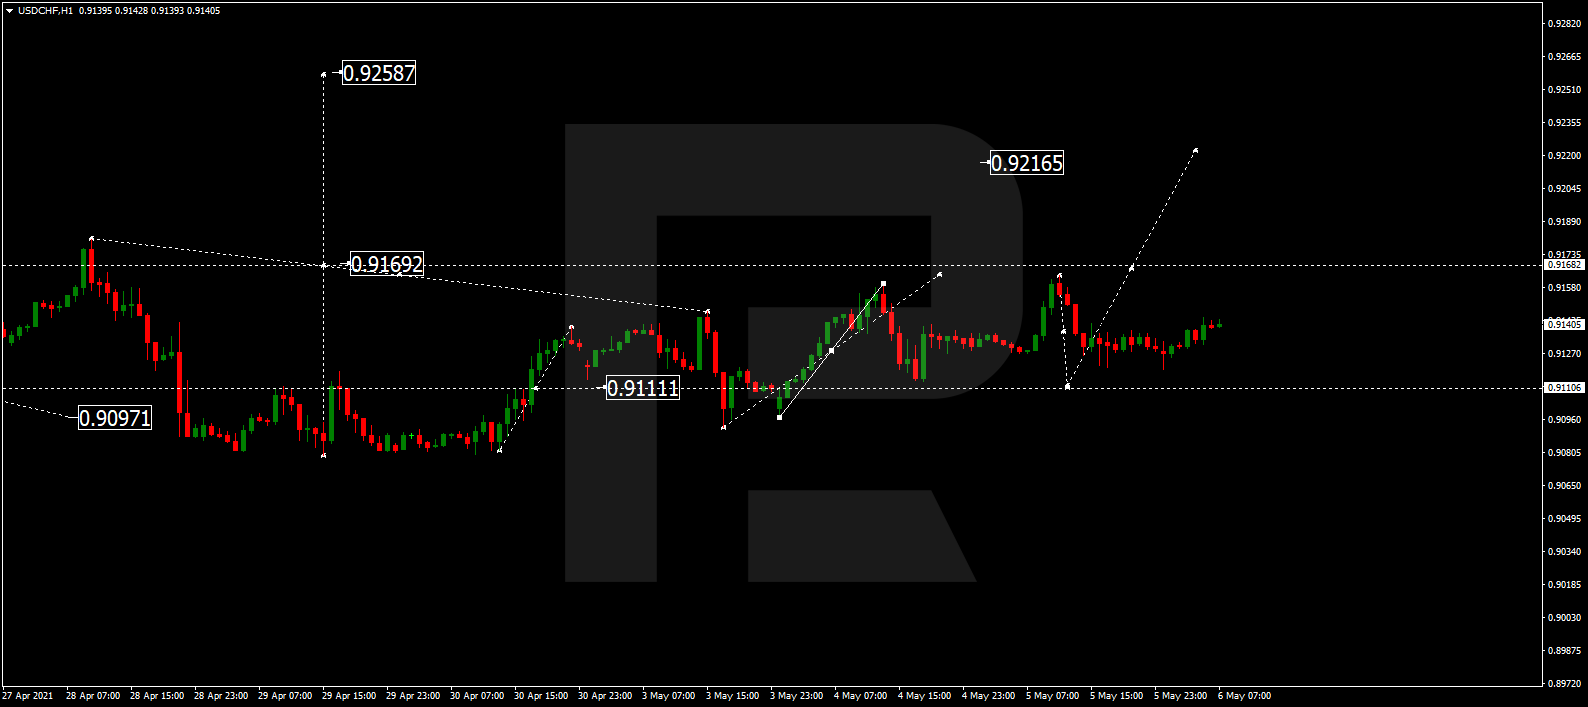
After completing the ascending structure at 0.9160, USDCHF is correcting towards 0.9111 and may later form one more ascending structure to break 0.9168. After that, the instrument may continue trading upwards with the target at 0.9210.

USDCHF
Risk Warning: the result of previous trading operations do not guarantee the same results in the future

AUDUSD, “Australian Dollar vs US Dollar”

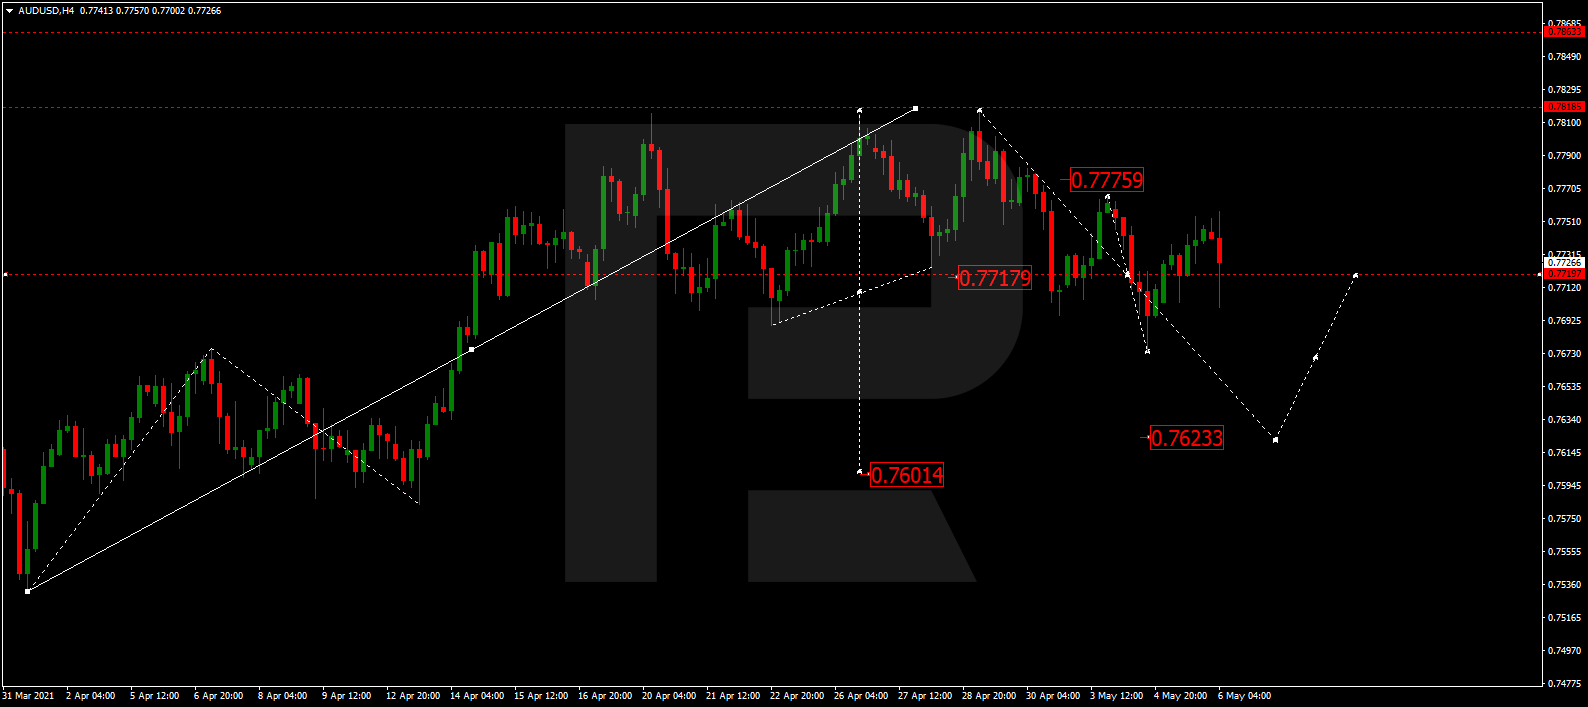
AUDUSD is still consolidating around 0.7717 without any particular trend. Possibly, today the pair may fall to reach 0.7623. Later, the market may start a new correction to return to 0.7717 and then resume falling with the target at 0.7600.

AUDUSD
Risk Warning: the result of previous trading operations do not guarantee the same results in the future

BRENT

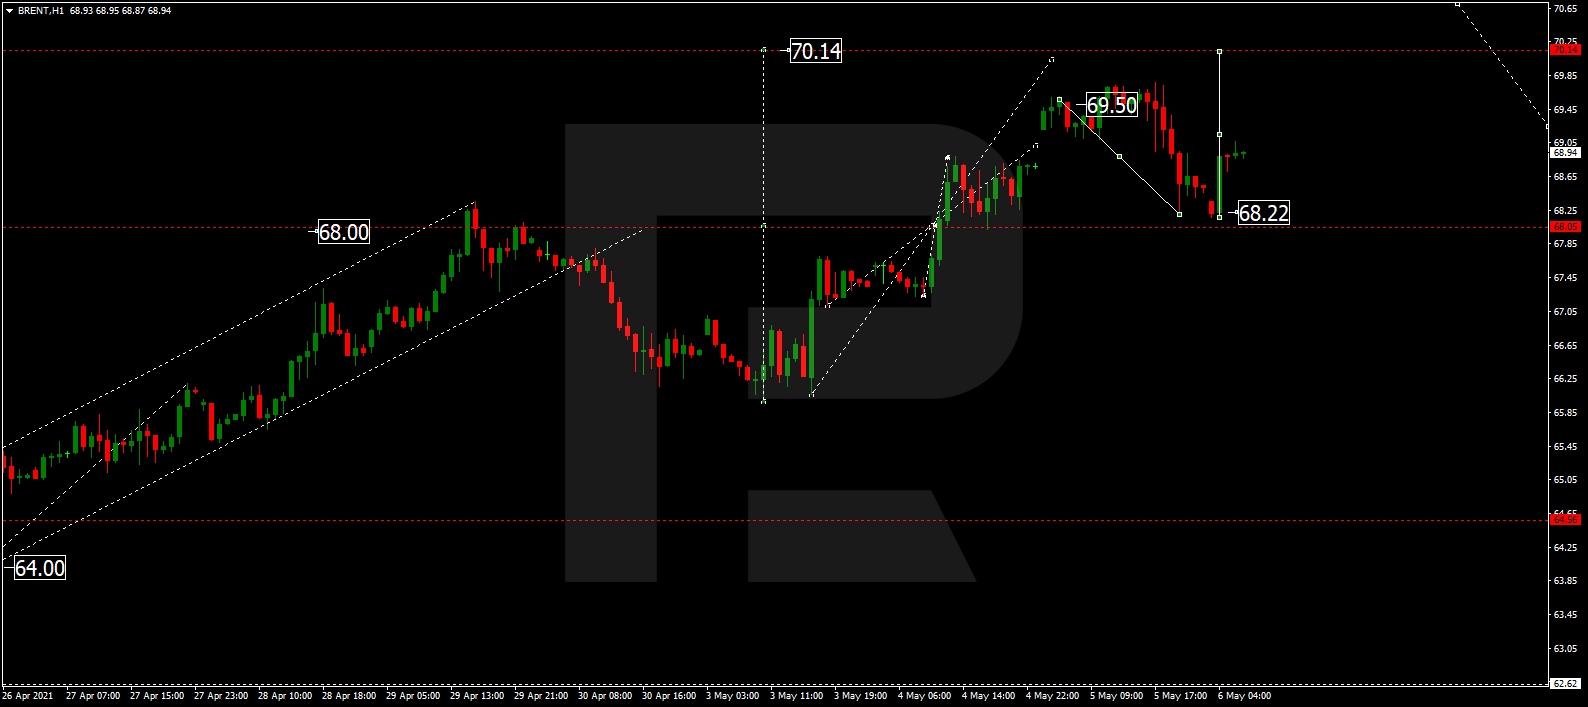
After completing the correction at 68.22, Brent is expected to grow towards 70.15 and may later correct to reach 68.00. Later, the market may resume trading upwards with the target at 72.00.

BRENT
Risk Warning: the result of previous trading operations do not guarantee the same results in the future

XAUUSD, “Gold vs US Dollar”

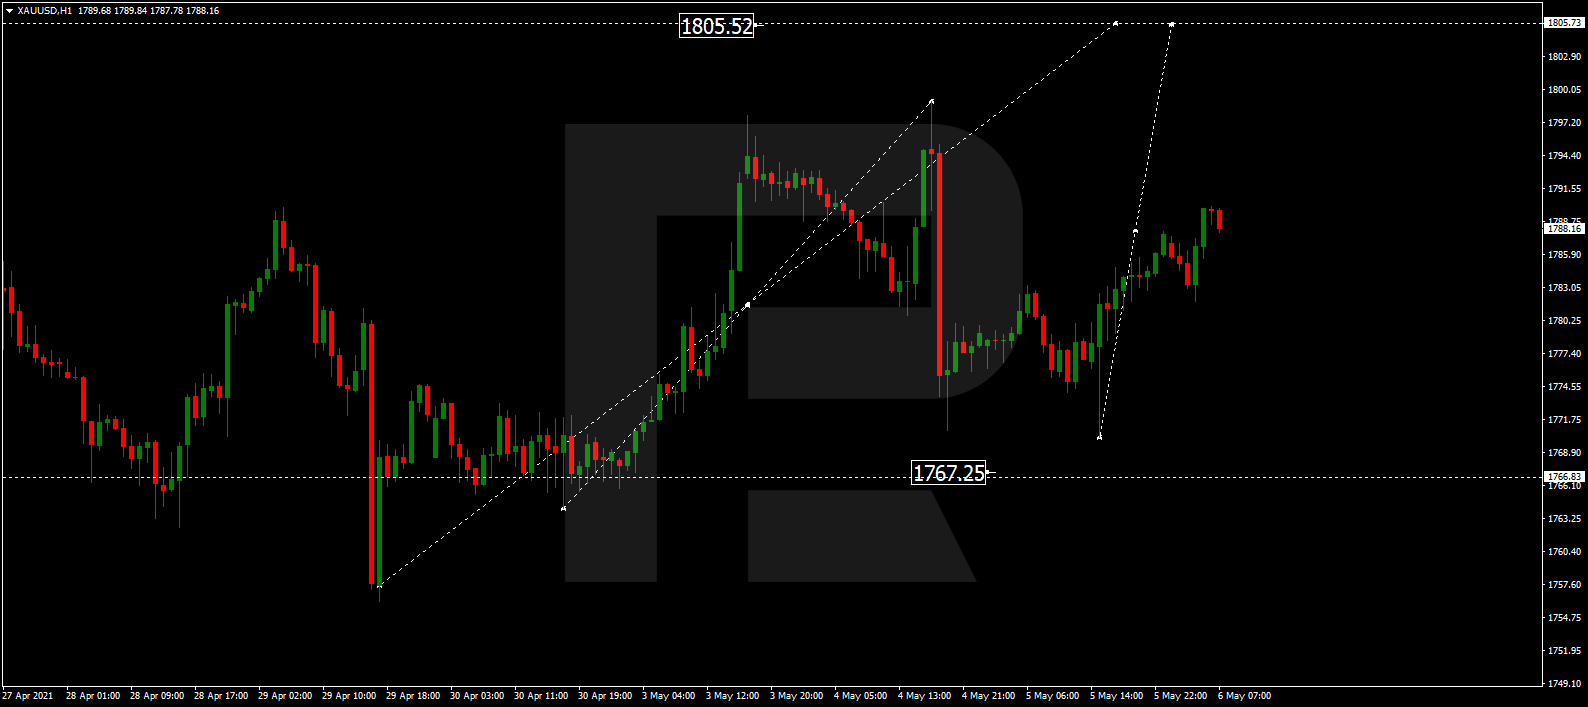
After finishing the ascending structure at 1788.00m Gold is consolidating around this level. If later the price breaks this range to the upside, the market may start a new growth with the target at 1805.50; if to the downside – continue the correction towards 1767.25 and then resume trading upwards to reach the above-mentioned target.

GOLD
Risk Warning: the result of previous trading operations do not guarantee the same results in the future

S&P 500

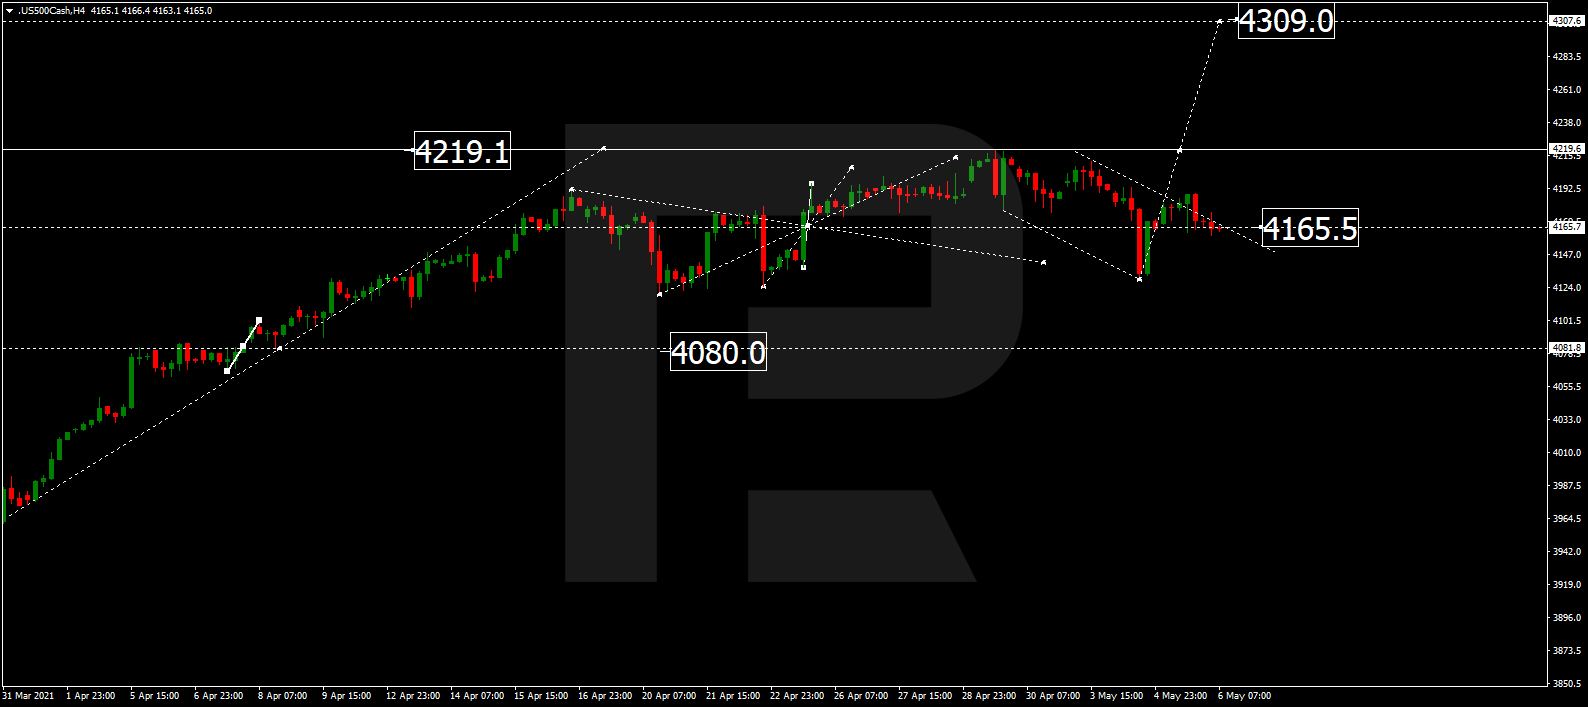
The S&P index is still consolidating around 4165.5. Today, the asset may resume growing with the target at 4309.0 and then start another correction towards 4080.0.

S&P 500

Article By RoboForex.com

Attention!
Forecasts presented in this section only reflect the author’s private opinion and should not be considered as guidance for trading. RoboForex LP bears no responsibility for trading results based on trading recommendations described in these analytical reviews.

The Analytical Overview of the Main Currency Pairs on 2021.05.06

by JustForex

The EUR/USD currency pair

Technical indicators of the currency pair:
  • Prev Open: 1.2010
  • Prev Close: 1.2005
  • % chg. over the last day: -0.04%

The EUR/USD currency pair showed weak activity on Wednesday. The price is under the moving average and continues to slowly slide down. Buyers manage to hold the 1.2002 support level.

Trading recommendations
  • Support levels: 1.2002, 1.1957, 1.1835
  • Resistance levels: 1.2074, 1.2108, 1.2145, 1.2176, 1.2212, 1.2243

The MACD indicator keeps signaling a divergence. Considering the positive news from Europe about the acceleration of the vaccination, the market conditions are in favor of buyers, so traders should expect a rebound.

Alternative scenario: if the price breaks out through the 1.2108 level and holds above, the general uptrend is likely to continue.

EUR/USD
News feed for 2021.05.06:
  • – ECB President Christine Lagarde Speaks at 14:25 (GMT+3);
  • – US Unemployment Claims at 15:30 (GMT+3).

The GBP/USD currency pair

Technical indicators of the currency pair:
  • Prev Open: 1.3885
  • Prev Close: 1.3908
  • % chg. over the last day: +0.16%

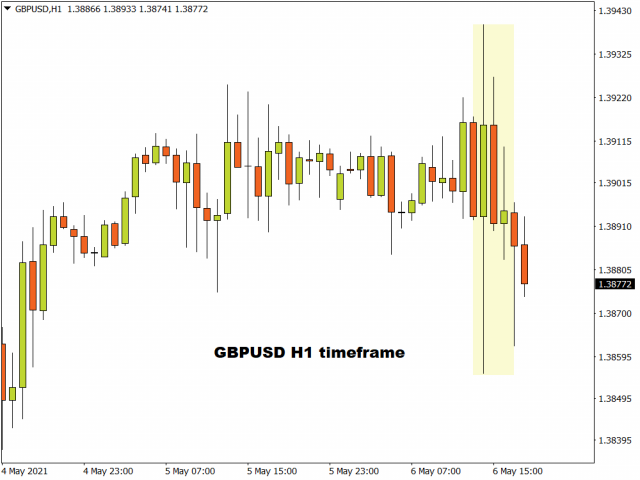
The GBP/USD currency pair is trading in a narrow range. A bunch of important news from the UK is expected to shake up the price today. Considering that the buyers are pushing the price to the 1.3835 resistance level and no changes are planned in monetary policy, the price is likely to resume growth.

Trading recommendations
  • Support levels: 1.3835, 1.3801, 1.3756, 1.3690
  • Resistance levels: 1.3913, 1.3996, 1.4149

There is no optimal entry point for GBP/USD on the H1 timeframe right now. Traders need to wait for any of the participants to be active. The best strategy would be to either trade intraday local moves or stay out of position until the news is released.

Alternative scenario: if the price breaks out through the 1.3913 resistance level and holds above, the bullish scenario is likely to become active again.

GBP/USD
News feed for 2021.05.06:
  • – UK Final Services PMI at 11:00 (GMT+3);
  • – Bank of England Interest Rate Decision at 14:00 (GMT+3);
  • – Asset Purchase Facility at 14:00 (GMT+3);
  • – MPC Asset Purchase Facility Votes at 14:00 (GMT+3);
  • – BOE Monetary Policy Report at 14:00 (GMT+3).

The USD/JPY currency pair

Technical indicators of the currency pair:
  • Prev Open: 109.30
  • Prev Close: 109.18
  • % chg. over the last day: -0.11%

The USD/JPY currency pair continues to stay in a flat, without any changes. Japan and China are going back to work today after a long weekend, so traders should expect an increase in volatility.

Trading recommendations
  • Support levels: 108.87, 108.44, 108.19,107.77, 107.47, 107.04
  • Resistance levels: 109.49, 109.64, 109.95, 110.51

The price is still trading above the moving average, but the MACD indicator is completely inactive. Under such market conditions, the best strategy would be to trade intraday deals with short targets.

Alternative scenario: if the price drops below 108.44, the general downtrend will continue with a high probability.

USD/JPY
There is no news feed for today.

The USD/CAD currency pair

Technical indicators of the currency pair:
  • Prev Open: 1.2307
  • Prev Close: 1.2265
  • % chg. over the last day: -0.34%

The USD/CAD currency pair continues to trade in the range. Buyers are actively defending the 1.2270 support level. The price fails to break down and holds below. The MACD indicator is showing a divergence, so traders should expect a rebound.

Trading recommendations
  • Support levels: 1.2270, 1.2165
  • Resistance levels: 1.2321, 1.2388, 1.2414, 1.2519, 1.2618

The trend remains bearish on USD/CAD, but the movement has switched to a flat structure. Such scenario is likely to last till Friday, where the interest rate news is expected. The best strategy in a wide flat would be to trade from the borders of the corridor. But taking into account the bearish context, it makes more sense to look for sell positions from resistance levels, despite a possible rebound upwards.

Alternative scenario: if the price breaks through the 1.2414 resistance level and holds above, a local corrective uptrend is likely to form.

USD/CAD
There is no news feed for today.

by JustForex


This article reflects a personal opinion and should not be interpreted as an investment advice, and/or offer, and/or a persistent request for carrying out financial transactions, and/or a guarantee, and/or a forecast of future events.

Despite good macroeconomic data in the U.S., technology stocks are down four sessions in a row

by JustForex

U.S. indices have lost correlation. While NASDAQ has been slowly sliding down for 4 trading sessions in a row, it’s colleague Dow Jones updated the all-time high yesterday.

Yesterday’s data on business activity in Europe was good but worse than expected. At the end of Wednesday, the European stock markets showed strong growth amid the accelerating rates of vaccination and the first signs of recovery in the euro area due to good reporting by European companies.

Crude oil production in the U.S. remained unchanged compared to the previous week at 10.9 million barrels per day. Saudi Arabia will raise oil prices for the U.S. in June but cut prices for other regions. Natural gas storage is expected to report today.

Gold futures rose during the U.S. and Asian trading sessions. The price added 0.4%. Considering the uncertainty about a possible interest rate change and worries about rising inflation expectations, the gold and silver metals may rise significantly.

Asian markets are rising as the market is opening opens on Thursday. The broadest index of Asia-Pacific stocks MSCI rose by +0.25 %, Japan’s Nikkei Index increased by 1.8 % after a five-day weekend. Chinese stocks were mixed in early trading, with the Shanghai Composite up by +0.45% and the CSI300 down by -0.2%.

Square, Volkswagen, Moderna, Linde, AIG, Motorola, Datadog and ROKU are reporting for Q1 2021 today.

Main market quotes:

S&P 500 (F) 4,167.59 +2.93 (+0.07%)

Dow Jones 34,230.34 +97.61 (+0.29%)

DAX 15,170.78 +314.30 (+2.12%)

FTSE 100 7,039.30 +116.13 (+1.68%)

USD Index 91.27 -0.02 (-0.02%)

Important events:
  • – UK Services PMI at 11:00 (GMT+3);
  • – Bank of England Interest Rate Decision at 14:00 (GMT+3);
  • – BoE Asset Purchase Facility at 14:00 (GMT+3);
  • – MPC Asset Purchase Facility Votes at 14:00 (GMT+3);
  • – BOE Monetary Policy Report at 14:00 (GMT+3);
  • – ECB President Christine Lagarde Speaks at 14:25 (GMT+3);
  • – US Initial Jobless Claims at 15:30 (GMT+3).

by JustForex


This article reflects a personal opinion and should not be interpreted as an investment advice, and/or offer, and/or a persistent request for carrying out financial transactions, and/or a guarantee, and/or a forecast of future events.

Investors awaiting US jobs report before making the next move

By Hussein Sayed Chief Market Strategist (Gulf & MENA), ForexTime

US equity futures are struggling for direction this morning after a late tech selloff yesterday sent the Nasdaq lower for a fourth consecutive session. But the Dow Jones Industrial Average managed to advance to a new record high with the support of cyclical industries. European markets are also set for a subdued open following a mixed Asia session which saw Japanese stocks outperforming on their return from holiday, while shares in China and Australia dropped after Beijing announced a suspension of regular economic dialogue with Canberra.

US bond yields are back under pressure with 10-year yields falling for a fifth straight day, preventing the dollar from further rallies. Meanwhile in commodities, Brent is still attempting to break above $70 a barrel as crude stockpiles in the US fell more sharply than anticipated.

Key trends for equity investors haven’t changed a lot so far this year. Value and cyclical stocks remain the main beneficiaries from the reopening of economies, while growth and tech firms with overstretched valuations continue to suffer. In an expensive equity market and with anticipation of higher interest rates, value tends to benefit the most and investors are sticking to this narrative.

Surprisingly though, the bond market is still doing holding up despite all sorts of talk about an overheating economy and soaring inflation expectations. The 10-year breakeven inflation rate which measures expected inflation over the next 10 years reached 2.47% on Wednesday, the highest in eight years. Meanwhile five year breakeven rates approached 2.7%, the highest in a decade.

If Friday’s US jobs report comes out strong enough to force the Federal Reserve to announce tapering of asset purchases later this year, we could see the upward trajectory in long term bond yields resume after its latest pause. However, looking at recent economic data releases, it seems the economy is failing to surprise to the upside.

The employment component of the US PMI Manufacturing and Services indices both came in slightly above market expectations this week. Private payrolls rose by 742,000 jobs in April posting its biggest gain in seven months but still fell short of the 800,000 forecast. Today’s initial jobless claims will also provide more information about the recovery in the labour market. But it is Friday’s non-farm payrolls report that will determine how bond yields could move and possibly take the dollar in the same direction.

Disclaimer: The content in this article comprises personal opinions and should not be construed as containing personal and/or other investment advice and/or an offer of and/or solicitation for any transactions in financial instruments and/or a guarantee and/or prediction of future performance. ForexTime (FXTM), its affiliates, agents, directors, officers or employees do not guarantee the accuracy, validity, timeliness or completeness, of any information or data made available and assume no liability as to any loss arising from any investment based on the same.


Forex-Time-LogoArticle by ForexTime

ForexTime Ltd (FXTM) is an award winning international online forex broker regulated by CySEC 185/12 www.forextime.com