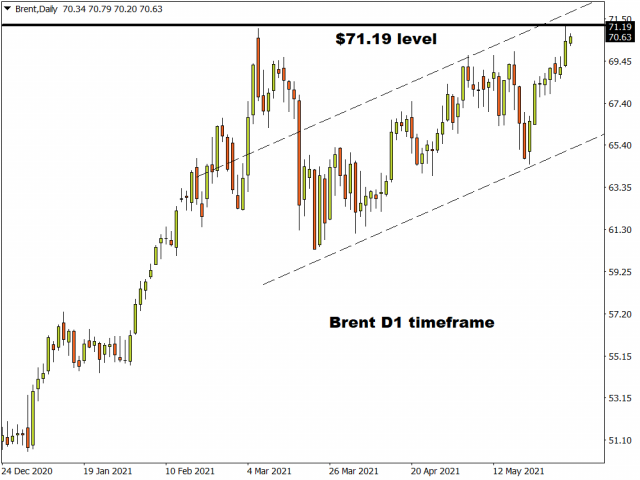
Trading in most assets is fairly quiet, with the exception of oil which continues to grind higher and is hitting two-year highs as the market focuses on the brightening demand picture across the globe. The slow pace of nuclear talks between the US and Iran is also helping the supply side with Brent bulls now eyeing up the April 2019 highs at $75.58.
FX major pairs are stuck within ranges, but the (even more important) monthly US labour market out tomorrow is building up to be the major risk event for the month of June, setting the scene for the next FOMC meeting mid-month. Although though the recent tone of Fed policymakers is subtly shifting, any key data misses will move the narrative once again back to an uber-patient Federal Reserve on “go-slow” with regard to policy changes and tapering bond purchases. On the flipside, Fed expectations should be gradually built into assets from here as the world heals and the recovery continues to pick up steam.
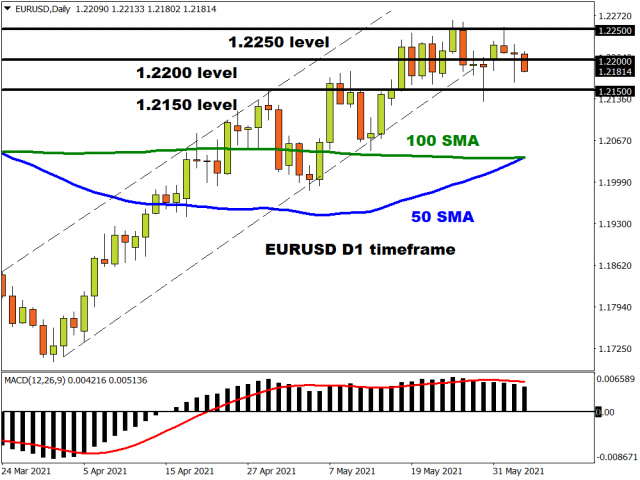
The world’s most popular currency pair has printed two bullish pin bar candles in recent sessions which suggest buyers are in the ascendency and stepping in when prices fall too far, too quickly. With the region’s vaccination surge gathering momentum, so the single currency should push materially higher above 1.22 so consolidating its two-month bullish trend. But for now, we know what’s on everyone’s mind, so we will be rangebound until 1.30pm BST tomorrow!
Big day for USD/CAD…tomorrow
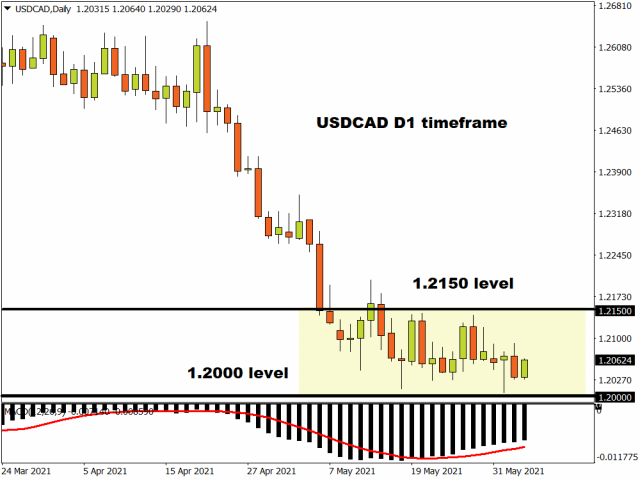
After failing to hold gains to fresh, six-year high against the USD, the loonie is finding some support versus the dollar’s advance on the back of firm oil prices. Canadian GDP showed decent growth and even though the monthly figures highlighted the April slowdown due to the more lockdowns, the BoC remains in the hawkish central bank camp.
USD/CAD continues to consolidate across the 1.20 support zone. The longer it does so, the more explosive the breakout but gains will need to push above the 1.2150 zone to arrest the strong downtrend. The double hit of the NFP and a Canada jobs report tomorrow will no doubt determine direction.
Disclaimer: The content in this article comprises personal opinions and should not be construed as containing personal and/or other investment advice and/or an offer of and/or solicitation for any transactions in financial instruments and/or a guarantee and/or prediction of future performance. ForexTime (FXTM), its affiliates, agents, directors, officers or employees do not guarantee the accuracy, validity, timeliness or completeness, of any information or data made available and assume no liability as to any loss arising from any investment based on the same.
– The Russell 2000, which had experienced an incredible 48% upside price rally after the November 2020 US elections, has recently peaked near an upward sloping price channel that originated shortly after the 2010 Housing Crisis bottom. The incredible aspect is that the post-COVID price rally accelerated at such an extreme rate that the current peak level (highlighted by the MAGENTA circle on the chart below) represents an extreme rally phase in price. Unquestionably, at this point, the markets are searching for a new trend and the IWM has consolidated into a sideways Flagging price formation.
I believe global traders are currently searching for new opportunities and have taken the past 45+ days to re-evaluate the extent of the post-COVID rally in the markets. Ironically, the IWM and SPY show similar types of extreme rallies to a previous (2009~2010) price channel high. It is the opinion of my team and I that the markets have entered an over-enthusiastic rally phase to reach these levels and are currently stalling while searching for a new trend.
IWM Flagging Sideways – Watch the $206 Support Level
The current price Flag formation in the IWM chart highlights the extended range for this Flagging price formation. It also highlights the extreme rally phase that took place after the November 2020 elections. At these highs, combined with this Flagging price formation, a moderate price reversion is quite likely if key support is broken in the near future.
Our research suggests the $206 level on this chart is critical support representing a key price level in the event of a breakdown in price as the Flag formation apexes. Further price targets are available using a type of Fan price extension from the 2009 lows and encompassing the 2018 highs and the 2020 lows. We’ll discuss the downside targets further into this article.
This Daily IWM chart further illustrates the moderate price resistance near the Flag boundaries. Recently, we can see the upper Flag price channel has acted as a strong resistance level as price continues to tighten into the range. IWM opened above the upper Flag price channel this morning and is now trading back below it. This is what we call a “scouting party” – where price attempts to explore new price ranges to see if moderate support or resistance is found outside of these boundaries.
Currently, price has retraced back into the Flag price range and may attempt another move higher if support for another rally attempt continues.
As we interpret this extended sideways price flag, either the markets will regain their footing and attempt another rally phase (breaking this sideways price channel and attempting to move dramatically higher) or this sideways price channel will prompt a downside breakdown in price – possibly targeting key support near $206.
If a new rally sets up, we believe strong upper resistance will be found near $235~237 (near the MAGENTA extended upper price channel from the 2009 bottom). If a breakdown takes place, the $206 level become a very critical support level (recent lows) which, if broken, could prompt a much deeper price reversion event.
We feel the markets are waiting for a new event or trend to drive new trader/investor participation. After this big rally that followed the November 2020 elections, many traders/investors are anticipating inflation and US Fed moves to curb this extreme rally phase. Possibly, traders/investors are starting to become overly complacent related to the continuous bullish trending phase (especially after Bitcoin and other market sectors have begun a deeper downside price trend).
Time will tell how this Flag formation ends. The NASDAQ and the Russell 2000 will likely be the leaders of any breakout or breakdown in trend. So, what I’d say is to pay attention to how the markets react over the next 15+ days to prepare for the next big trend. One thing we are certain will take place throughout the rest of 2021 and into 2022 – big trends and big volatility. If you have not prepared for this – please consider how the markets will react to any type of breakout or breakdown price event.
Please take a minute to learn about my BAN Trader Pro newsletter service and how it can help you identify and trade better sector setups. My team and I have built this strategy to help us identify the strongest and best trade setups in any market sector. Every day, we deliver these setups to our subscribers along with the BAN Trader Pro system trades. You owe it to yourself to see how simple it is to trade 30% to 40% of the time to generate incredible results.
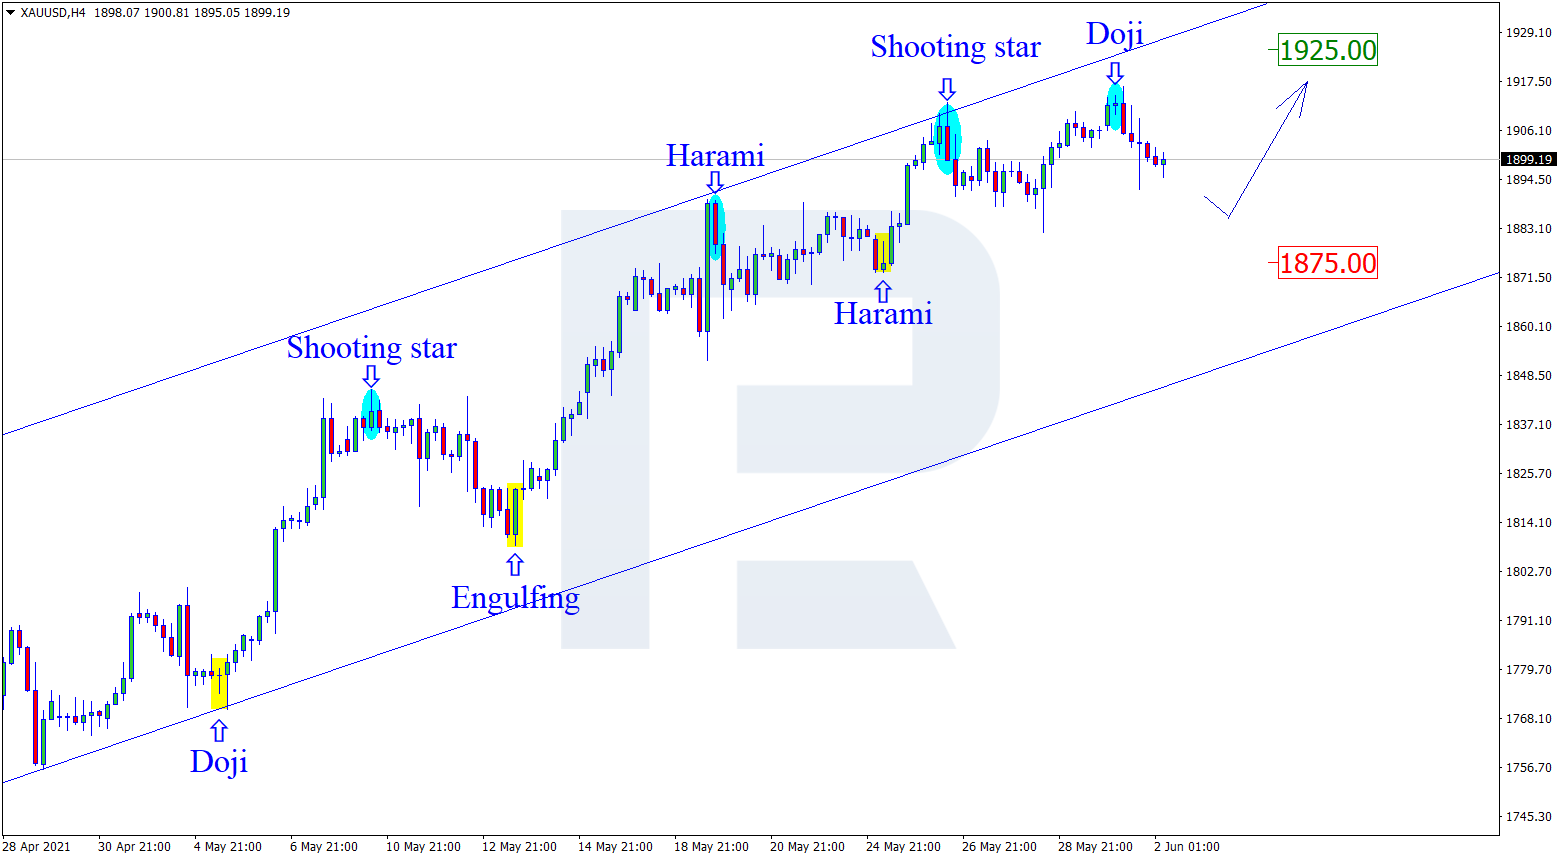
As we can see in the H4 chart, the correction continues. After forming several reversal patterns, such as Doji, close to the resistance level, XAUUSD is reversing and may form a new pullback to reach the support area at 1875.00. At the same time, an opposite scenario implies that the price may continue growing towards 1925.00 without testing the support area.
NZDUSD, “New Zealand vs US Dollar”
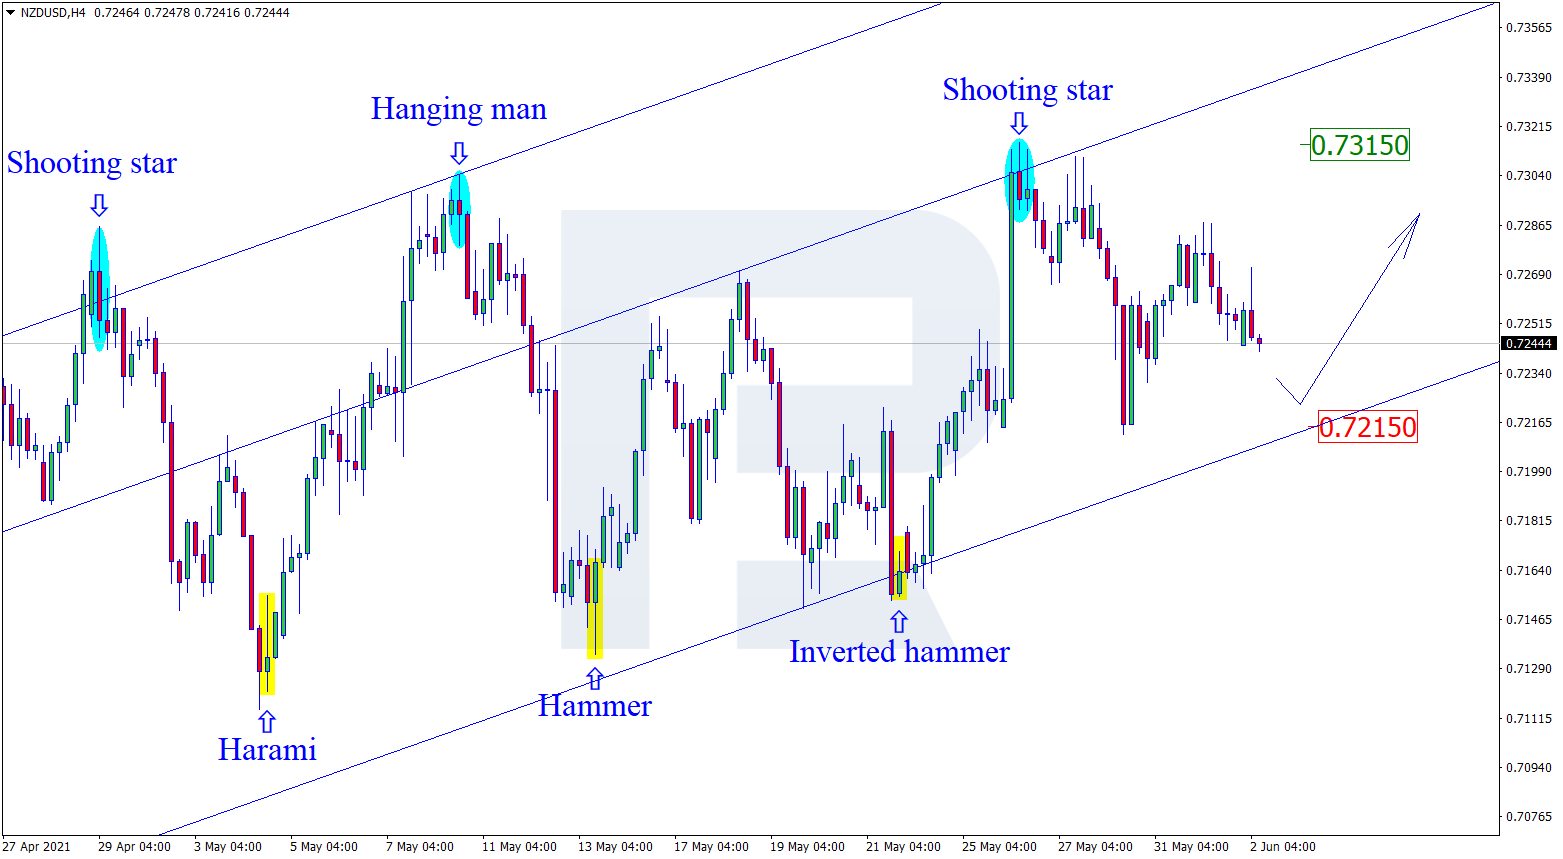
As we can see in the H4 chart, the correctional impulse continues. By now, NZDUSD has formed several reversal patterns, such as Shooting Star, close to the resistance level. The pattern materialization target may be the channel’s downside border at 0.7215. Later, the price may test this level, rebound from it, and resume moving upwards. However, an alternative scenario implies that the price may continue growing towards 0.7315 without testing the support level.
GBPUSD, “Great Britain Pound vs US Dollar”
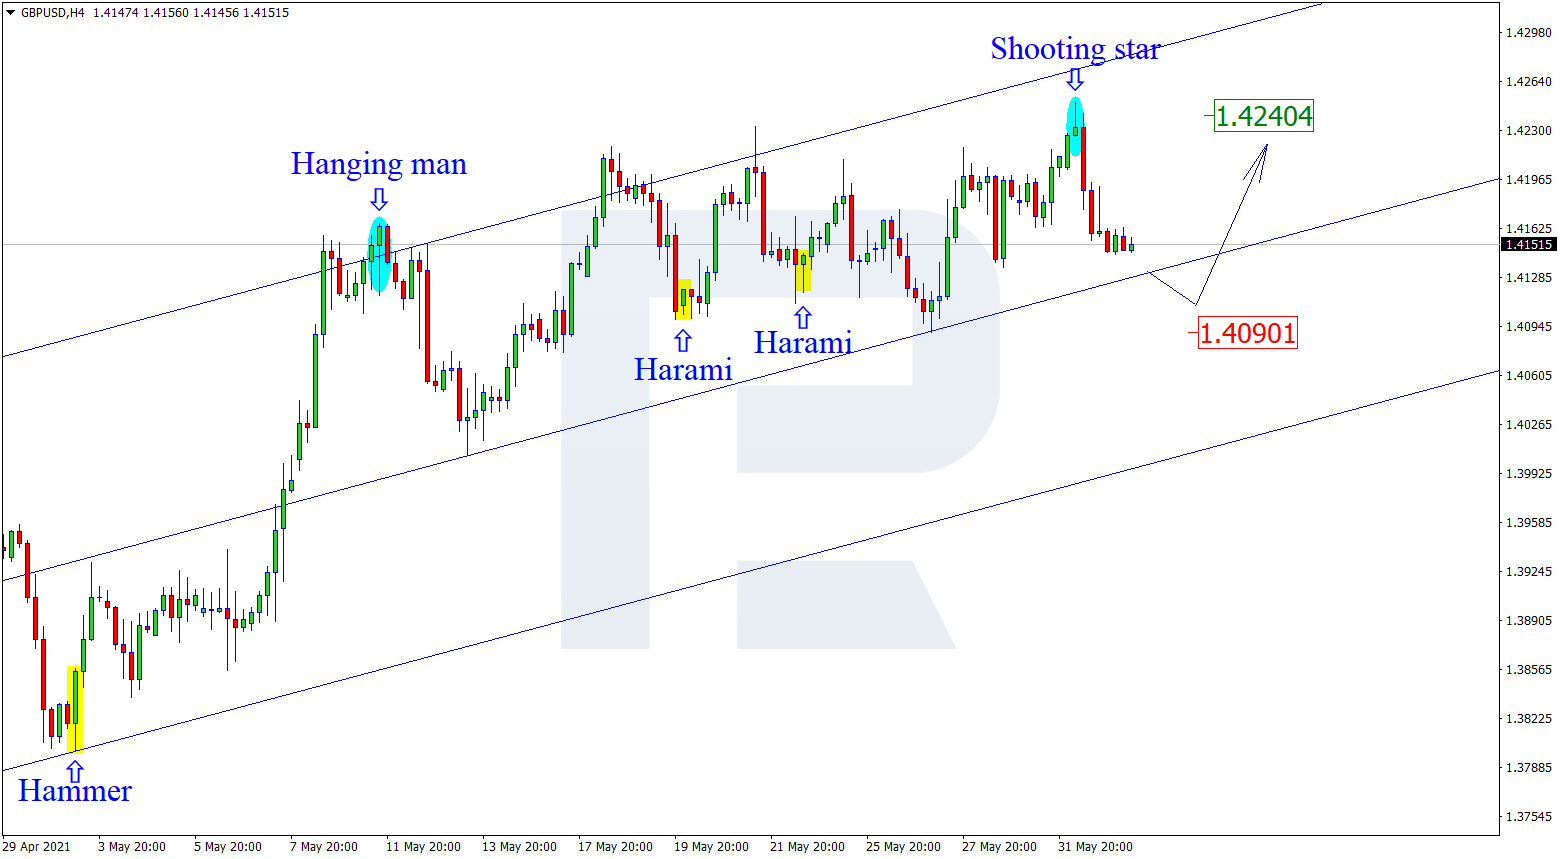
As we can see in the H4 chart, the asset is still correcting within the uptrend. By now, GBPUSD has formed several reversal patterns, such as Shooting Star, not far from the resistance area. At the moment, the pair may reverse and start a new pullback. In this case, the correctional target may be at 1.4090. However, the next upside target after the pullback may be at 1.4240. After breaking the resistance level, the instrument may boost its ascending tendency.
Attention! Forecasts presented in this section only reflect the author’s private opinion and should not be considered as guidance for trading. RoboForex LP bears no responsibility for trading results based on trading recommendations described in these analytical reviews.
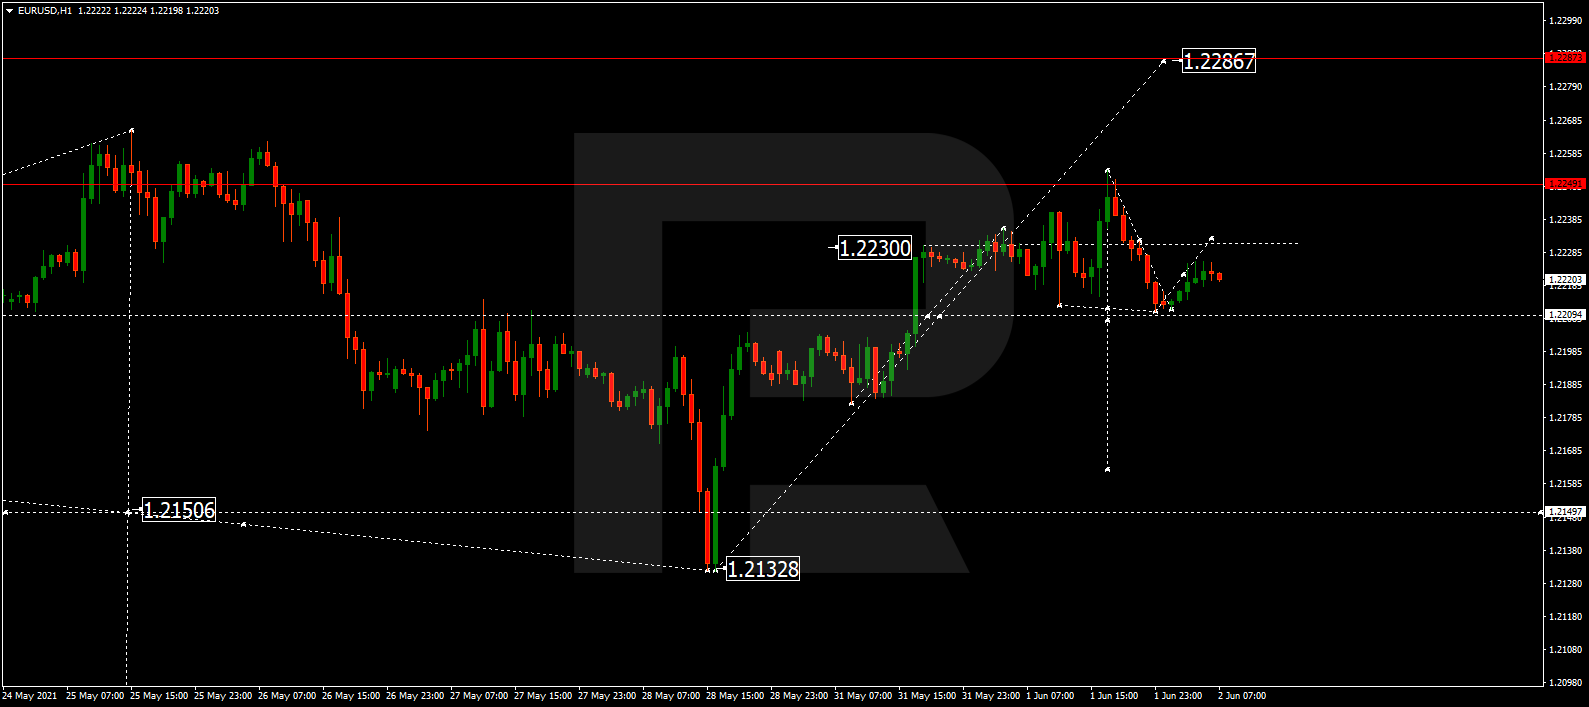
EURUSD is still consolidating around 1.2230. If later the price breaks this range to the upside, the market may expand it up to 1.2286; if to the downside – start a new decline to break 1.2150 and then continue the correction with the target at 1.2100.
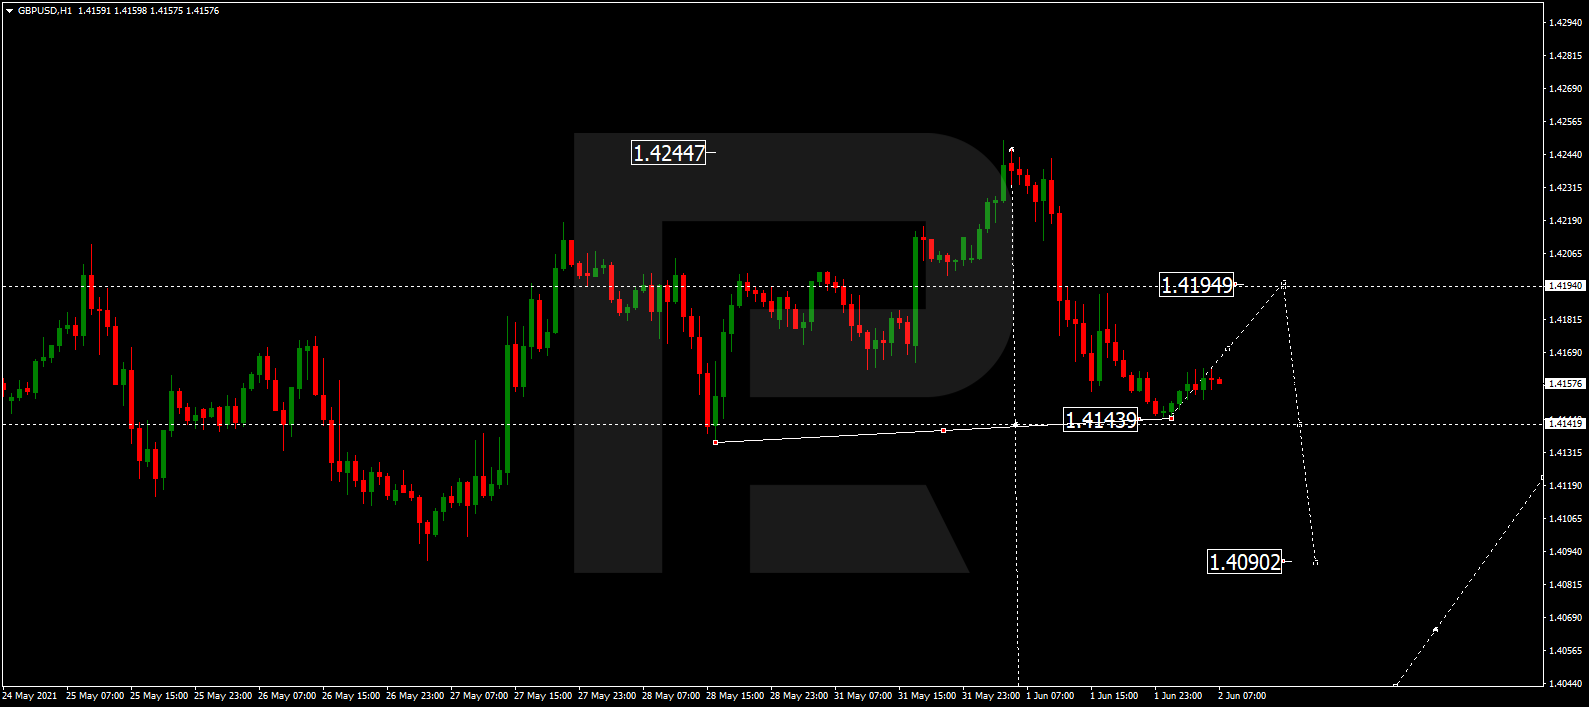
GBPUSD, “Great Britain Pound vs US Dollar”
After completing the descending impulse at 1.4144, GBPUSD is expected to form a new consolidation range above this level. Possibly, the pair may correct towards 1.4194. Later, the market may form a new descending structure with the target at 1.4090 or even reach 1.4035.
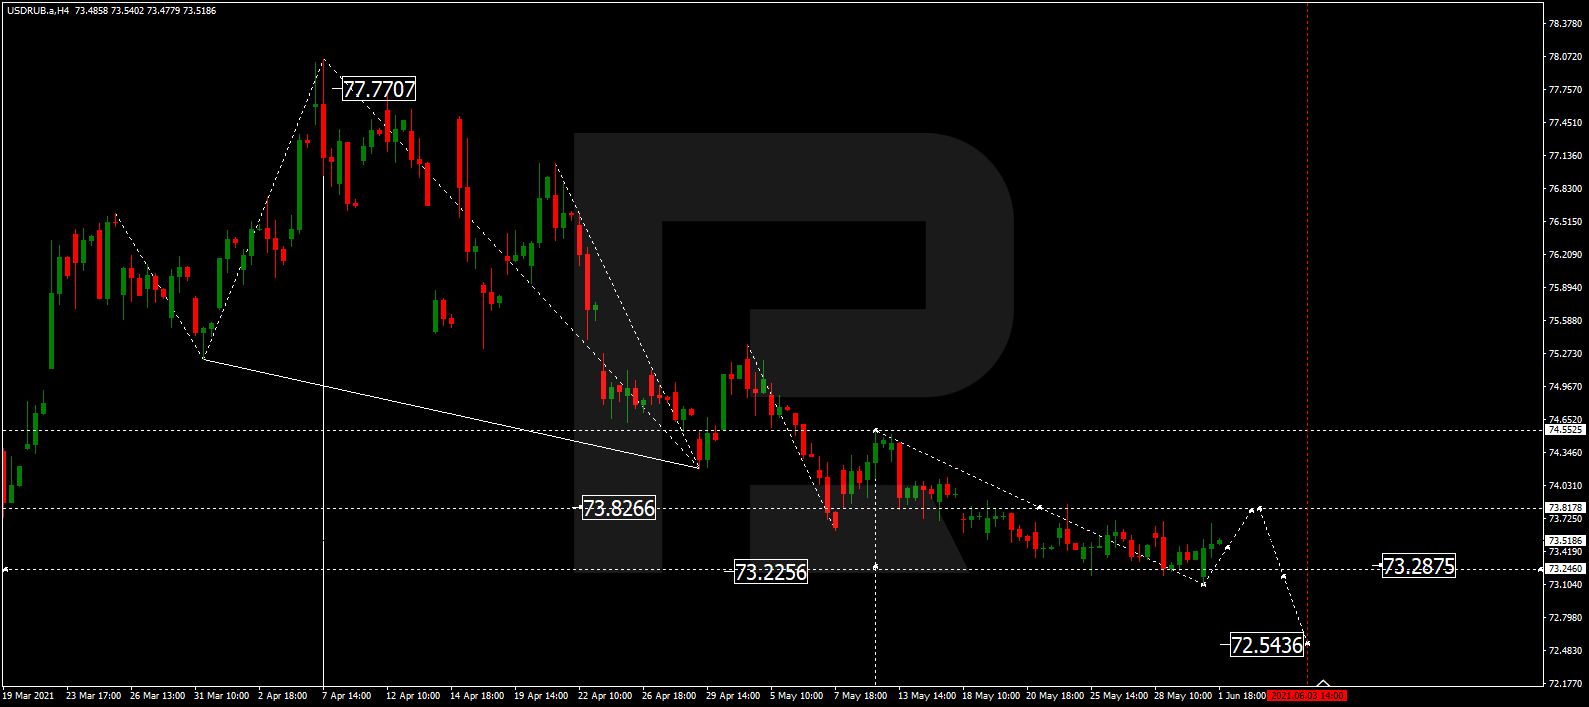
USDRUB, “US Dollar vs Russian Ruble”
USDRUB is still consolidating above 73.13 without any particular direction. Possibly, today the pair may correct towards 73.86 and then resume falling to reach 72.54. After that, the instrument may start another correction to test 73.13 from below and then resume trading downwards with the target at 72.00.
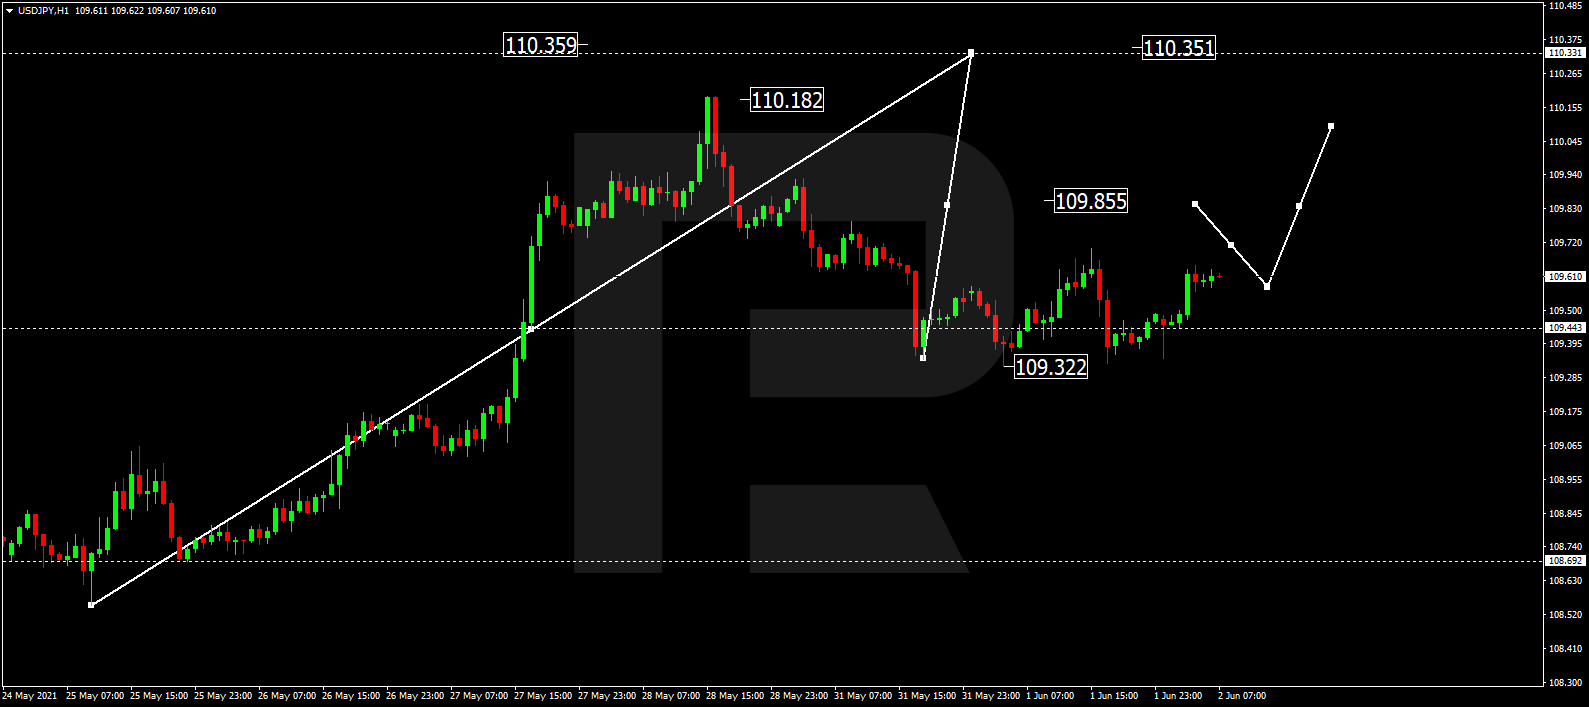
USDJPY, “US Dollar vs Japanese Yen”
After forming another consolidation range, this time above 109.32, USDJPY is trading to break it to the upside. Today, the pair may form one more ascending structure with the short-term target at 110.35.
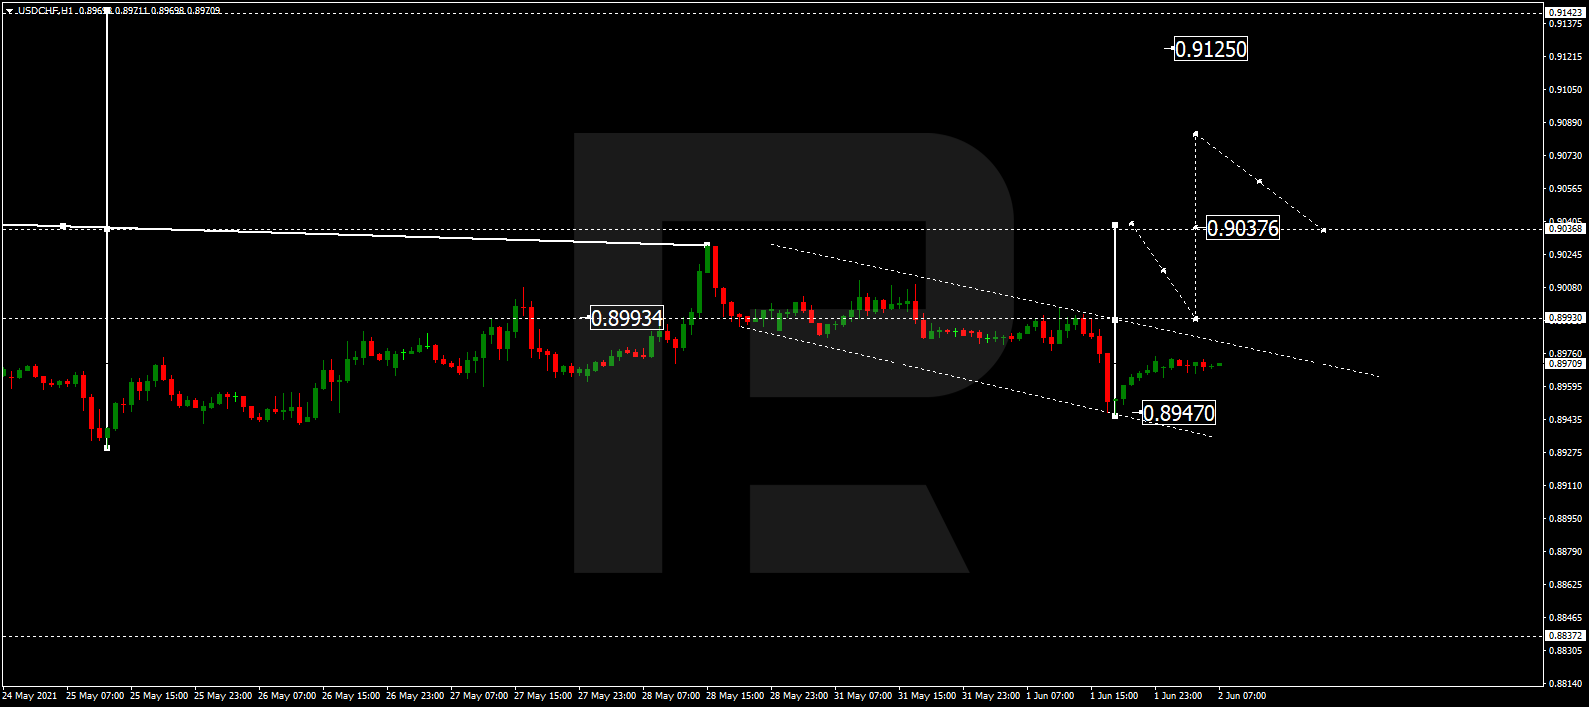
USDCHF, “US Dollar vs Swiss Franc”
After completing the correctional wave at 0.8950, USDCHF is growing to break 0.8993. Later, the market may continue trading upwards with the target at 0.90387 or even reach 0.9125.
AUDUSD, “Australian Dollar vs US Dollar”
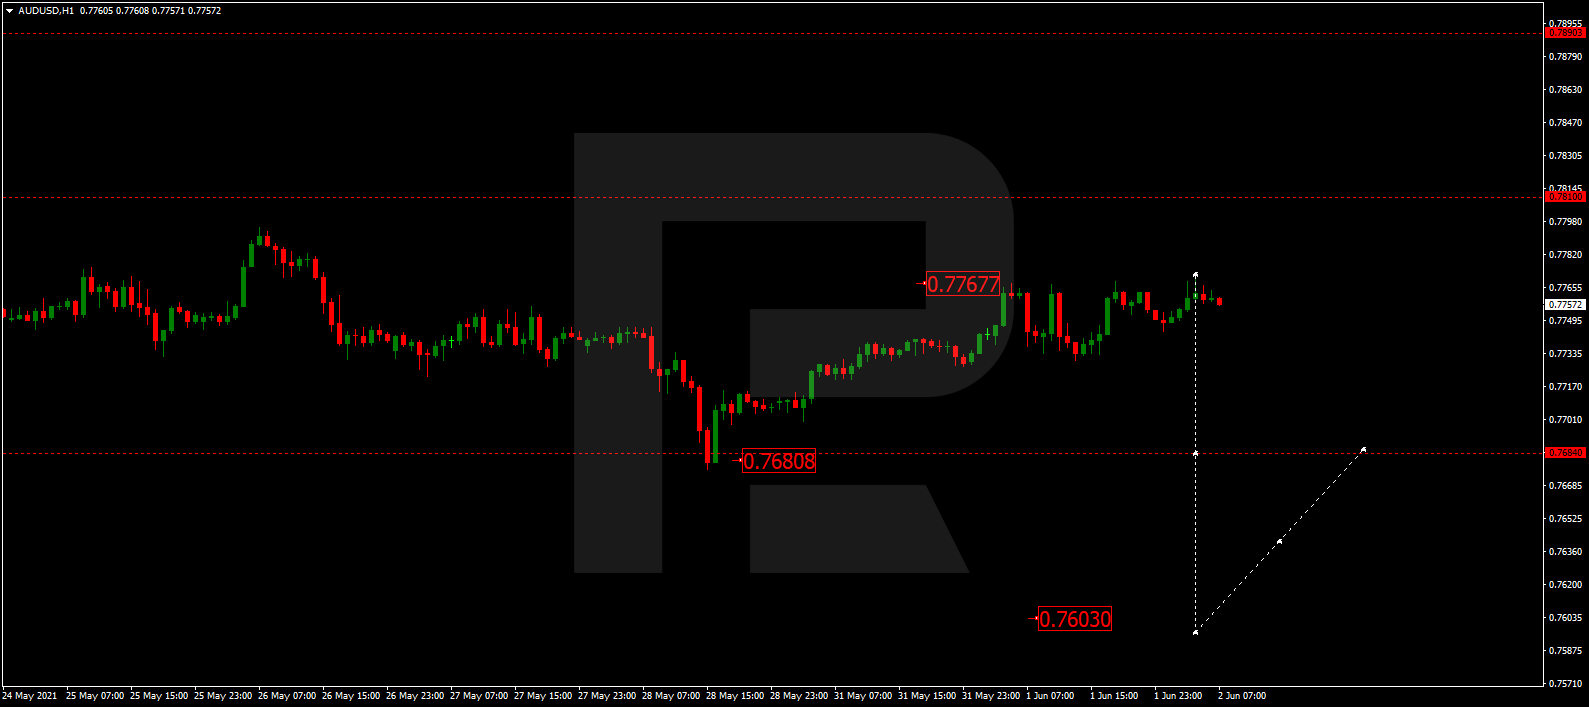
AUDUSD is still consolidating below 0.7767. Possibly, the pair may break the range to the downside and resume trading downwards with the short-term target at 0.7603.
BRENT
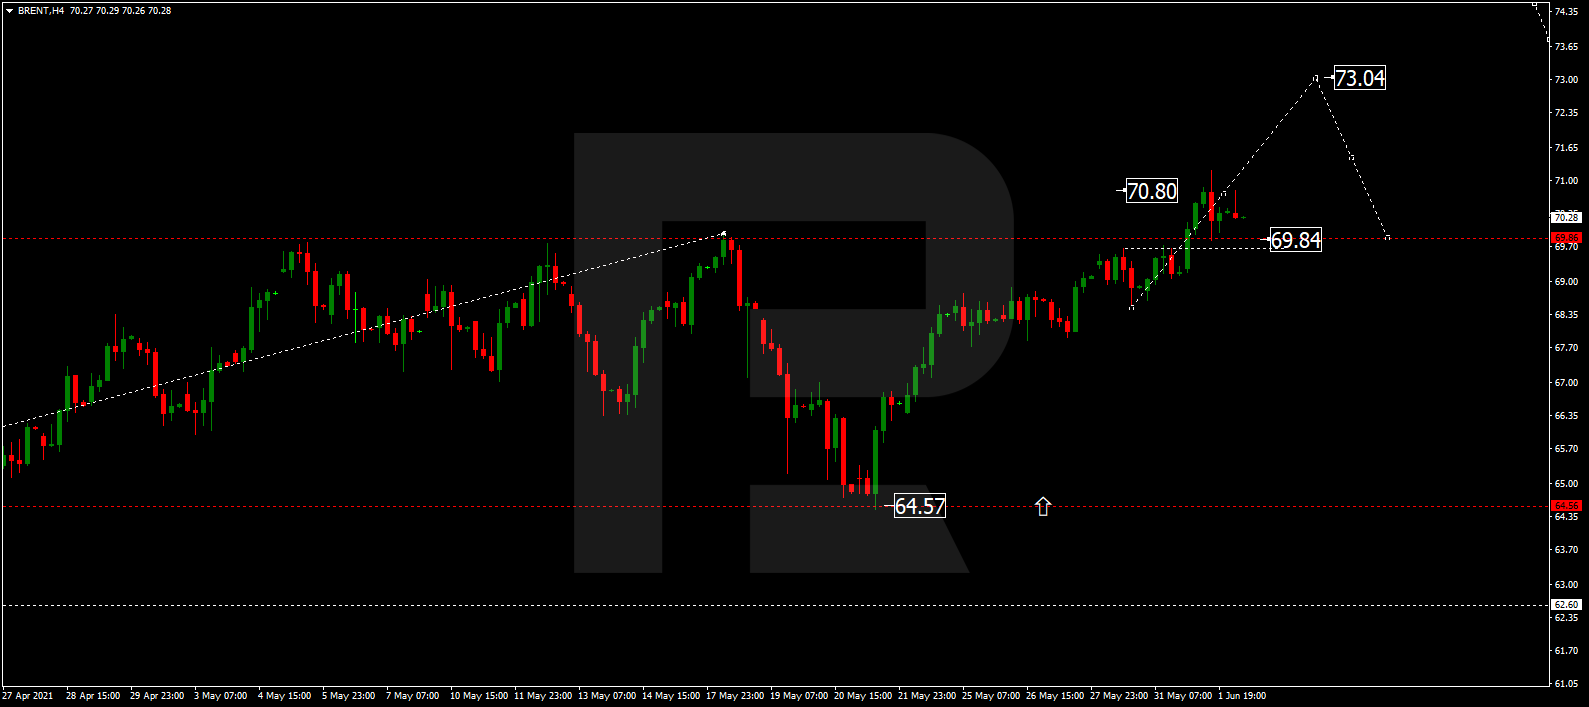
Brent has finished the ascending wave at 71.00. Today, the asset may correct towards 69.84 and then form one more ascending structure with the short-term target at 73.00, thus continuing the uptrend towards 75.00.
XAUUSD, “Gold vs US Dollar”
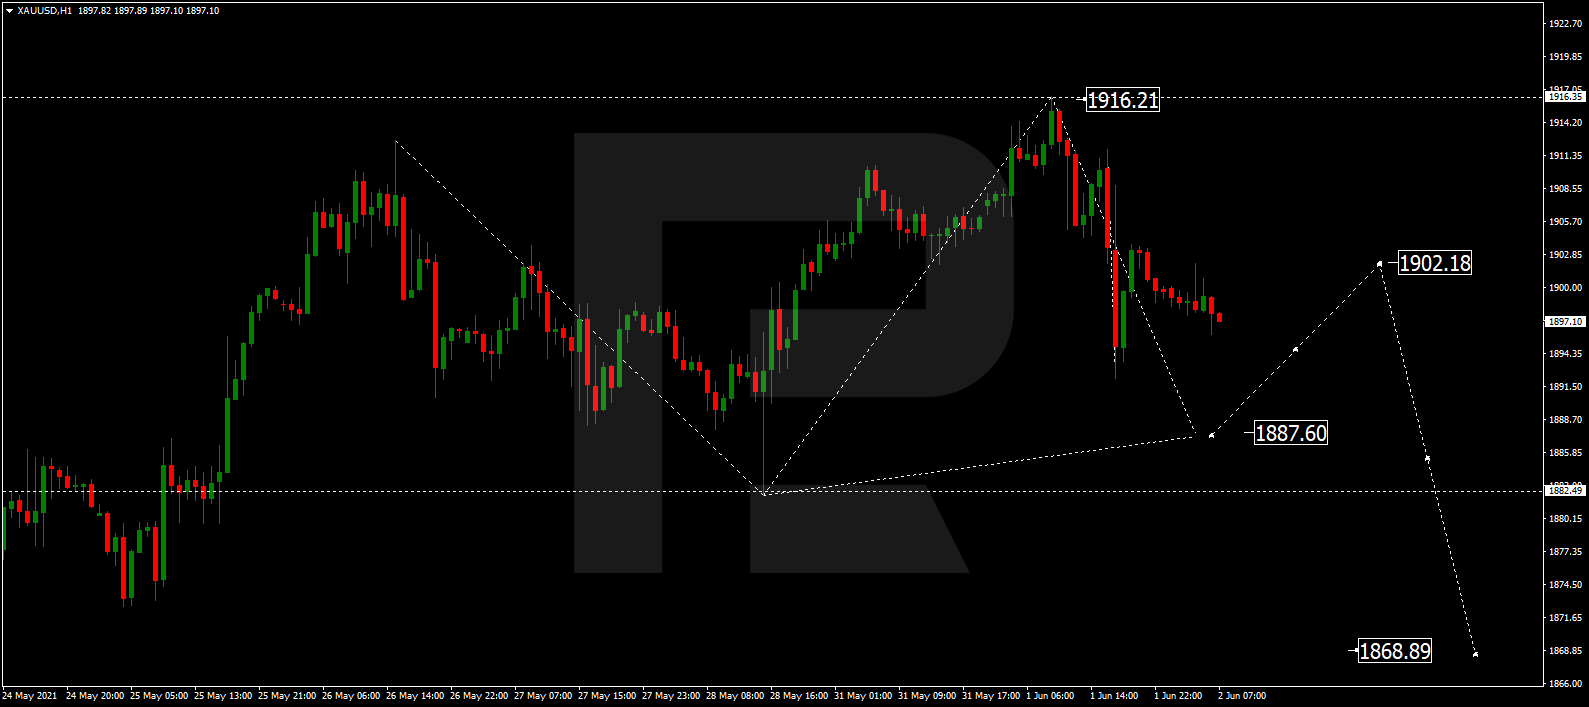
Gold is still consolidating around 1900.00; it has already expanded the range up to 1916.20. Today, the metal may form a new descending structure to reach 1887.60 and then start another correction with the target at 1902.00.
S&P 500
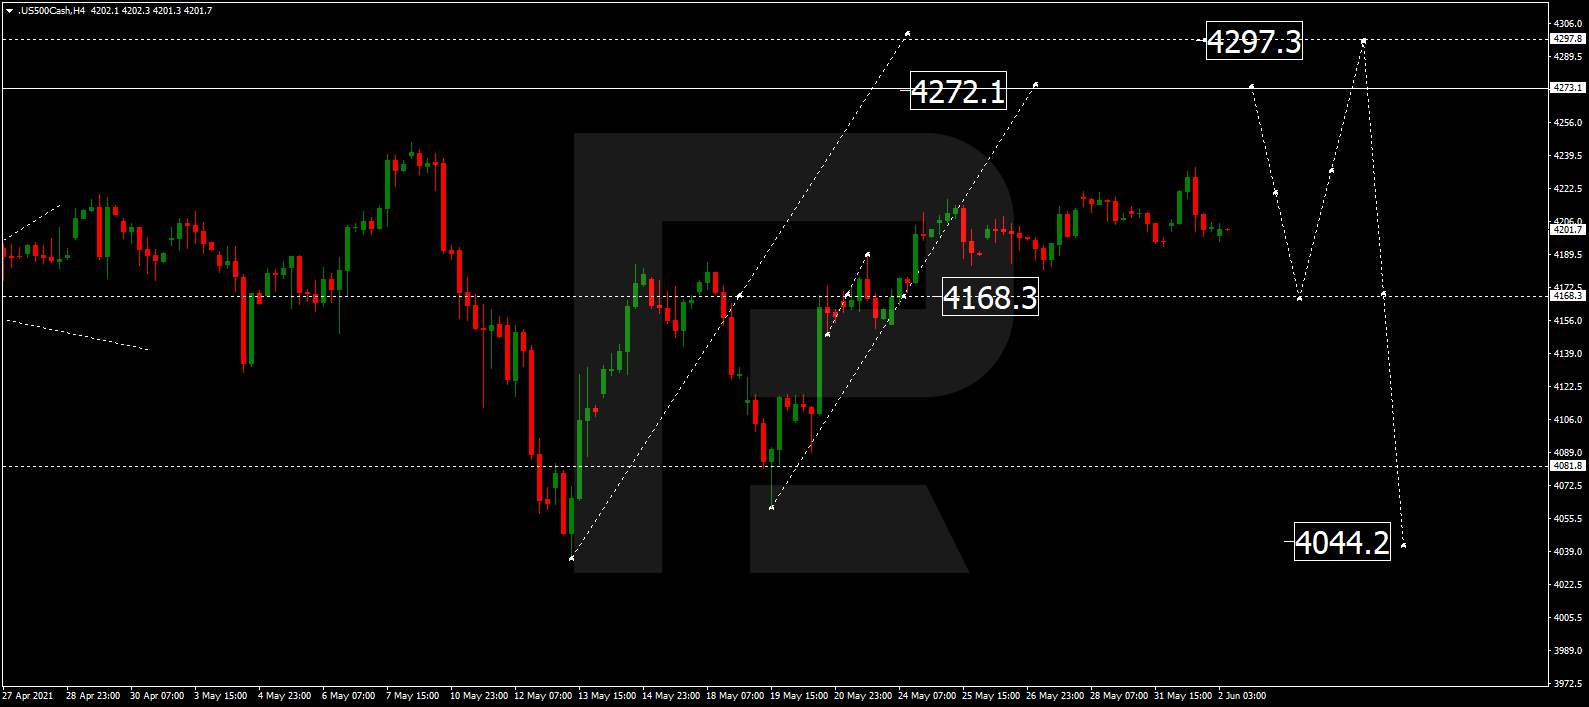
The S&P index is still consolidating around 4168.3 without any particular direction. Possibly, the asset may expand the range towards the short-term target at 4272.1. Later, the market may fall to reach 4168.3 and then resume trading upwards with the target at 4297.3.
Attention! Forecasts presented in this section only reflect the author’s private opinion and should not be considered as guidance for trading. RoboForex LP bears no responsibility for trading results based on trading recommendations described in these analytical reviews.
The EUR/USD currency pair failed to break through the resistance level of 1.2243, and the price was slightly corrected, mainly due to the strengthening of the dollar index. Short-term support for the US currency was provided by the US Treasury Department, which held several treasury bond auctions yesterday. Such actions usually lead to the withdrawal of liquidity from the financial system, which is good for the dollar index.
Trading recommendations
Support levels: 1.2205, 1.2168, 1.2138, 1.2115, 1.2074, 1.2026, 1.2002, 1.1957
Resistance levels: 1.2243, 1.2311
The trend remains bullish. The price is trading above the moving average. The divergence on the MACD indicator has already been executed. Under such market conditions, it is better to look for buy trades from the support levels, relying on the continuation of the price growth.
Alternative scenario: if the price breaks down through the 1.2168 support level and fixes below, the general uptrend is likely to be broken.
There is no news feed for today.
The GBP/USD currency pair
Technical indicators of the currency pair:
Prev Open: 1.4205
Prev Close: 1.4147
% chg. over the last day: -0.41%
Yesterday, the British pound unexpectedly fell on the impulse movement and returned to the wide corridor, forming a false break area above. The price also broke through the local uptrend line. The main reason for the fall is the strengthening of the dollar index. Also, the Governor of BoE Andrew Bailey said yesterday that economic recovery in the Foggy Albion could cause a substantial rise in inflation and lead to the tightening of monetary policy the following year.
Trading recommendations
Support levels: 1.4110, 1.4075, 1.3996, 1.3913,1.3835, 1.3801, 1.3756, 1.3690
Resistance levels: 1.4207, 1.4338
For the GBP/USD currency pair, the trend remains bullish. The price is trading near the moving average, and the MACD indicator is in the negative zone. Under such market conditions, traders are better to look for buy trades from the nearest support levels. With a high probability, the price will go down to the lower boundary of the wide range of 1.4110-1.4207.
Alternative scenario: if the price breaks through the 1.4075 support level and consolidates below, the bullish scenario is likely to be canceled.
There is no news feed for today.
The USD/JPY currency pair
Technical indicators of the currency pair:
Prev Open: 109.55
Prev Close: 109.48
% chg. over the last day: -0.06%
On Tuesday, the USD/JPY currency pair formed a narrow flat. It is easy to notice that the buyers are pushing the price higher, relying on a breakout. If the price fixes above the resistance level of 109.64, the local upward momentum will resume.
Trading recommendations
Support levels: 109.28, 109.00, 108.66, 108.44, 108.19, 107.77, 107.47
Resistance levels: 109.64, 109.95, 110.51
At the moment, the mid-term trend is bullish. The price is above the moving average and the priority change level of 109.00. Under such market conditions, traders are better to look for buy trades from the support levels, relying on the continuation of the price growth.
Alternative scenario: if the price falls below 109.00, the general downtrend is likely to resume.
There is no news feed for today.
The USD/CAD currency pair
Technical indicators of the currency pair:
Prev Open: 1.2058
Prev Close: 1.2070
% chg. over the last day: +0.10%
Yesterday, the USD/CAD currency pair tried to break through the support level of 1.2032 but failed to consolidate below. Buyers sharply pushed the price back, forming a false breakdown of the level.
The local downtrend line has not yet been broken, so the trend remains bearish. Given that the price formed a false breakdown and returned to the moving average on an impulse move, buyers behave more aggressively. Under such market conditions, traders are better to look for both sell trades from the nearest resistance levels and buy trades from the support levels, but only on intraday timeframes within the upside momentum. But it should not be missed that the price is inside a wide corridor of 1.2032-1.2137.
Alternative scenario: if the price breaks out through the 1.2137 resistance level and fixes above, a local corrective uptrend is likely to form.
This article reflects a personal opinion and should not be interpreted as an investment advice, and/or offer, and/or a persistent request for carrying out financial transactions, and/or a guarantee, and/or a forecast of future events.
The US stock indices closed mixed yesterday. On Tuesday, the Dow Jones rose by 0.13%, the S&P 500 decreased by 0.05%, the NASDAQ Composite fell by 0.09%. The energy, financial and real estate sectors became the growth leaders. Among the Dow Jones companies, Boeing (+3.12%) and Dow Inc (+2.8%) showed the biggest gains. However, the boom in meme stocks continues. For example, BlackBerry gained 14.8% yesterday.
Positive statistics from the eurozone stimulated the growth of Western European stock indices. The unemployment rate is falling, indexes of business and consumer confidence are increasing and the PMI also shows an upward dynamic. All this indicates that the European economy is recovering.
Gold futures declined in the US trading session. Yesterday, the US Treasury Department held an auction on Treasury bonds distribution, which led to a liquidity withdrawal from the financial system. All this influenced a temporary strengthening of the dollar index. Recently there has been a very noticeable inverse correlation between gold and the US dollar.
As expected, OPEC+ representatives did not change their plans to increase oil production. Thanks to the economic recovery and balanced OPEC+ policies, oil prices have risen by more than 30% this year. The issue of Iranian oil is still open.
Asian markets closed in the positive zone on Tuesday. Japan’s Nikkei added 0.48% and Australia’s ASX 200 gained 0.77% thanks to the positive GDP data (GDP up 1.8% QoQ).
This article reflects a personal opinion and should not be interpreted as an investment advice, and/or offer, and/or a persistent request for carrying out financial transactions, and/or a guarantee, and/or a forecast of future events.
The first big data point for markets this week has helped the dollar recover with the US ISM beating expectations yesterday, increasing to 61.2 in May from 60.7. New orders also jumped and supplier deliveries are at the highest level since 1974. It seems the overheating economy is not easing up just yet, though many economists expect that may happen during the second half of this year.
Equity markets were generally higher but the US closed mixed with value stocks such as financials and industrials back as the leaders while tech and healthcare fell. Asian stocks, aside from Japan touched a three-month peak before profit-taking in recently strong Chinese markets pulled it lower. Momentum has clearly ebbed from stock markets as investors worry that a stronger-than-expected rebound means sooner-than-expected monetary policy tightening.
The spotlight has been shining once again on gains in retail-investor driven “meme stocks”. AMC Entertainment rose more than 20% and is up more than 1,400% for the year while the infamous Gamestop surged over 12%. Short sellers are suffering as the Reddit crowd redirect their focus on these heavily shorted companies and move away from cryptocurrencies.
Booming commodities help European markets
Base metals are on the march again as copper closes above $10,000 for a third straight day and iron ore futures rebound. The OPEC+ meeting also passed with a supply increase in July, as agreed at a meeting in early April and the market has less concern over future Iranian supply as demand gathers pace through the summer months. Oil has pushed to recent highs with commodities in general seen as a good hedge against inflation.
Big commodity companies are enjoying this resurgence in commodity prices, with European stock market posting new record highs. The eurozone’s factory activity also helped yeseterday, rising to 63.1 in May, the highest since the survey began in June 1997.
Virus and reopening key for GBP
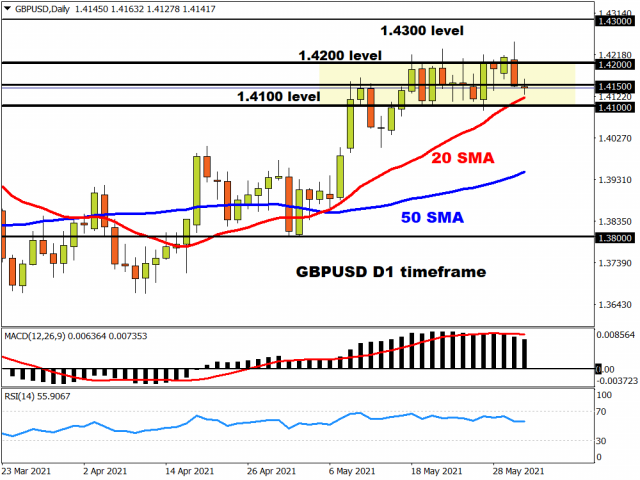
GBP/USD climbed to its highest level since April 2018 yesterday morning following a broadly weaker dollar tone and comments from the Bank of England’s deputy Governor acknowledging the potential for more sustained inflation and increasing optimism about the economic recovery. But dollar buying and increasing concern that the grand reopening in the UK slated for June 21 could be delayed due to the Indian Covid variant saw GBP sink back below 1.4150.
PM Johnson is due to give a press briefing later today so the threatened sterling breakout is on ice. Support rests at the bottom of the recent range around 1.41 while the bulls await a sustained push above 1.42 to continue the 15-month bullish trend.
Disclaimer: The content in this article comprises personal opinions and should not be construed as containing personal and/or other investment advice and/or an offer of and/or solicitation for any transactions in financial instruments and/or a guarantee and/or prediction of future performance. ForexTime (FXTM), its affiliates, agents, directors, officers or employees do not guarantee the accuracy, validity, timeliness or completeness, of any information or data made available and assume no liability as to any loss arising from any investment based on the same.
This Friday’s US nonfarm payrolls data takes centre stage in this week’s global economic calendar.
And the US dollar is set to be the conduit for the market’s reaction to that crucial piece of information amid the ongoing debate on the US inflation outlook.
Why is the US jobs report so important for markets?
In short, investors how the US economy is faring, as it continues shedding off the ill-effects from the pandemic. As more businesses reopen, more people have jobs. As employees’ incomes are restored, that should lead to more spending. More consumer spending could trigger higher consumer prices, which is also known as ‘inflation’.
However, consumer prices that run too high too fast could have a negative impact on economic growth. And herein lies the tricky bit for policymakers.
The US Federal Reserve has been saying for months that the inflation that’s showing up in recent economic data are expected to be “transitory”. However, if the data over the coming months shows that inflation is roaring higher and not abating as the central bank expects, then the Fed may have to jump in and ease up on the support measures that they’ve rolled out in the markets, such as purchasing bonds every month and keeping US interest rates near-zero.
Hence, markets are already trying to pre-empt the Fed’s next move. Another strong showing in the US labour market could mean stronger inflationary pressures, which could then hasten the Fed’s tapering of its support measures.
If such a move comes as a surprise for investors and traders, that could lead to volatility across various asset classes, including stocks, Treasuries, and currencies.
That’s the broader context surrounding this Friday’s nonfarm payrolls data.
What are markets expecting?
Markets are forecasting that 653,000 jobs were added in the US last month.
This 653k figure is the result of some readjusted expectations following April’s shockingly low jobs print, which came in at a measly 266,000 compared to the median estimate of about one million jobs added. That dismal print underscores the notion that the US economic recovery will not be plain sailing all the way into the post-pandemic era.
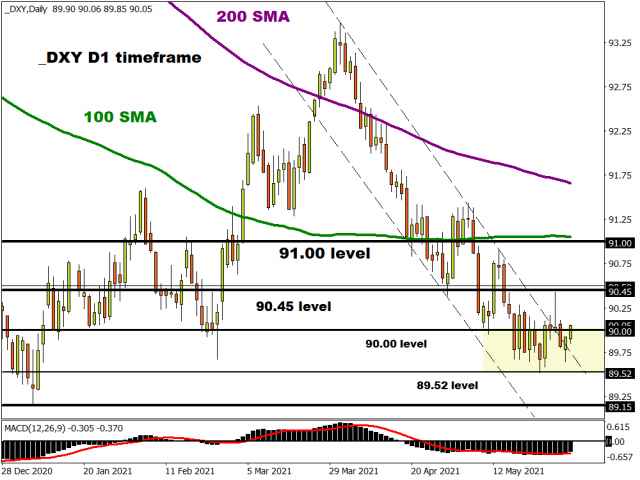
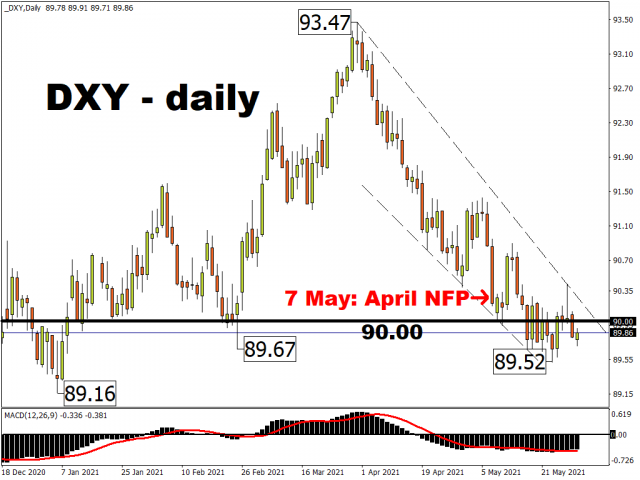
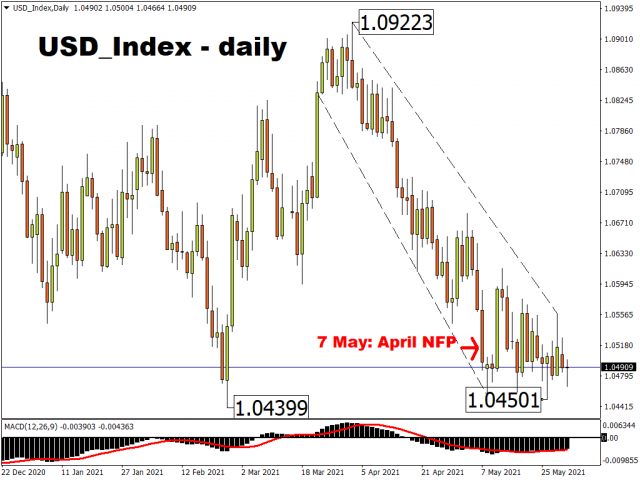
Recall that the benchmark dollar index (DXY) fell by 0.79% on 7 May, on the back of that dismal NFP report. That was the DXY’s biggest single-day drop since 5 November 2020, amid the uncertainties in the aftermath of the US presidential election.
That 7 May reaction in the buck exposes how sensitive the market is to the latest readings on the US labour market. Since then, the DXY has fallen by a further 0.44%, keeping its Q2 downtrend intact.
However, the drop was not as pronounced as another US Dollar index, which has different weightage for its members in contrast to the DXY. This US Dollar index is an equally-weighted basket comprising the following G10 currency pairs:
The drop in this USD index was less pronounced; 0.62% following that negative surprise on 7 May. Since then, it has held relatively steady, with current prices less than 0.06% away from the 7 May close.
Another dose of pessimism after the upcoming NFP report could trigger another broad-based decline in the greenback, potentially dragging this USD index into sub-1.045 domain to test a new year-to-date low.
Given the uncertainty surrounding what the official nonfarm payrolls would be this Friday, the US dollar may not see a sizeable move over the coming days, barring an unexpected market-moving event. Then again, the dollar also may offer a tepid response if the official figures come close to the expected 653,000 figure. Between now and Friday, investors worldwide will also get more clues on the state of the US jobs market from the ADP employment figures and the weekly jobless claims, both due this Thursday, 3 June.
Still, the resultant drama after that 7 May nonfarm payrolls shocker would still be lingering on the markets’ collective mind. Another print that wildly deviates from market expectations this coming Friday could jolt the greenback once more.
Disclaimer: The content in this article comprises personal opinions and should not be construed as containing personal and/or other investment advice and/or an offer of and/or solicitation for any transactions in financial instruments and/or a guarantee and/or prediction of future performance. ForexTime (FXTM), its affiliates, agents, directors, officers or employees do not guarantee the accuracy, validity, timeliness or completeness, of any information or data made available and assume no liability as to any loss arising from any investment based on the same.
Oil prices jumped to a 2-year high yesterday, completing a record 520% move higher from last year’s pandemic low in April.
The Organization of the Petroleum Exporting Countries (OPEC) and other oil-producing nations, announced a boost in output for July to 2.1 million barrels per day.
Much of this was already expected as this was an agreement made in April. However, they have kept market participants waiting for what will happen beyond July as the group, led by Saudi Arabia, aims to balance a surge in demand with the potential for higher Iranian oil output.
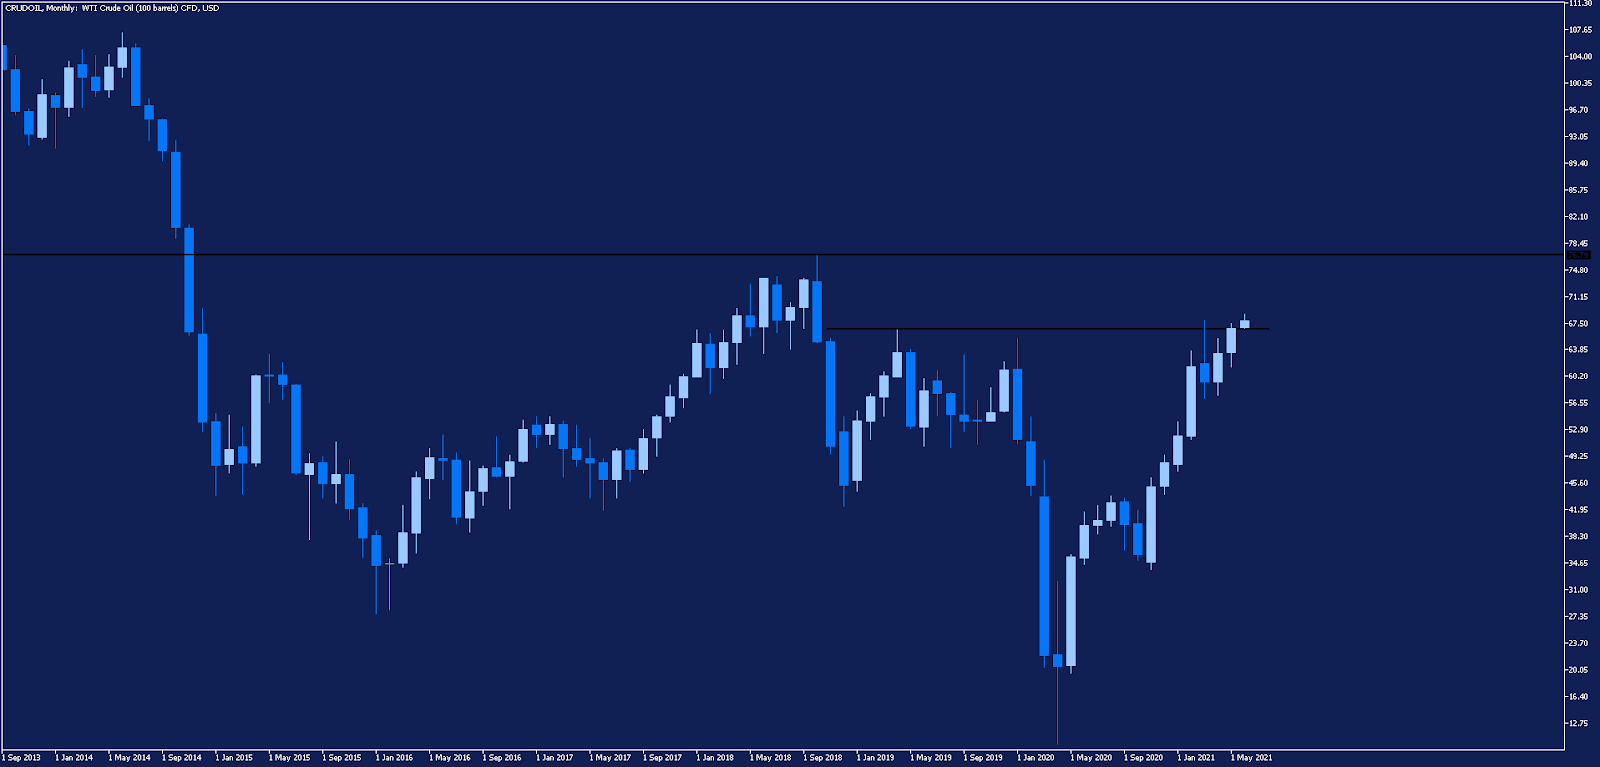
Source: Admirals MetaTrader 5, CRUDOIL, Monthly – Data range: from Sep 1, 2013, to Jun 1, 2021, performed on Jun 1, 2021, at 8:30 pm GMT. Please note: Past performance is not a reliable indicator of future results.
From a technical analysis perspective, oil prices have just broken a key horizontal resistance line around ~$67.00. This was a multi-year high before being broken yesterday.
While oil prices have been surging higher for some time, there is potential for the price to run further if it can hold above this level.
The next major level of resistance is the $76.00 price level as shown by the top black horizontal resistance line in the chart above.
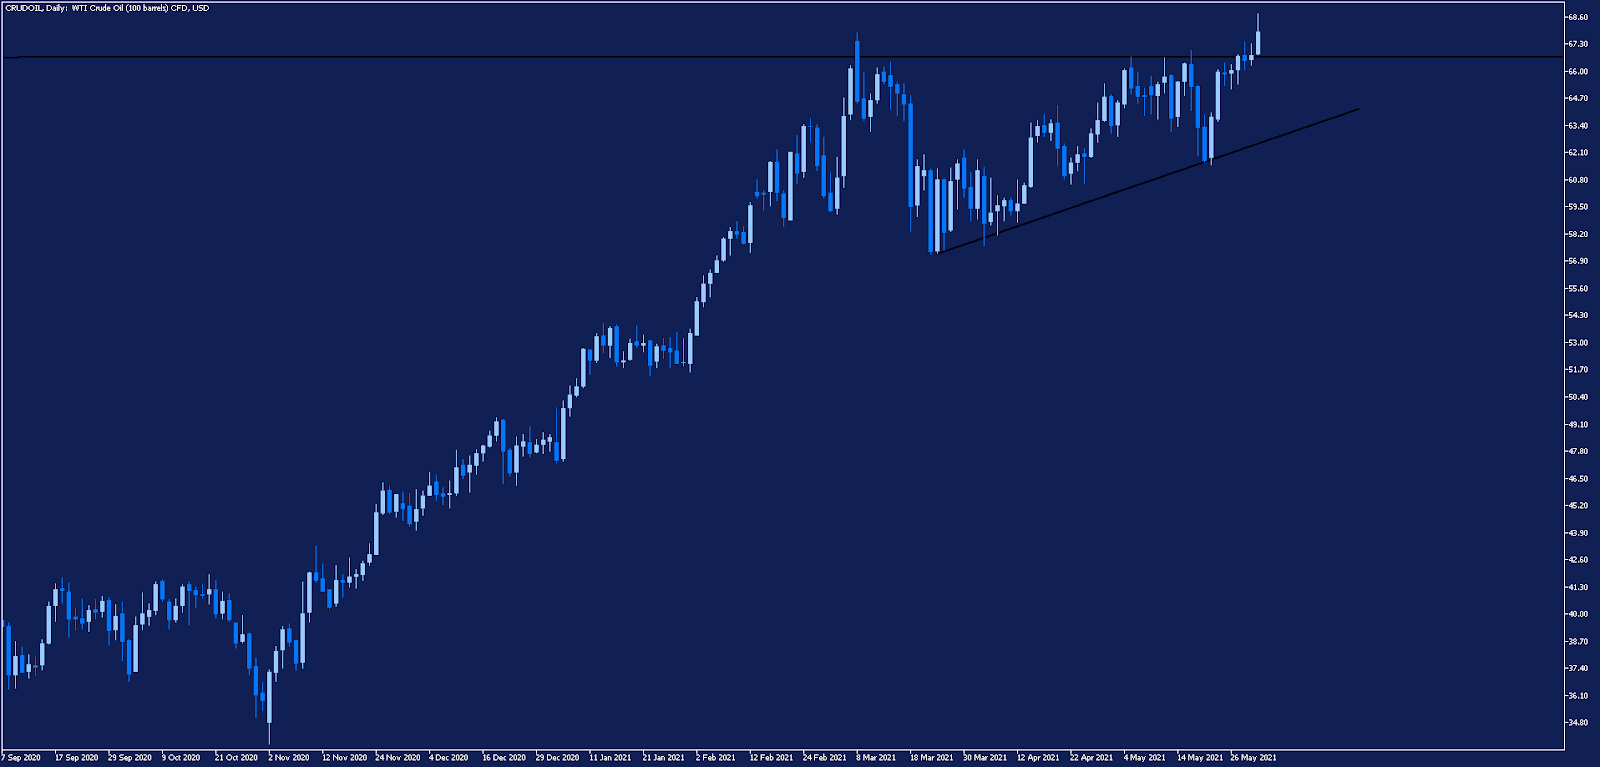
Source: Admirals MetaTrader 5, CRUDOIL, Daily – Data range: from Sep 7, 2020, to Jun 1, 2021, performed on Jun 1, 2021, at 8:30 pm GMT. Please note: Past performance is not a reliable indicator of future results.
However, if this break higher proves to be a false breakout then the price could fall back to the lower ascending support level, as shown in the chart above.
This would mark a failed break of the ascending triangle pattern that has formed, signifying a potential break from the lower support level.
Either way, oil prices will remain at the top of most traders’ watchlists.
Did you know that you can use the Trading Central Technical Ideas Lookup indicator to find actionable trading ideas on thousands of different markets?
Start your free download by clicking on the banner below:
INFORMATION ABOUT ANALYTICAL MATERIALS:
The given data provides additional information regarding all analysis, estimates, prognosis, forecasts, market reviews, weekly outlooks or other similar assessments or information (hereinafter “Analysis”) published on the websites of Admiral Markets investment firms operating under the Admiral Markets trademark (hereinafter “Admiral Markets”) Before making any investment decisions please pay close attention to the following:
This is a marketing communication. The content is published for informative purposes only and is in no way to be construed as investment advice or recommendation. It has not been prepared in accordance with legal requirements designed to promote the independence of investment research, and that it is not subject to any prohibition on dealing ahead of the dissemination of investment research.
Any investment decision is made by each client alone whereas Admiral Markets shall not be responsible for any loss or damage arising from any such decision, whether or not based on the content.
With view to protecting the interests of our clients and the objectivity of the Analysis, Admiral Markets has established relevant internal procedures for prevention and management of conflicts of interest.
The Analysis is prepared by an independent analyst, Jitan Solanki (analyst), (hereinafter “Author”) based on their personal estimations.
Whilst every reasonable effort is taken to ensure that all sources of the content are reliable and that all information is presented, as much as possible, in an understandable, timely, precise and complete manner, Admiral Markets does not guarantee the accuracy or completeness of any information contained within the Analysis.
Any kind of past or modeled performance of financial instruments indicated within the content should not be construed as an express or implied promise, guarantee or implication by Admiral Markets for any future performance. The value of the financial instrument may both increase and decrease and the preservation of the asset value is not guaranteed.
Leveraged products (including contracts for difference) are speculative in nature and may result in losses or profit. Before you start trading, please ensure that you fully understand the risks involved.
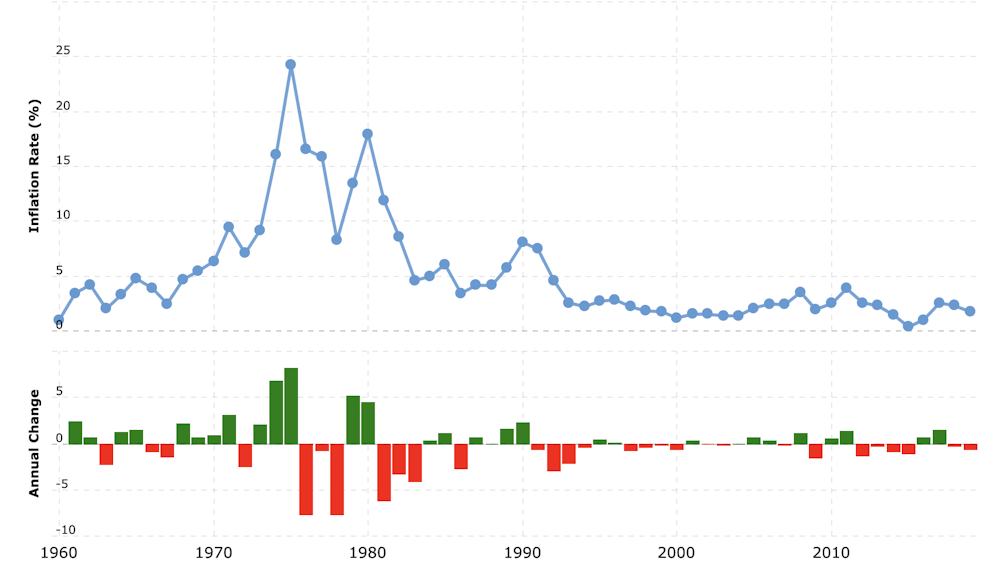
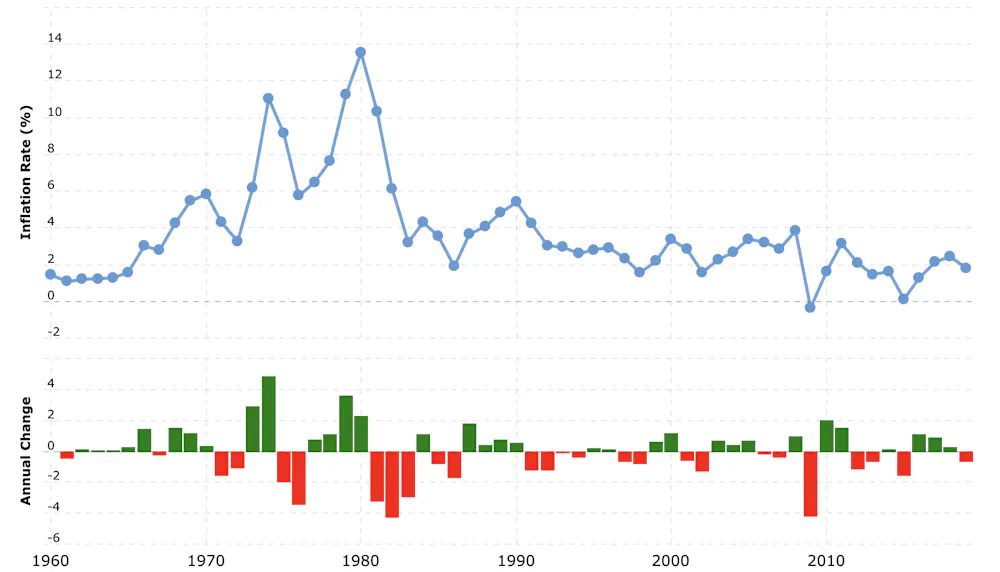
– The US Federal Reserve has just reassured the markets that it doesn’t expect inflation to get out of hand in the coming months. It comes as concerns about serious inflation damaging the global economy have reached fever pitch, particularly since recent Labor Department data showed that American inflation rose 4.2% over the 12 months ended April – the highest since the global financial crisis of 2007-09. In the euro area, inflation seems certain during the rest of this year to break out above the European Central Bank target of “close to but below 2%”.
Central bankers on both sides of the Atlantic say that these price rises are a temporary consequence of the whiplash effect of the COVID-19 pandemic on demand. Supply chains in everything from commodities to semiconductors have been disturbed by demand first collapsing and then surging back, making prices very volatile. On this rationale, inflation will settle down once the pandemic recedes.
Critics point to the risks of price pressures setting off a chain reaction where everyone expects future price rises, causing a true inflationary episode where prices persistently increase across the board.
This debate about the near-term outlook is matched by an equally lively debate about long-term inflation, relating to drivers such as the effect of baby boomers retiring, China’s changing labour force, automation and so on. So who is right in all this? Are the inflation numbers a blip or are we seeing a gathering storm?
Lessons of the 2010s
In Remembering Inflation, a book I published in 2013, I attempted to weave together various strands of this subject by looking at the breakthroughs in economists’ thinking about the causes and cures of inflation inspired by the “stagflation” of the 1970s, where inflation and unemployment both sharply increased.
My timing with that book was poor. The global economy’s faltering recovery from the global financial crisis was characterised by the opposite problem – deflation – where people expect prices to fall. As overstretched firms and households retrenched during the early 2010s, it should have fallen to governments to generate needed demand by ramping up public spending. Instead, fashionable notions of balancing the books using austerity got in the way.
Central banks were left to do the heavy lifting through cutting headline interest rates and using unconventional monetary policies like quantitative easing (QE) – that is, “printing money” – to buy large quantities of government bonds and other financial assets.
This helped to drive down long-term interest rates – even into negative territory in Europe – making things like mortgages and business loans cheaper. Yet the only “inflation” that resulted was rising asset prices in everything from property to stocks and shares. It made the rich richer, engendering even wider inequalities than before.
All the while, official consumer price inflation – which refers to the average change in prices of a basket of specific household goods – remained persistently below the 2% level targeted by the major central banks. According to what is known as the Phillips curve, inflation should have been stimulated by the fact that unemployment fell in countries such as the UK, but it turned out this relationship had been suspended.
One reason – particularly apparent in the US – was that the falling rate of unemployment was flattered by increasing numbers of people giving up looking for work and dropping out of the labour force altogether. This was a symptom of the core problem of insufficient demand from businesses and consumers.
A related symptom was the structural shift in the labour market. Where new jobs were created – sometimes, as in the UK, even to the extent bringing people back into the labour force – these were concentrated in low-skilled and low-paid openings in sectors like leisure, hospitality and logistics. Increased demand for such services was the meagre limit of the “trickle-down” effect from ever-richer asset owners.
All this meant that there was not much real wage growth which, along with associated increases in bank lending, is essential for creating inflation. So it was that, in the 2010s, monetary policy not only failed to stimulate the economy but actually proved counterproductive.
Stimulus and the pandemic
During the pandemic, the situation has been different. Central banks have again been trying to stimulate the economy by expanding QE, but governments have also been using debt-funded spending to substitute for the normal demand that has disappeared because of the shutdowns.
Major governments seem determined to correct the flawed policies of the past decade. This is especially true of the Biden administration, whose massive programme of increased spending aims to drive up labour participation and wages – thereby avoiding the deflationary troubles of the 2010s.
The administration is firmly supported in this by Federal Reserve chair Jerome Powell. In August 2020, the central bank changed its inflation policy to “average inflation targeting”. Whereas in the past, the Fed targeted 2% inflation and would raise interest rates in response to low unemployment in the belief that inflation would otherwise start rising, it is now ready to allow inflation to rise to say 3% in the name of increasing employment to help stimulate economic recovery.
The success of this strategy depends on demand for more workers materialising from US businesses. But critics like Larry Summers, the former Democratic treasury secretary, argue that the government’s fiscal stimulus will create demand beyond the economy’s present production potential, risking persistent inflation.
The administration and its supporters counter that there is more slack in the economy than people like Summers believe, because so many discouraged workers have dropped out, and higher production of goods and services will result from reversing the long dearth of domestic business investment.
All such happy effects will, according to the plan, flow from using government spending to generate demand. The jury remains out on whether this will cause unmanageable inflation – either in America or, potentially, in Europe if the ECB, together with the EU and its member states, follow their apparent inclination to emulate the US.
A danger and an opportunity
Returning to my own studies of the exit from the “great inflation” of the 1970s, two lessons emerge that should help the jury in its deliberations about where we go from here. One points to an opportunity, the other to a danger.
The first lesson has to do with confidence and the expectations of firms and households, which dominate any discussion about inflation. The 1970s inflation was only really subdued after central banks were given operational independence from politicians to pursue low and stable inflation. As monetary policy became more credible, people no longer expected prices to rise so fast.
This was the main reason for the flattening of the Phillips curve – that is, inflation no longer jumps up smartly as unemployment falls. Present-day policies to stimulate demand benefit from well anchored inflation expectations. Put bluntly, policymakers will “get away” with more stimulus before having to pay an inflationary price, and this should improve their chances of success.
A key figure in the development of such thinking about expectations in the 1970s-80s was the American economist Thomas Sargent. His work on “systematic changes in inflation policy” also underlies the second – and more cautionary – lesson for today’s policymakers and the present inflation outlook.
This was crystallised in a 1982 paper by Sargent and Neil Wallace called Some Unpleasant Monetarist Arithmetic showing that monetary and fiscal policy are inextricably intertwined. At the heart of this thinking sits the idea of a government’s budget constraint. If government spending stimulates demand to the extent of driving up inflation, and monetary policymakers then respond by raising interest rates, a nasty surprise can ensue.
Higher interest rates increase a government’s interest payments on its debt. If the government responds by issuing even more debt to finance its activities, it can make inflation rise even faster – as the government’s extra spending would end up driving up demand just as the central bank is trying to curb it. In other words, a government can only run so much of a deficit before unforeseen problems crop up.
Today this lesson is even more relevant than Sargent and Wallace could have imagined. Nowadays, interest rates can no longer be a central bank’s first instrument of monetary policy: public and private debt are so high that raising rates could potentially make repayments unmanageable for many.
To take the US as the most prominent example, the Fed would instead start out by cutting back the level of government bond purchases going on to its balance sheet. This bond purchasing has ballooned in the past decade, particularly since governments’ heavy deficit spending during the pandemic.
The problem is that the money created through QE ends up, for reasons that don’t need to be explained here, in the reserves of commercial banks held by the central bank. In the US, these sums now approach a fifth of all of the Fed’s assets.
As and when the Fed decides to “taper” QE – now running at US$120 billion (£85 billion) of purchases per month – as a first step in tightening policy to lean against inflation, this will result in a lower proportion of banks’ assets being lodged with the Fed in the form of reserves, and increase the scope for banks to lend to the real economy.
Such credit expansion and the associated increase in the velocity of money is likely to fuel the inflation pressures that the Fed wants to counter. Since one of the main aims of QE is to increase bank lending, it’s a paradoxical effect – just like the previous example of higher interest rates increasing inflation.
The bottom line is that public debt has expanded to the extent of becoming unaffordable in a free market. Today’s conundrum created by QE is just the latest demonstration of the reality that disregarding government budget constraints will result, by one way or another, in higher inflation.
Long-term trends
The final question is how all of this relates to long-term trends in the labour market and elsewhere. It is often said that in the past couple of decades, globalisation and technology have both helped to reduce inflation. Globalisation has kept wages lower by moving production to poorer countries. Technology has made it cheaper to produce goods and therefore brought prices down, while the the gig economy has reduced the cost of services.
But a recent book by British-based economists Charles Goodhart and Manoj Pradhan argues that the years to come will be far less deflationary, for several reasons. China’s labour market participation is rising, which is increasing wages, and baby boomers are retiring, taking a very large generation out of the labour market and making workers more scarce and therefore more valuable.
It’s a fascinating argument, but still very debatable. For example, possible inflationary effects of ageing populations might yet be outweighed by the deflationary effect of rapid technological change automating more jobs. This will reduce workers’ bargaining power and therefore act as a brake on wage growth. Also, most people consume less in retirement, and certainly do not borrow as much: the ageing of the baby boomers will therefore be another source of deflation.
In sum, there is good reason to expect inflation in the short to medium term, but the longer term picture is more mixed. The seeds of higher long-term inflation are surely present, but the chances of their germinating will depend to a large extent on to what extent the extra fiscal stimulus from the US and elsewhere leads to increased production, as opposed to only consumption.
If there is higher business investment and labour participation, government budget deficits will narrow faster as the private sector gets back into gear and pays more in taxes. This will also help the Fed to find a smoother path through the minefield of the exit from QE, since the increased bank lending will be more likely to be unlocking sustainable economic growth. If so, it is still possible that the central banks’ claims that inflation will only be transitory could still be proven right.

 Article by ForexTime










 Source: Admirals MetaTrader 5, CRUDOIL, Monthly – Data range: from Sep 1, 2013, to Jun 1, 2021, performed on Jun 1, 2021, at 8:30 pm GMT. Please note: Past performance is not a reliable indicator of future results.
  Source: Admirals MetaTrader 5, CRUDOIL, Daily – Data range: from Sep 7, 2020, to Jun 1, 2021, performed on Jun 1, 2021, at 8:30 pm GMT. Please note: Past performance is not a reliable indicator of future results.