
Article By RoboForex.com
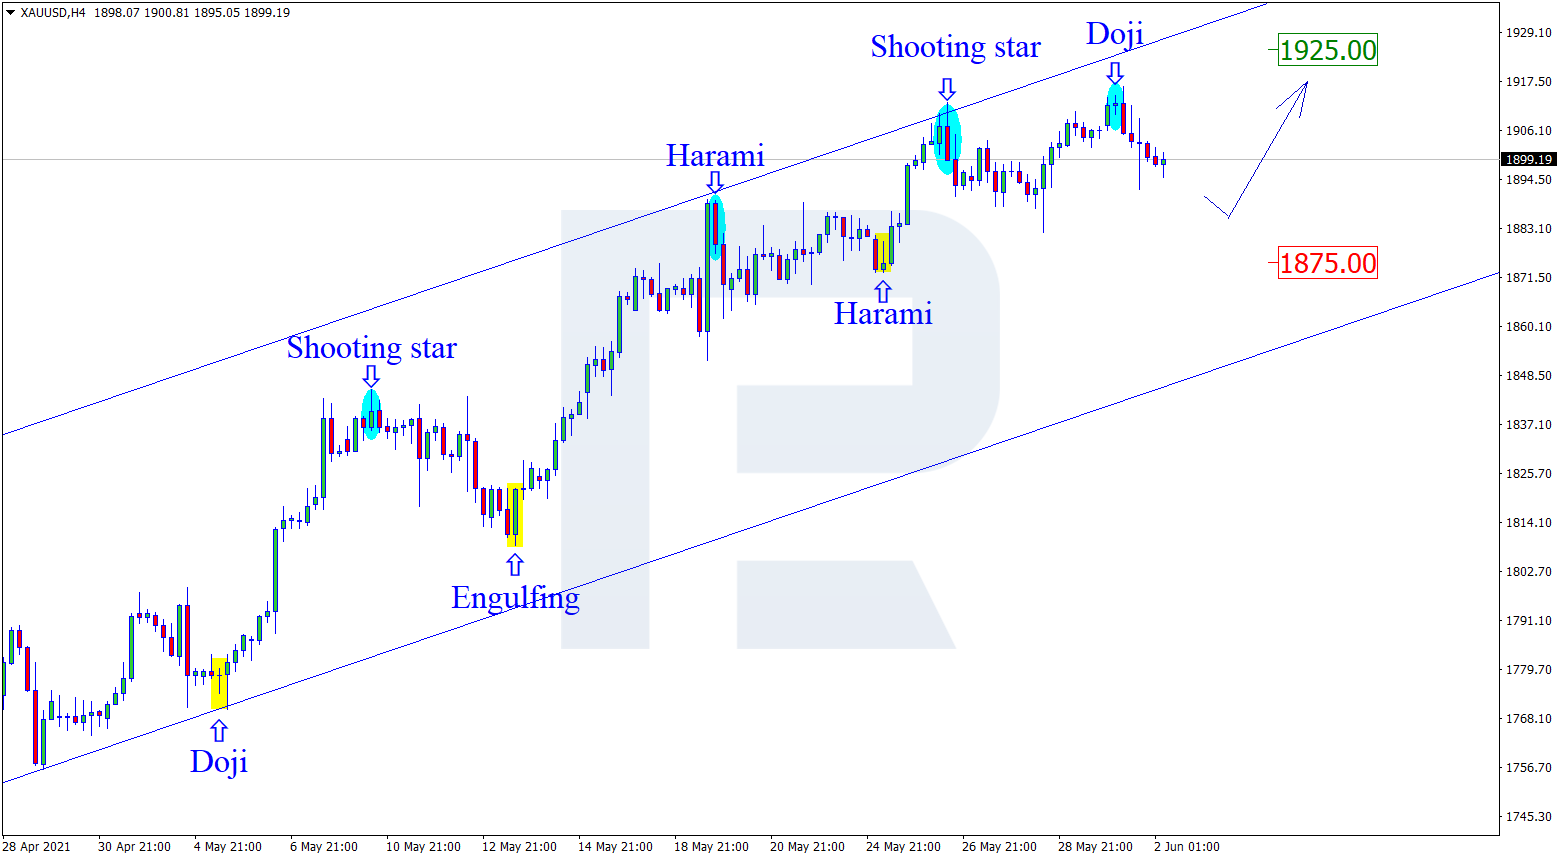
XAUUSD, “Gold vs US Dollar”
As we can see in the H4 chart, the correction continues. After forming several reversal patterns, such as Doji, close to the resistance level, XAUUSD is reversing and may form a new pullback to reach the support area at 1875.00. At the same time, an opposite scenario implies that the price may continue growing towards 1925.00 without testing the support area.

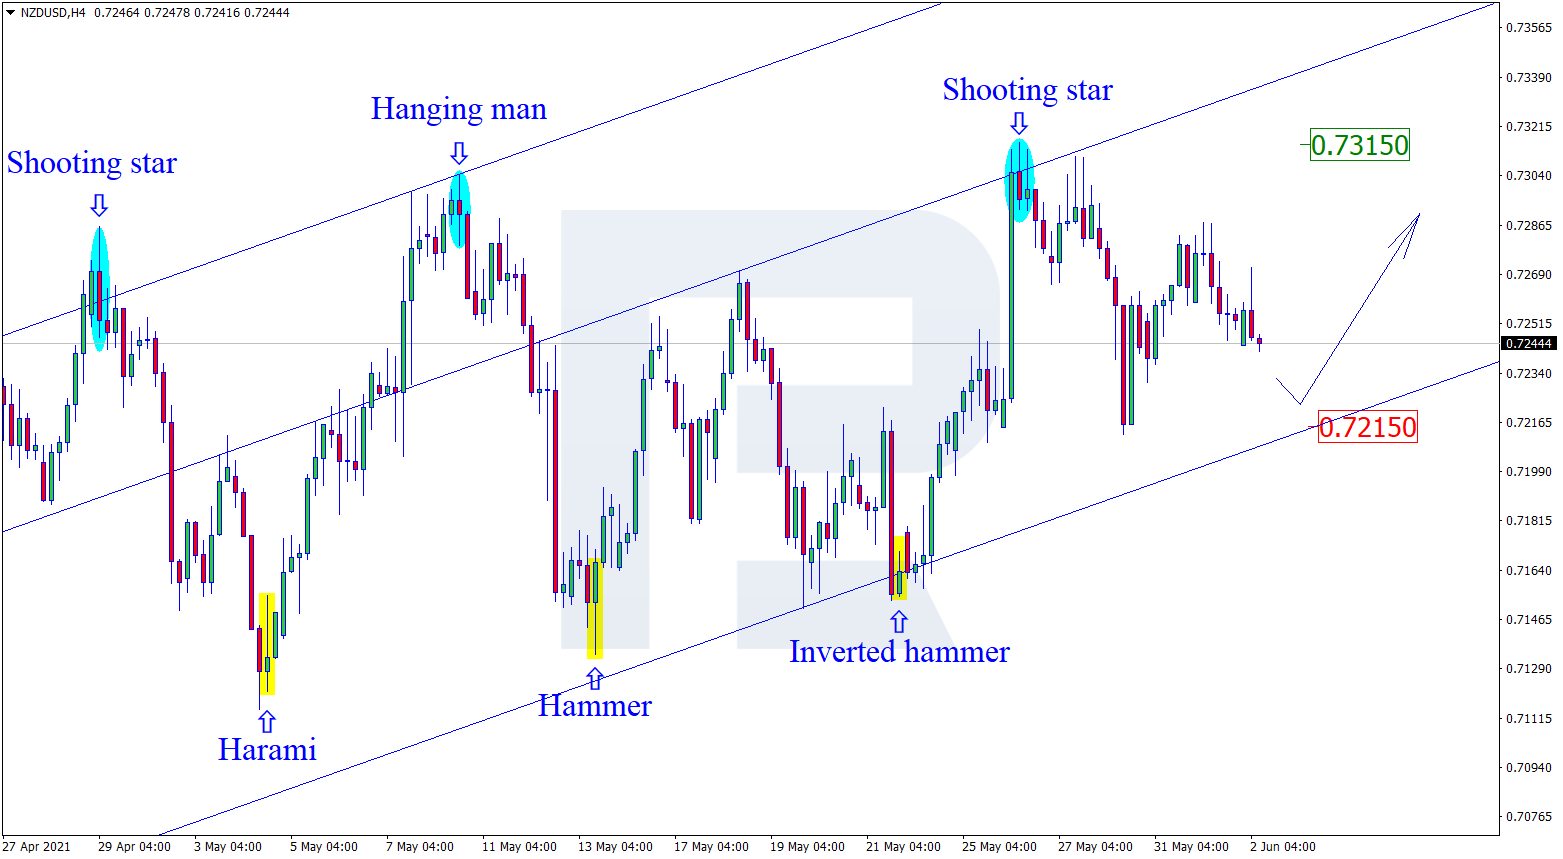
NZDUSD, “New Zealand vs US Dollar”
As we can see in the H4 chart, the correctional impulse continues. By now, NZDUSD has formed several reversal patterns, such as Shooting Star, close to the resistance level. The pattern materialization target may be the channel’s downside border at 0.7215. Later, the price may test this level, rebound from it, and resume moving upwards. However, an alternative scenario implies that the price may continue growing towards 0.7315 without testing the support level.
Free Reports:
 Get our Weekly Commitment of Traders Reports - See where the biggest traders (Hedge Funds and Commercial Hedgers) are positioned in the futures markets on a weekly basis.
 Sign Up for Our Stock Market Newsletter – Get updated on News, Charts & Rankings of Public Companies when you join our Stocks Newsletter
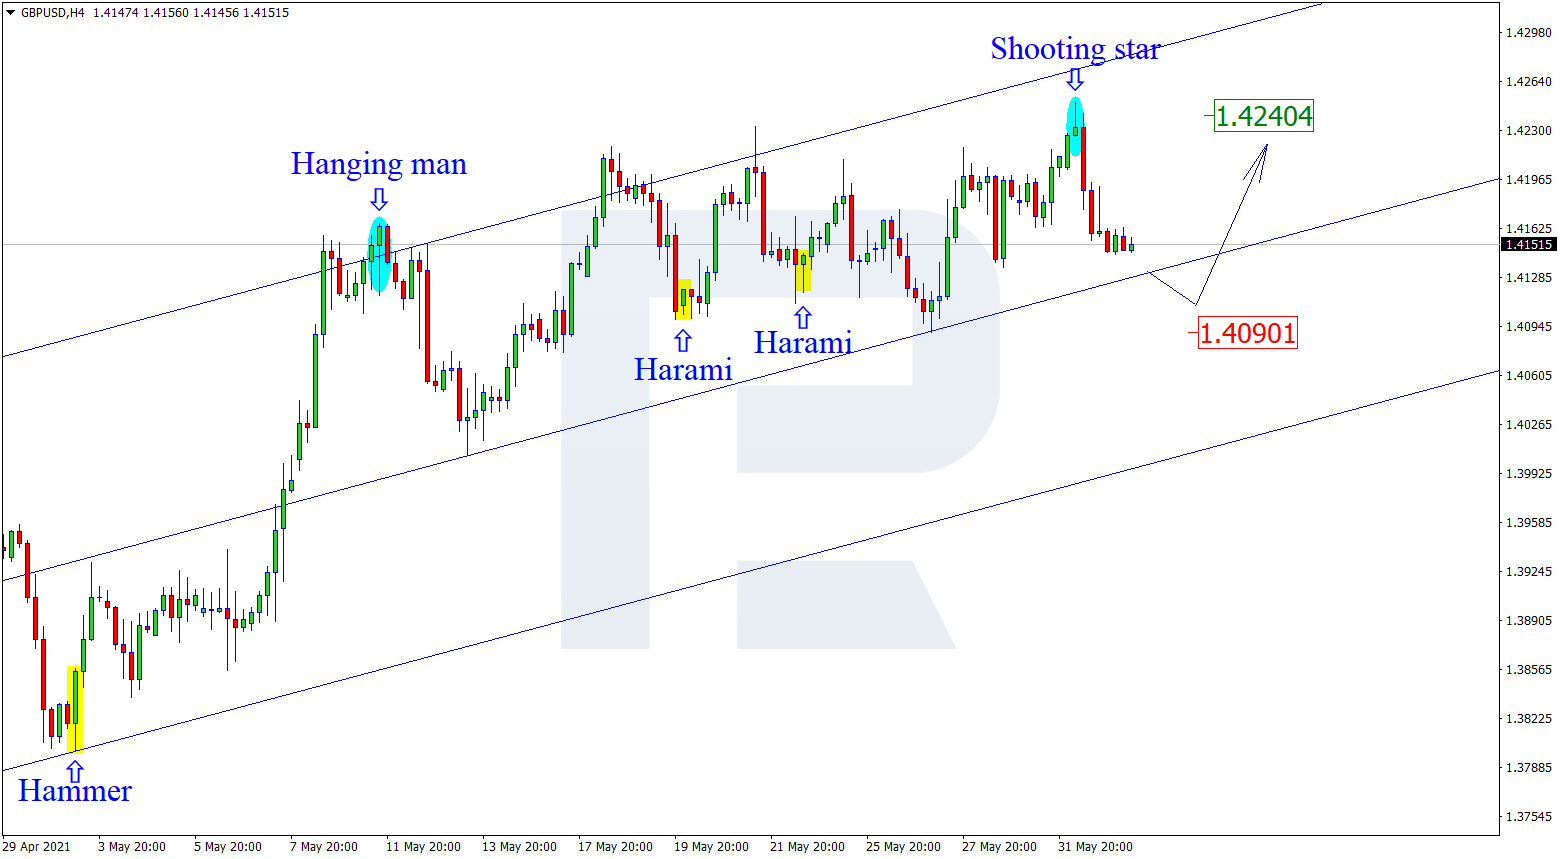
GBPUSD, “Great Britain Pound vs US Dollar”
As we can see in the H4 chart, the asset is still correcting within the uptrend. By now, GBPUSD has formed several reversal patterns, such as Shooting Star, not far from the resistance area. At the moment, the pair may reverse and start a new pullback. In this case, the correctional target may be at 1.4090. However, the next upside target after the pullback may be at 1.4240. After breaking the resistance level, the instrument may boost its ascending tendency.
Article By RoboForex.com
Attention!
Forecasts presented in this section only reflect the author’s private opinion and should not be considered as guidance for trading. RoboForex LP bears no responsibility for trading results based on trading recommendations described in these analytical reviews.

- COT Metals Charts: Weekly Speculator Bets led by Copper & Steel Jul 18, 2026
- COT Bonds Charts: Weekly Speculator Bets led by 2-Year, SOFR 3M & 5-Year Bonds Jul 18, 2026
- COT Energy Charts: Weekly Speculator Bets led by Brent Oil & Heating Oil Jul 18, 2026
- COT Soft Commodities Charts: Weekly Speculator Bets led by Wheat, Corn & Soybean Meal Jul 18, 2026
- The Bank of Canada kept its interest rate unchanged. Platinum prices reached a three‑week high Jul 16, 2026
- Stock indices rose after the release of US inflation data. China’s GDP slowed sharply Jul 15, 2026
- GBP/USD Awaits Political News: What Will Happen Next Jul 15, 2026
- USD/JPY Holds at Highs: Pressure Lingers on Yen Jul 14, 2026
- Oil prices jumped 4% amid a new wave of escalation between the US and Iran Jul 13, 2026
- EUR/USD: US Inflation Will Determine Everything Jul 13, 2026