The economic situation in Europe has improved since the last ECB meeting.
But that doesn’t necessarily mean that there will even be talk of a change in policy.
Policy outlook had been on hold since regulators and the market were waiting for the new staff projections, which will be published at the end of this meeting.
Many analysts are suspecting that the ECB will try to put the focus on their new outlook, instead of bringing up the issue of how to wind down their asset purchasing program.
Most major central banks in the world are starting to face the dilemma of when to start slowing down their support for the economy, as stores reopen and inflation fears build.
Kick the can down the road
For now, the theme seems to be to try and avoid mentioning the issue for as long as possible. Especially since everyone knows just talking about tapering is likely to weigh on the markets. This is particularly the case for the EU, as it is farther behind in economic normalization.
Even though the situation with vaccines has been improving, the constant reports of new variants and the persistence of the virus mean that uncertainty remains latent.
Central banks will be very wary about announcing a taper and then have to reverse themselves if there is an unexpected worsening of the virus situation.
For this reason, there is a building consensus that we won’t see any policy modification by the ECB.
Additionally, President Lagarde will convey a more positive outlook during the post-rate decision press conference. She has to tread a delicate balance of conveying an upbeat tone for the markets while also not allowing for a hint of tapering. This could push bond yields higher.
Higher bond yields in anticipation of the ECB cutting its bond-buying program would defeat the purpose of the bond-buying program.
What to look out for
The main takeaway from the meeting will likely be the revised staff projections, which will come out along with the rate decision.
This allows analysts and investors to recalibrate (if necessary) when they can expect policy normalization and a rate liftoff (if that will ever happen).
The prior staff projections from March expected a GDP growth of 4.0% this year and 4.1% next year. The consensus is that this might either be raised slightly or “forward loaded”; that is, faster growth in 2021 but slower in 2022.
Both would likely have a positive effect on the euro.
However, it’s a rather uncertain consensus, as Q1 GDP missed expectations. Hence why there is a minority of analysts who are projecting a cut by a couple of decimal points. That, naturally, would weaken the euro.
Projections were originally for inflation to come in at 1.5% this year, and 1.2% next year. We can also expect this to rise and potentially have a bigger impact on the markets.
The ECB has a target of 2.0% annual inflation. Therefore, if projections increase but remain below that threshold, the effect on the market will likely be muted.
However, if inflation expectations are raised more than that, it could seriously change the projections for the rate trajectory.
This is despite the ECB hinting, like other central banks, that inflation moving above the target wouldn’t be an automatic trigger for intervention.
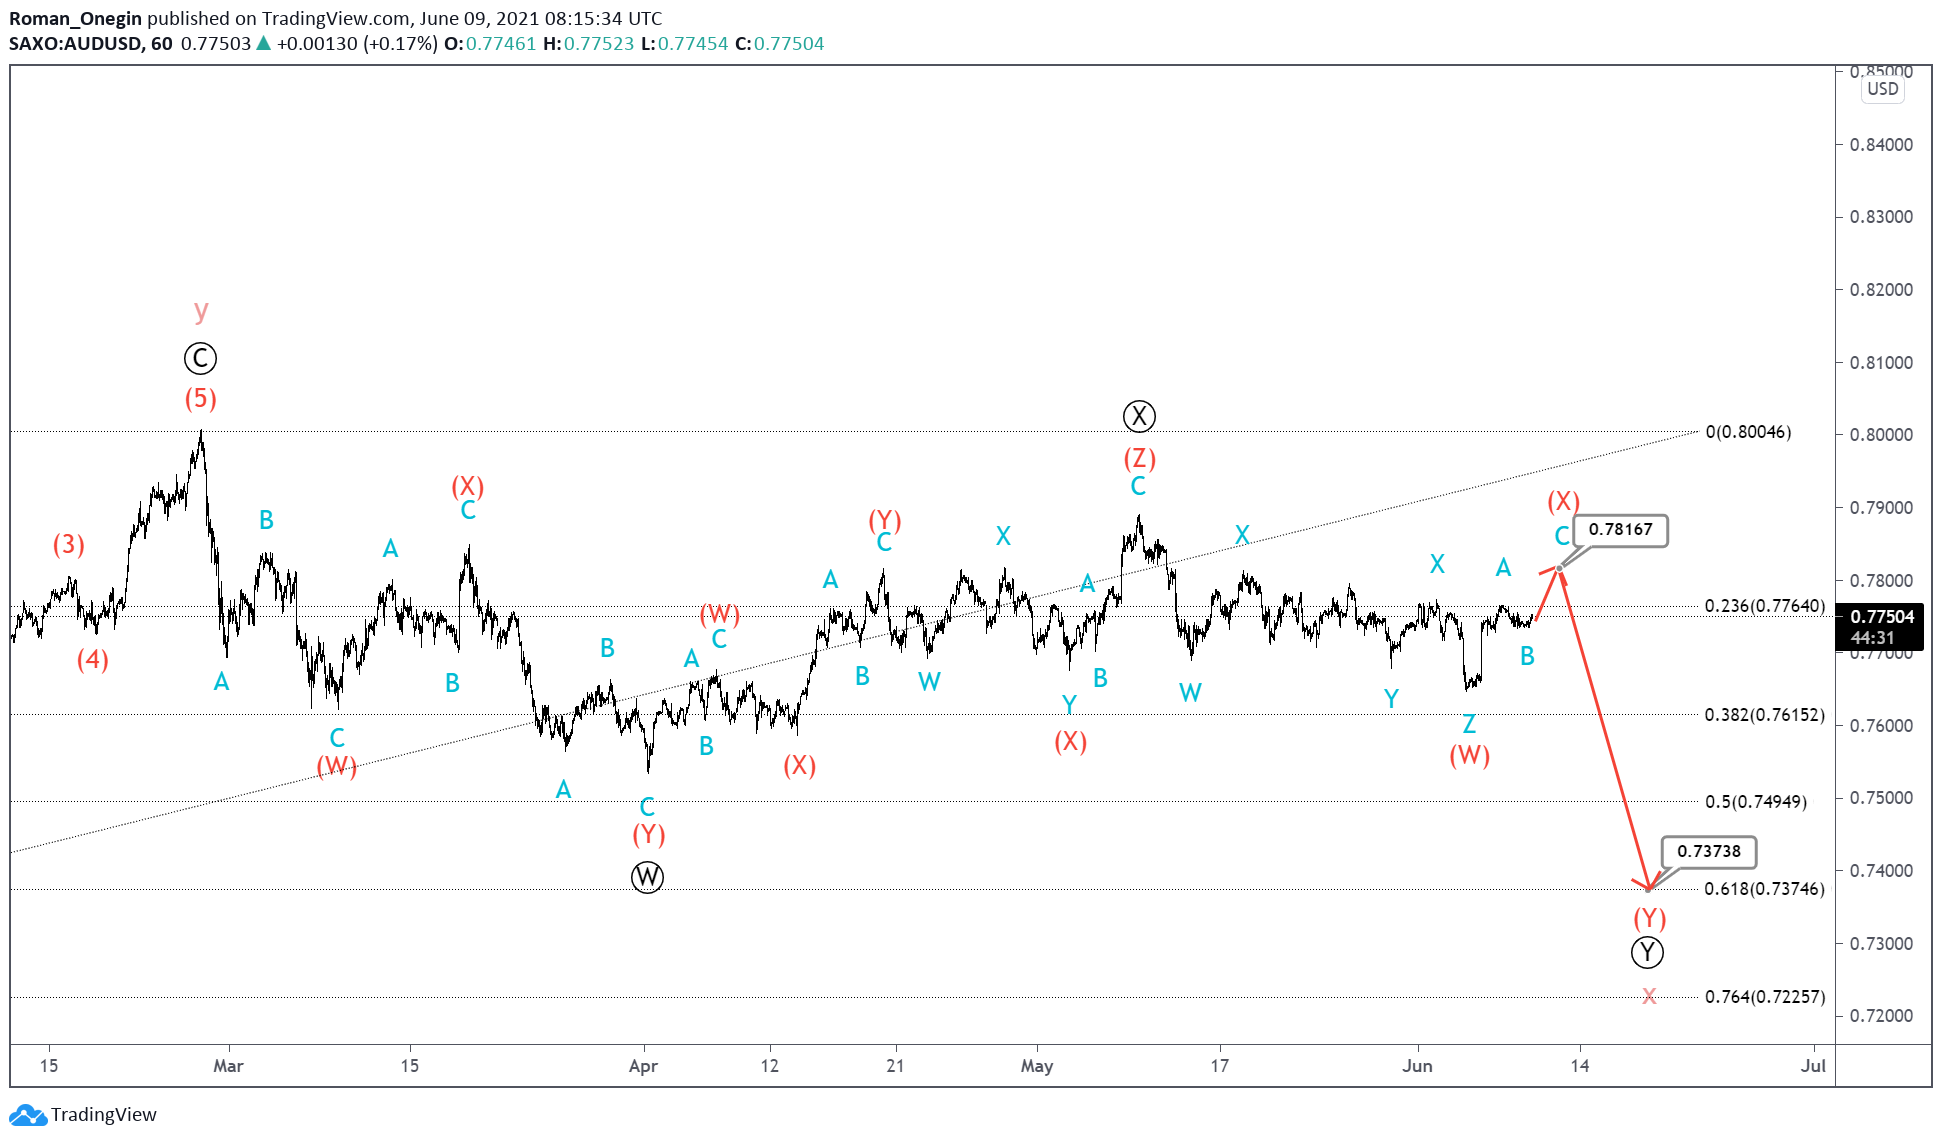
The AUDUSD currency pair in April seems to have completed the development of the cycle intervening wave x. Following this, prices began to rise within the actionary wave z.
It is assumed that wave z will have the structure of a double zigzag, consisting of primary sub-waves Ⓦ-Ⓧ-Ⓨ. The primary wave Ⓦ and the intervening wave Ⓧ ended. These were both triple zigzags of the intermediate degree.
Thus, in the near future, we could expect the development of an intermediate (A)-(B)-(C) zigzag, which can complete the primary wave Ⓨ near 0.804. At that level, cycle wave z will be at 50% of wave y.
Alternatively, we consider situations where the formation of the cycle intervening wave x continues.
It is possible that it is a double Ⓦ-Ⓧ-Ⓨ zigzag of the primary degree. The first two of the three sub-waves have been completed, whilst the final actionary wave Ⓨ is still under development. It seems that it will take the form of a bearish double (W)-(X)-(Y) zigzag.
In the near future, we could see the intervening wave (X) coming to an end near the 0.781 area. At that level, it will be at 76.4% of wave (W).
Then, after the end of wave (X), the price will continue to fall within the actionary wave (Y) to 0.737. At that level, cycle wave x will be at 61.8% of wave y.
Equity markets hold high as investors weigh stronger economic rebound against reflation concerns.
The Nasdaq’s surge above the daily resistance at 13800, suggests that buyers have regained control of the direction.
The bull market may resume when trend followers jump in again. 13960 is the resistance up ahead. Its breach could trigger an extended rally to the peak at 14070.
The RSI has retreated into the neutral zone. 13700 has turned into a demand zone in case the index needs to consolidate its gains.
EURGBP forms head and shoulder
The euro rallying after the eurozone’s Q1 GDP showed a smaller contraction than expected.
The major support at 0.8560 has held well against sellers’ multiple attempts to break out. The rally above 0.8605 could shift the balance in favor of the demand side.
The formation of a head and shoulder may suggest a reversal in the coming hours. A break above the neckline which coincides with the resistance level of 0.8618, acts as a confirmation. 0.8645 would be the next hurdle, while 0.8590 acts as the immediate support.
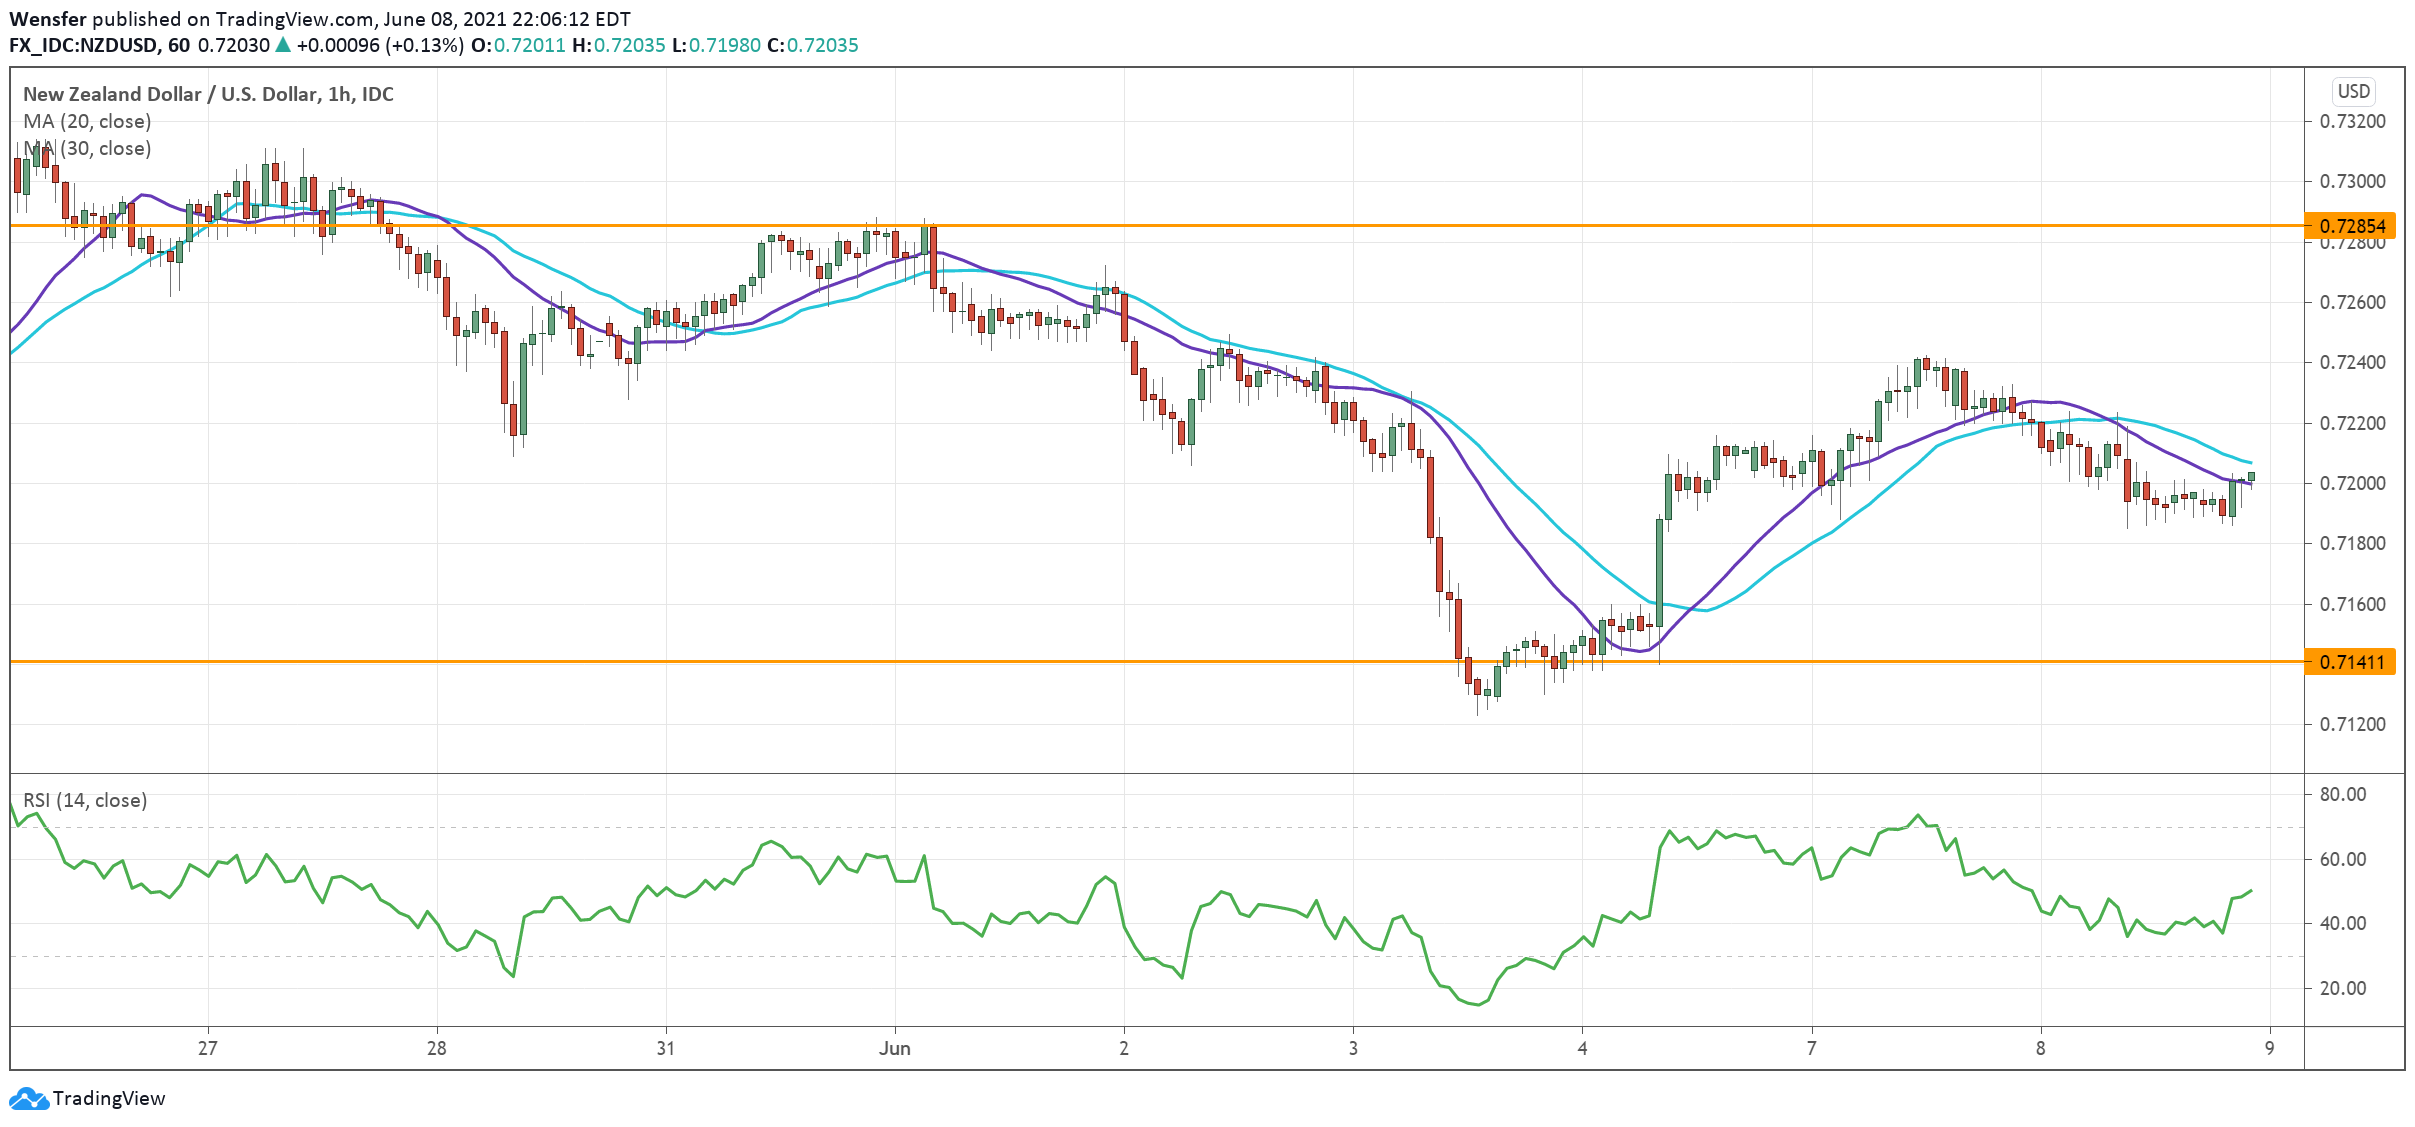
NZDUSD bounces off demand zone
The New Zealand dollar is recovering on improved risk appetite across the board.
The pair has found solid bids in the demand area (0.7120) on the daily chart. The subsequent breakout above 0.7230 indicates strong buying interest. 0.7140 is the key support to keep the bullish momentum going.
The RSI has returned to the neutrality area, leaving room for another round of rally.
On the upside, 0.7285, a critical resistance, would be the next target. Its breach could open up the highway towards 0.7400.
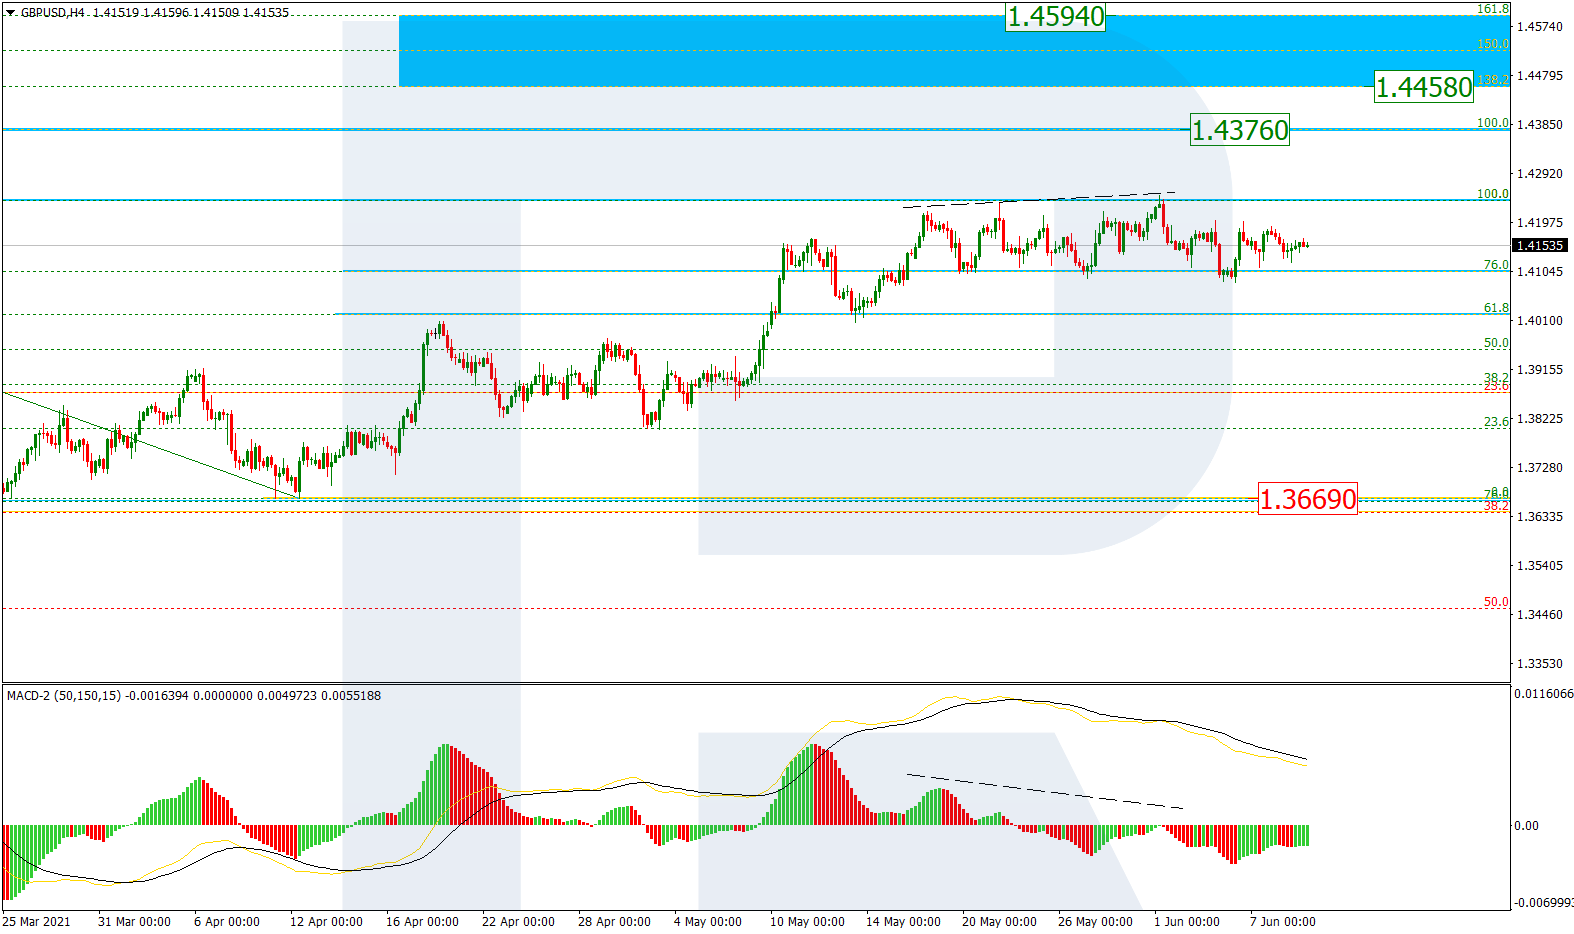
As we can see in the H4 chart, after a breakout of the high at 1.4241 and a divergence on MACD, the pair has started a new correctional decline. The above-mentioned breakout of the high may lead to a further uptrend towards the long-term high at 1.4376 as soon as the price completes the pullback. Later, the price may continue growing to reach the post-correctional extension area between 138.2% and 161.8% fibo at 1.4458 and 1.4594 respectively.
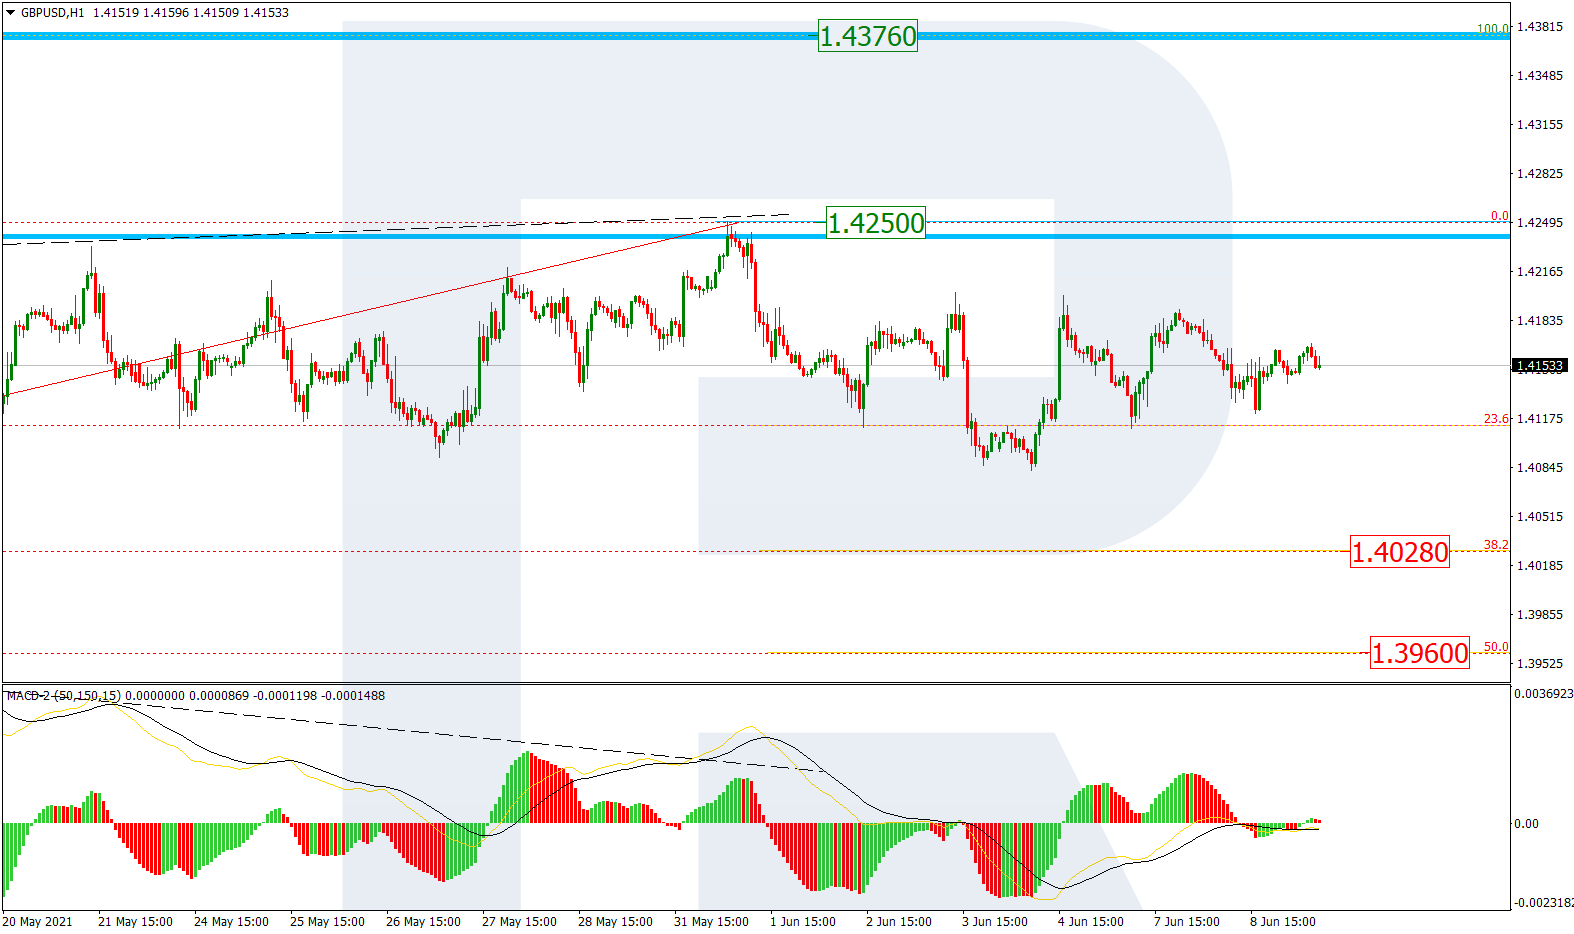
In the H1 chart, after falling and reaching 23.6% fibo, the asset is consolidating. The next downside correctional targets are 38.2% and 50.0% fibo at 1.4028 and 1.3960 respectively. The local resistance is the high at 1.4250, a breakout of which may lead to a further uptrend.
EURJPY, “Euro vs. Japanese Yen”
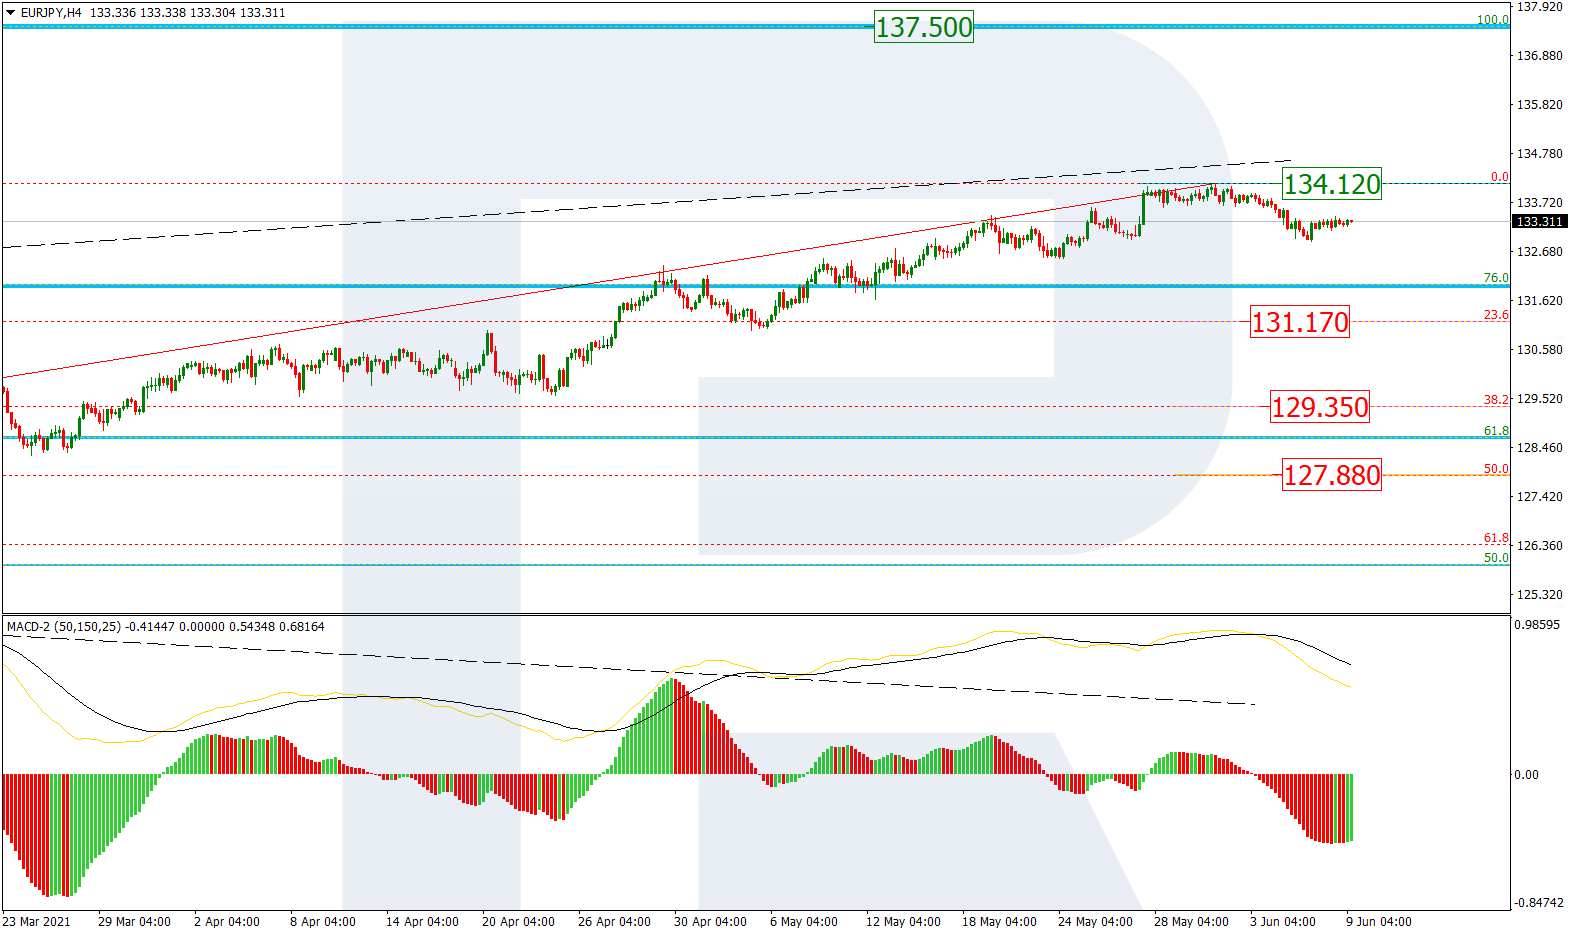
In the H4 chart, EURJPY is correcting downwards before another attempt to reach its key high at 137.50. the current correctional targets are 23.6%, 38.2%, and 50.0% fibo at 131.17, 129.35, and 127.88 respectively. At the same time, a breakout of the current high at 134.12 will complete the correction and lead to a further uptrend.
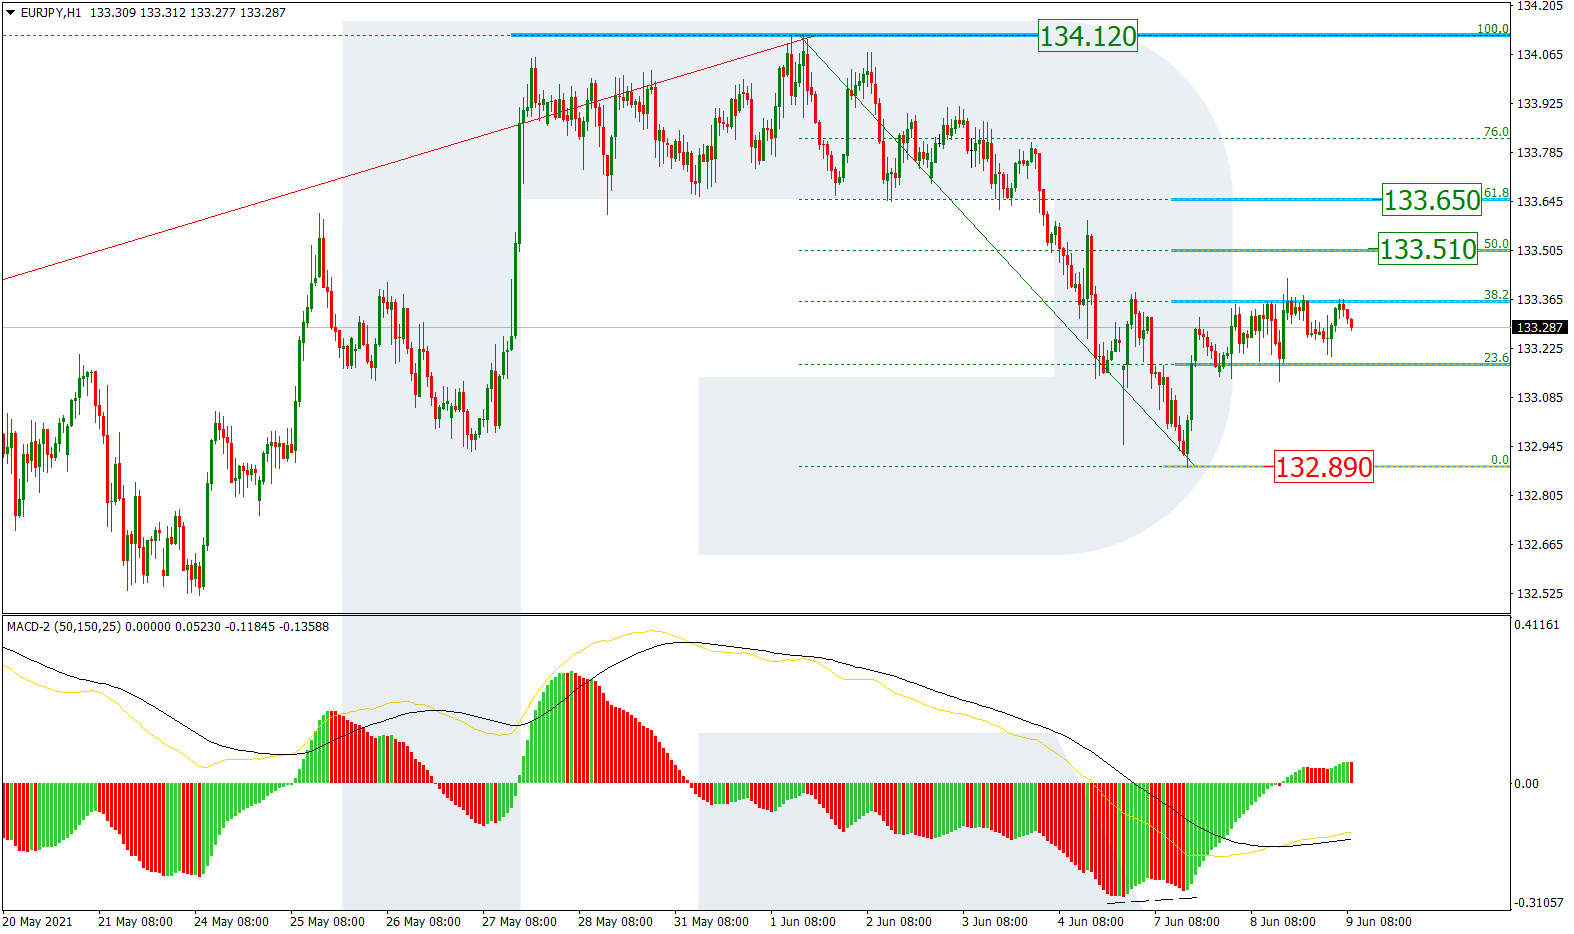
As we can see in the H1 chart, after completing the descending wave, the pair is forming a short-term correction to the upside and has already tested 38.2% fibo. Later, the asset may continue growing towards 50.0% and 61.8% fibo at 133.51 and 133.65 respectively. The support is the low at 132.89.
Attention! Forecasts presented in this section only reflect the author’s private opinion and should not be considered as guidance for trading. RoboForex LP bears no responsibility for trading results based on trading recommendations described in these analytical reviews.
Every time there is a major disease outbreak, one of the first questions scientists and the public ask is: “Where did this come from?”
In order to predict and prevent future pandemics like COVID-19, researchers need to find the origin of the viruses that cause them. This is not a trivial task. The origin of HIV was not clear until 20 years after it spread around the world. Scientists still don’t know the origin of Ebola, even though it has caused periodic epidemics since the 1970s.
As an expert in viral ecology, I am often asked how scientists trace the origins of a virus. In my work, I have found many new viruses and some well-known pathogens that infect wild plants without causing any disease. Plant, animal or human, the methods are largely the same. Tracking down the origins of a virus involves a combination of extensive fieldwork, thorough lab testing and quite a bit of luck.
Viruses jump from wild animal hosts to humans
Many viruses and other disease agents that infect people originate in animals. These diseases are zoonotic, meaning they are caused by animal viruses that jumped to people and adapted to spread through the human population.
It might be tempting to start the viral origin search by testing sick animals at the site of the first known human infection, but wild hosts often don’t show any symptoms. Viruses and their hosts adapt to each other over time, so viruses often don’t cause obvious disease symptoms until they’ve jumped to a new host species. Researchers can’t just look for sick animals.
Another problem is that people and their food animals aren’t stationary. The place where researchers find the first infected person is not necessarily close to the place where the virus first emerged.
In the case of COVID-19, bats were an obvious first place to look. They’re known hosts for many coronaviruses and are the probable source of other zoonotic diseases like SARS and MERS.
For SARS-CoV-2, the virus that causes COVID-19, the nearest relative scientists have found so far is BatCoV RaTG13. This virus is part of a collection of bat coronaviruses discovered in 2011 and 2012 by virologists from the Wuhan Virology Institute. The virologists were looking for SARS-related coronaviruses in bats after the SARS-CoV-1 pandemic in 2003. They collected fecal samples and throat swabs from bats at a site in Yunnan Province about 932 miles (1,500 kilometers) from the institute’s lab in Wuhan, where they brought samples back for further study.
To test whether the bat coronaviruses could spread into people, researchers infected monkey kidney cells and human tumor-derived cells with the Yunnan samples. They found that a number of the viruses from this collection could replicate in the human cells, meaning they could potentially be transmitted directly from bats to humans without an intermediate host. Bats and people don’t come into direct contact very often, however, so an intermediate host is still quite likely.
Finding the nearest relatives
The next step is to determine how closely related a suspected wildlife virus is to the one infecting humans. Scientists do this by figuring out the genetic sequence of the virus, which involves determining the order of the basic building blocks, or nucleotides, that make up the genome. The more nucleotides two genetic sequences share, the more closely related they are.
Genetic sequencing of bat coronavirus RaTG13 showed it to be over 96% identical to SARS-CoV-2. This level of similarity means that RaTG13 is a pretty close relative to SARS-CoV-2, confirming that SARS-CoV-2 probably originated in bats, but is still too distant to be a direct ancestor. There likely was another host that caught the virus from bats and passed it on to humans.
Because some of the earliest cases of COVID-19 were found in people associated with the wildlife market in Wuhan, there was speculation that a wild animal from this market was the intermediate host between bats and humans. However, researchers never found the coronavirus in animals from the market.
Likewise, when a related coronavirus was identified in pangolins confiscated in an anti-smuggling operation in southern China, many leaped to the conclusion that SARS-CoV-2 had jumped from bats to pangolins to humans. The pangolin virus was found to be only 91% identical to SARS-CoV-2, though, making it unlikely to be a direct ancestor of the human virus.
To pinpoint the origin of SARS-CoV-2, a lot more wild samples need to be collected. This is a difficult task – sampling bats is time-consuming and requires strict precautions against accidental infection. Since SARS-related coronaviruses are found in bats across Asia, including Thailand and Japan, it’s a very big haystack to search for a very small needle.
Creating a family tree for SARS-CoV-2
In order to sort out the puzzle of viral origins and movement, scientists not only have to find the missing pieces, but also figure out how they all fit together. This requires collecting viral samples from human infections and comparing those genetic sequences both to each other and to other animal-derived viruses.
To determine how these viral samples are related to each other, researchers use computer tools to construct the virus’s family tree, or phylogeny. Researchers compare the genetic sequences of each viral sample and construct relationships by aligning and ranking genetic similarities and differences.
The direct ancestor to the virus, sharing the greatest genetic similarity, could be thought of as its parent. Variants sharing that same parent sequence but with enough changes to make them distinct from each other are like siblings. In the case of SARS-CoV-2, the South African variant, B.1.351, and the U.K. variant, B.1.1.7, are siblings.
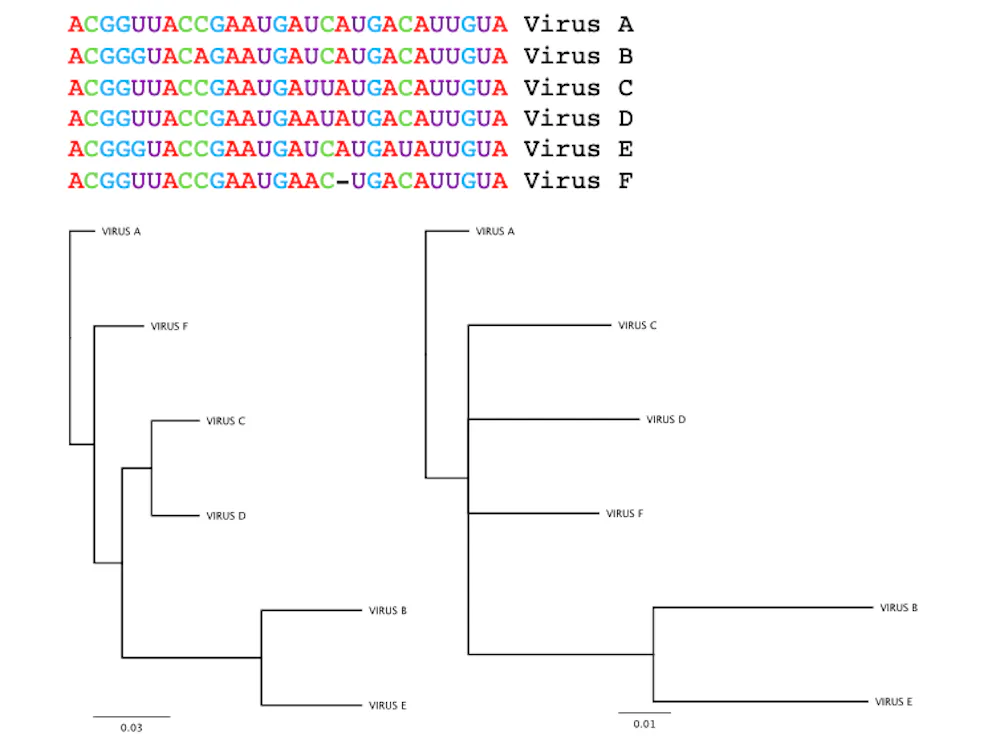
Building a family tree is complicated by the fact that different analysis parameters can give different results: The same set of genetic sequences can produce two very different family trees.
The nucleotide sequences of six fictional viruses are shown on the top. Below are two family trees of these viruses created using two different programs. The tree on the left uses only percent identity, while the tree on the right also considers whether the two sequences share similar characters. Marilyn Roossinck, CC BY-ND
Could SARS-CoV-2 have been released from a research lab? Although current evidence implies that this is not the case, 18 prominent virologists recently suggested that this question should be further investigated.
Although there has been speculation about SARS-CoV-2 being engineered in a lab, this possibility seems highly unlikely. When comparing the genetic sequence of wild RaTG13 with SARS-CoV-2, differences are randomly spread across the genome. In an engineered virus, there would be clear blocks of changes that represent introduced sequences from a different viral source.
There is one unique sequence in the SARS-CoV-2 genome that codes for a part of the spike protein that seems to play an important role in infecting people. Interestingly, a similar sequence is found in the MERS coronavirus that causes a disease similar to COVID-19.
Though it is not clear how SARS-CoV-2 acquired these sequences, viral evolution suggests they arose from natural processes. Viruses accumulate changes either by genetic exchange with other viruses and their hosts, or by random mistakes during replication. Viruses that gain a genetic change that gives them a reproductive advantage would typically continue to pass it on through replication. That MERS and SARS-CoV-2 share a similar sequence in this part of the genome suggests that it naturally evolved in both and spread because it helps them infect human cells.
Where to go from here?
Figuring out the origin of SARS-CoV-2 could give us clues to understand and predict future pandemics, but we may never know exactly where it came from. Regardless of how the SARS-CoV-2 jumped into humans, it’s here now, and it’s probably here to stay. Going forward, researchers need to continue monitoring its spread, and get as many people vaccinated as possible.
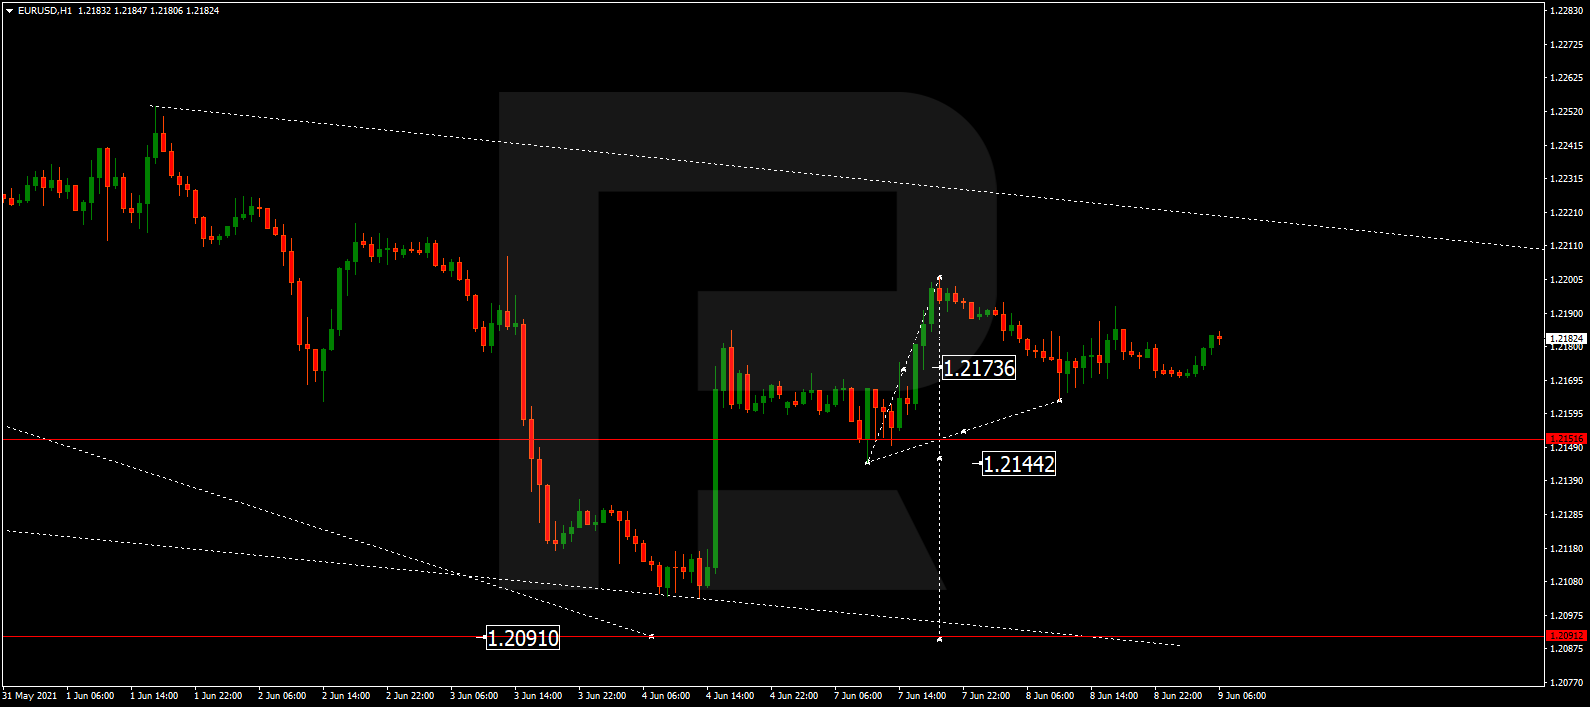
EURUSD is still consolidating around 1.2178. Today, the pair may fall to break 1.2144 and then continue trading downwards with the target at 1.2090. After that, the instrument may start a new correction towards 1.2170.
GBPUSD, “Great Britain Pound vs US Dollar”
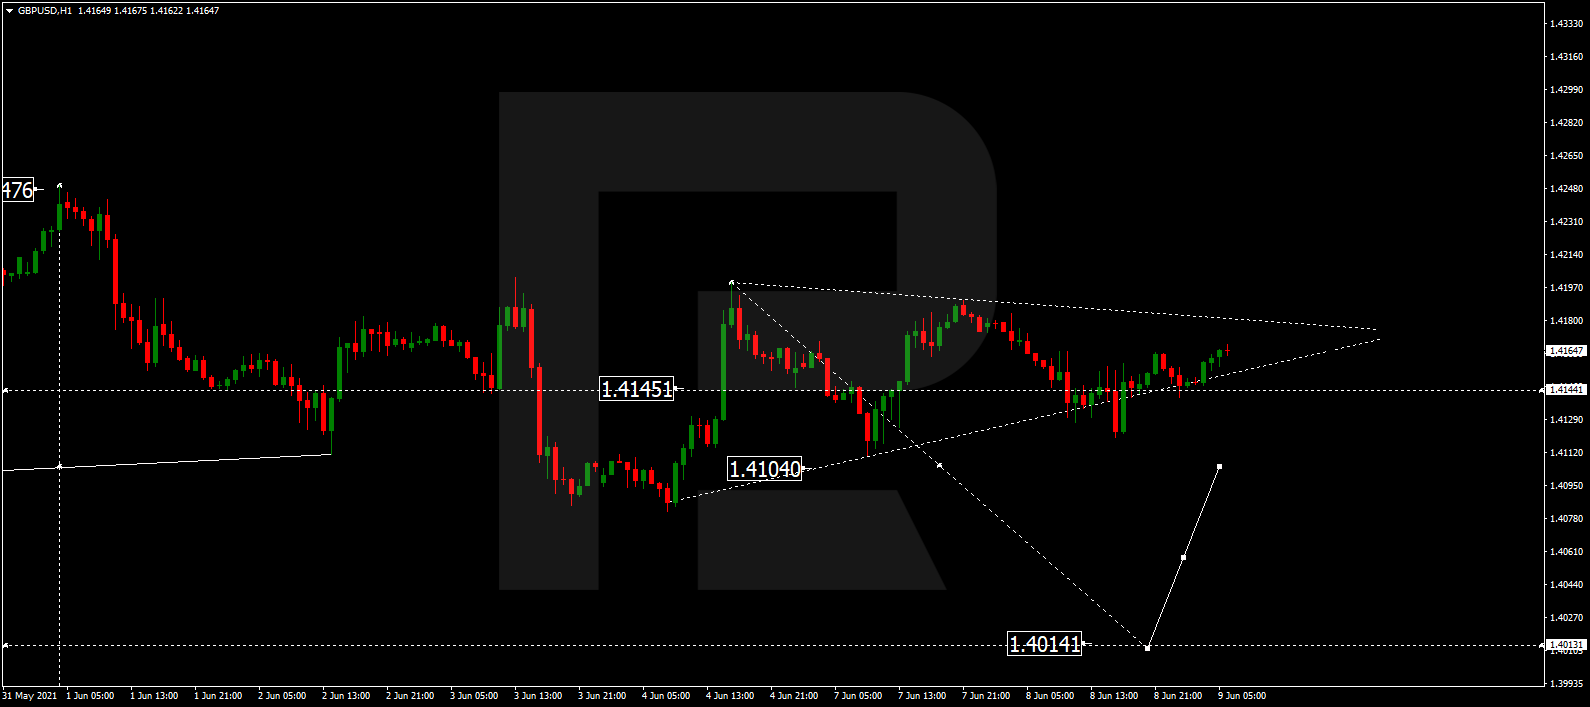
GBPUSD is still consolidating 1.4155; right now, it is falling towards 1.4104. Possibly, today the pair may break the latter level and continue falling to reach 1.4014. Later, the market may form one more ascending structure return to 1.4104.
USDRUB, “US Dollar vs Russian Ruble”
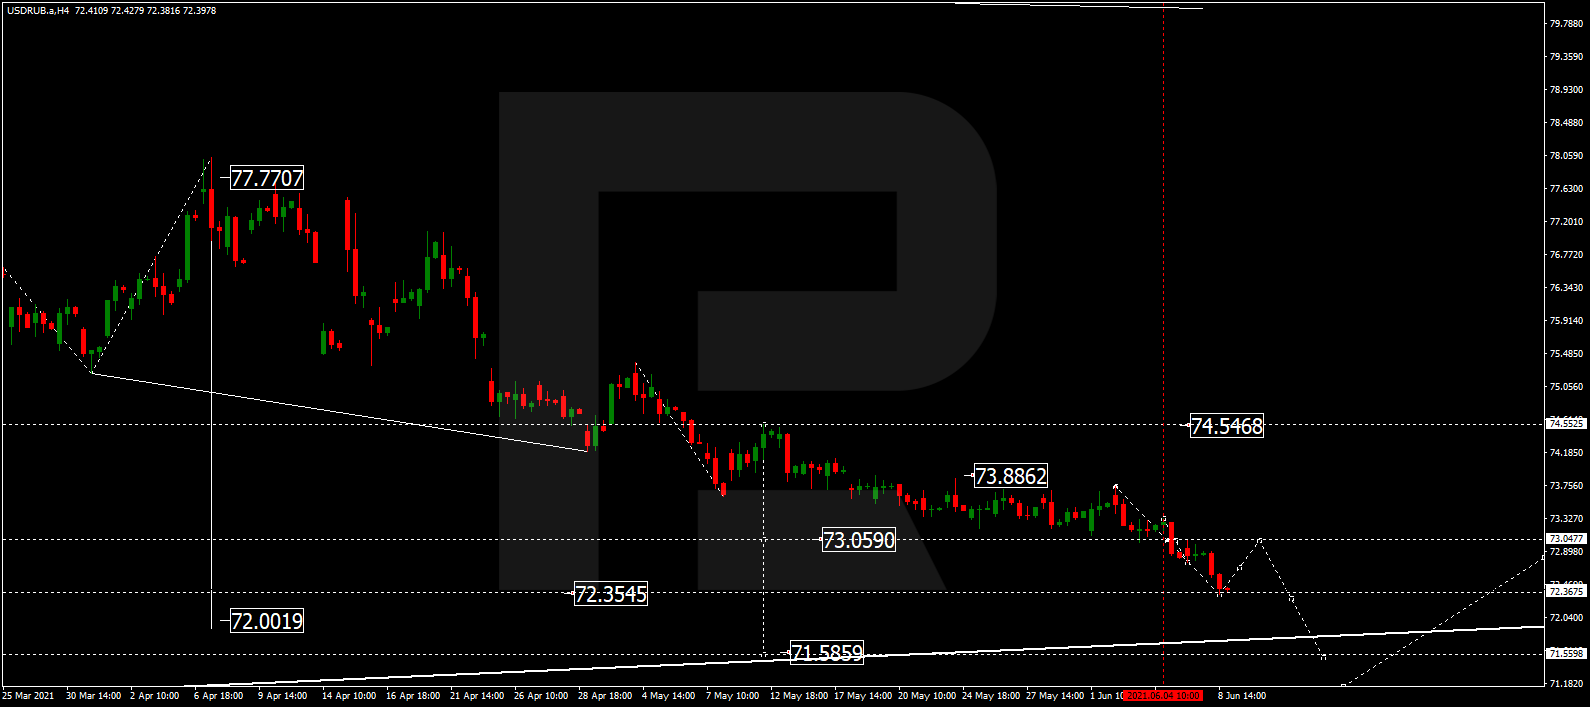
After finishing the descending wave at 72.35, USDRUB is expected to correct towards 73.05. After that, the instrument may resume trading downwards with the target at 72.00 or even reach 71.60.
USDJPY, “US Dollar vs Japanese Yen”
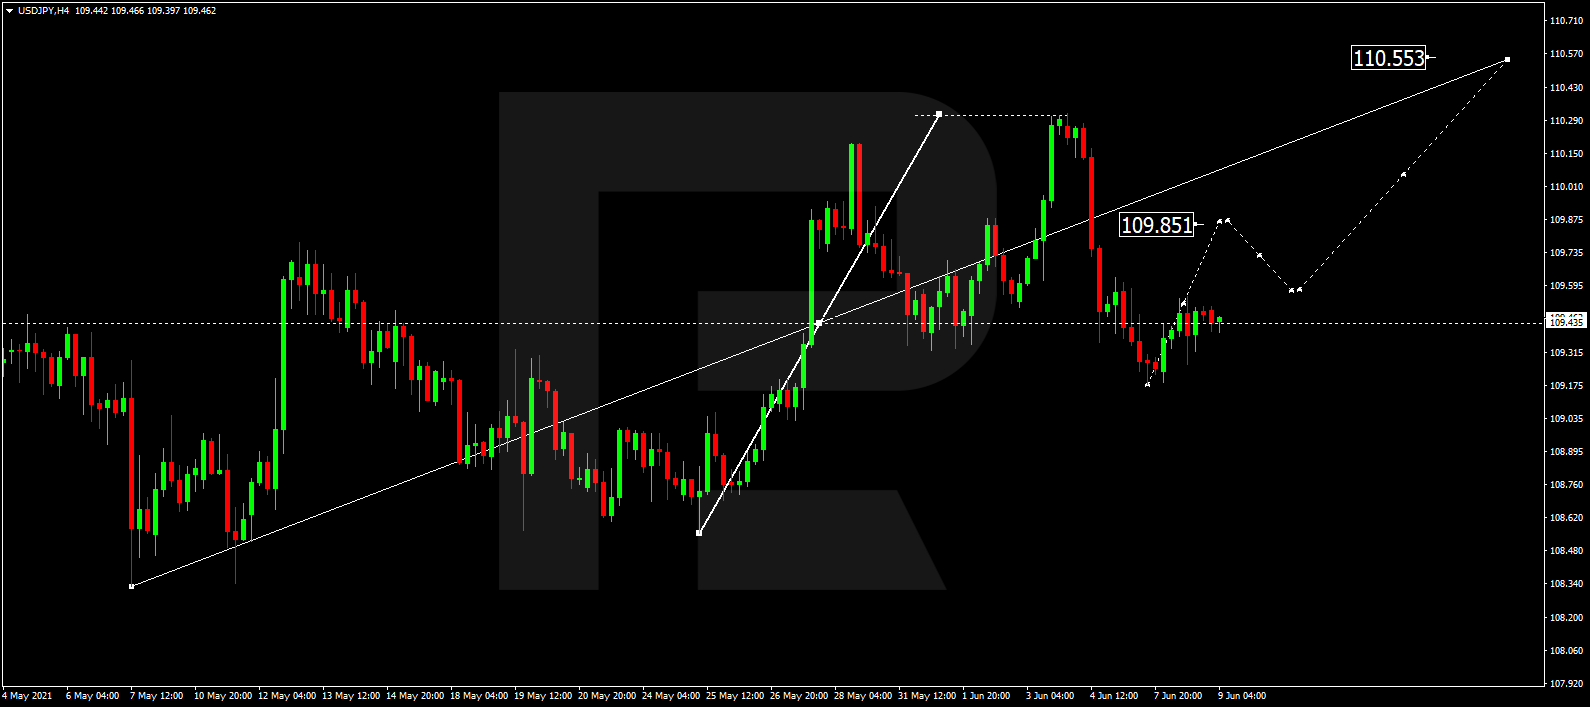
USDJPY is still consolidating around 109.44; right now, it is growing towards 109.85. Today, the pair may break the latter level and form one more ascending structure with the target at 110.55.
USDCHF, “US Dollar vs Swiss Franc”
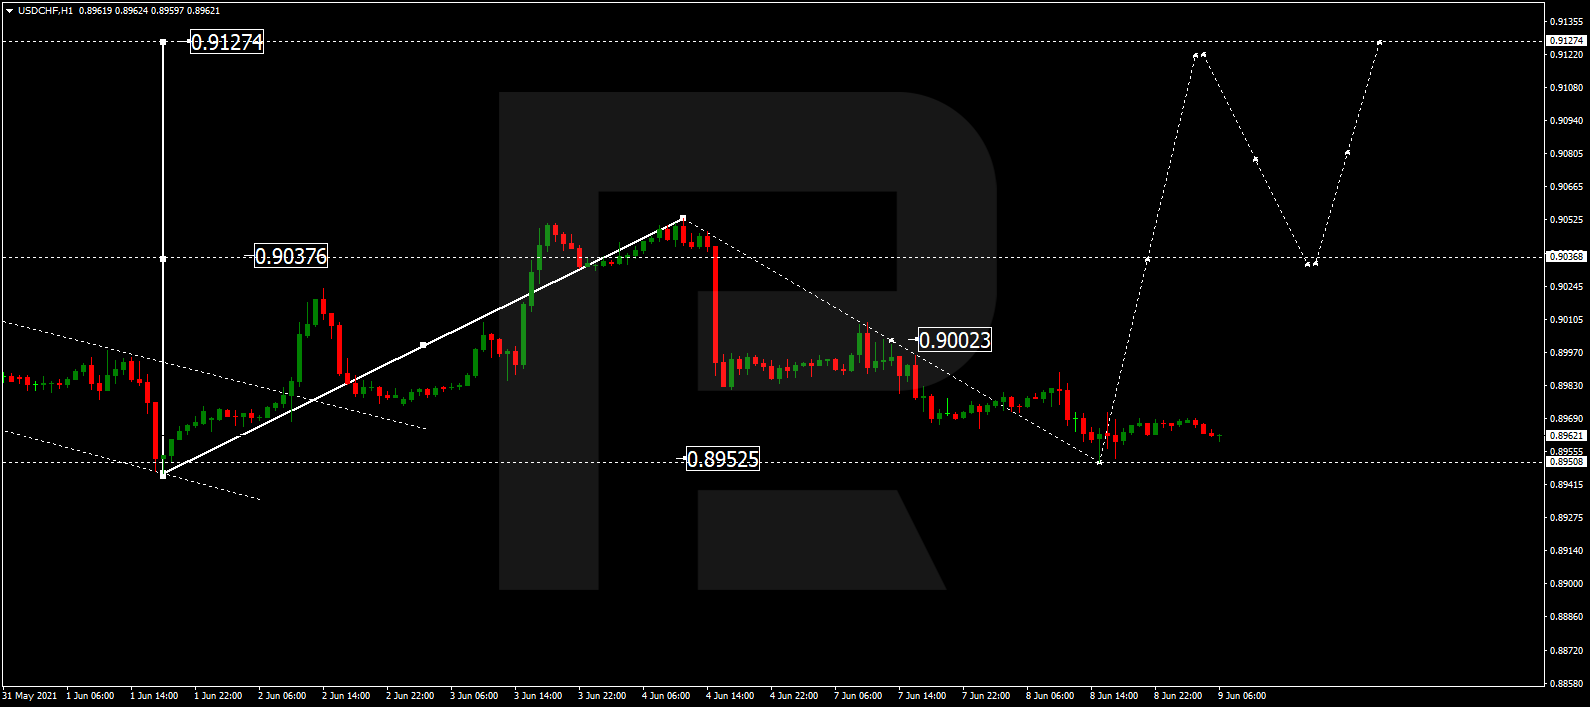
USDCHF is still consolidating; right now, it is trading close to the downside border at 0.8951. Possibly, today the pair may resume growing towards the upside border of the range at 0.9010. Later, the market may break this level and then continue trading upwards with the short-term target at 0.9107.
AUDUSD, “Australian Dollar vs US Dollar”
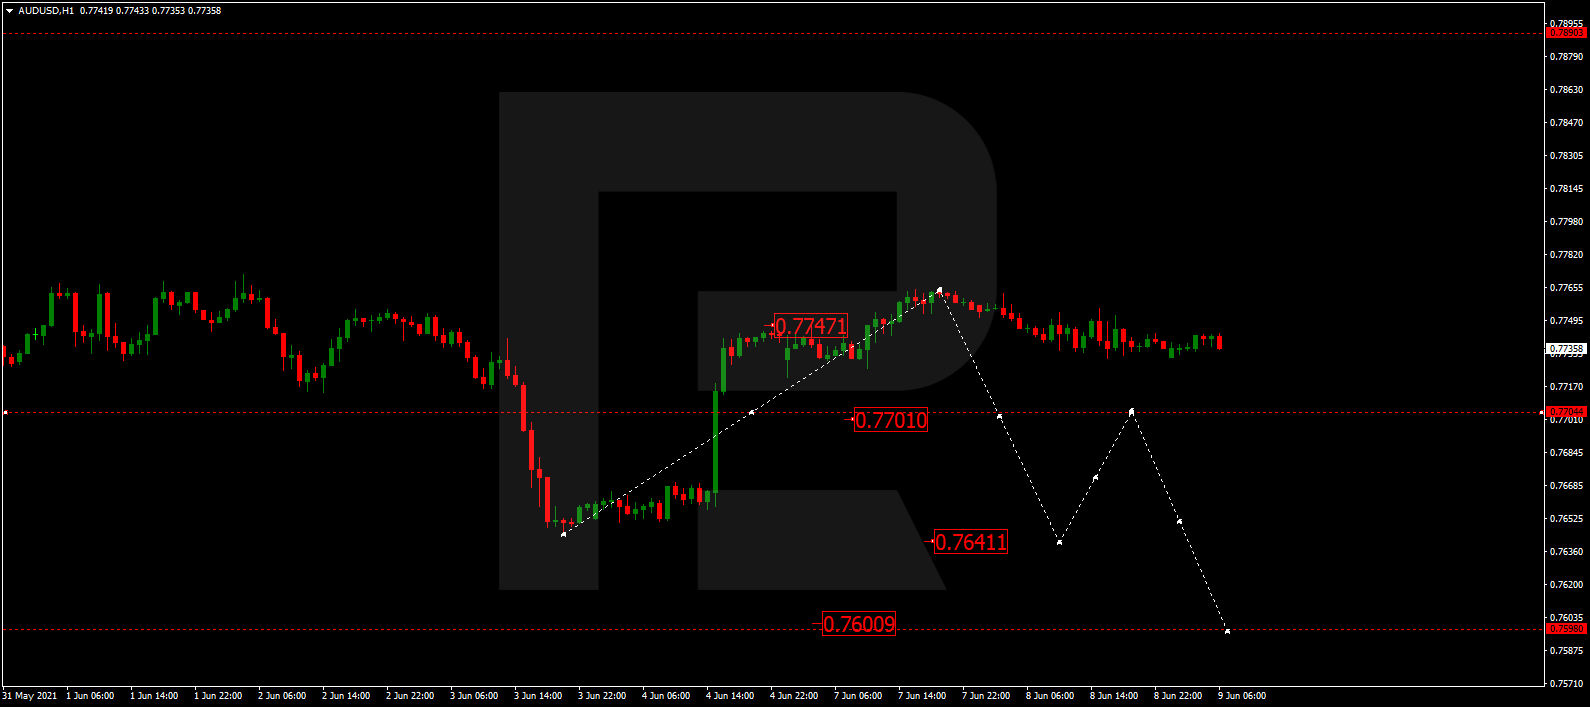
AUDUSD is still consolidating around 0.7747. Today, the pair may form a new descending structure towards the downside border of the range at 0.7701. After that, the instrument may break this level and continue trading downwards with the target at 0.7641.
BRENT
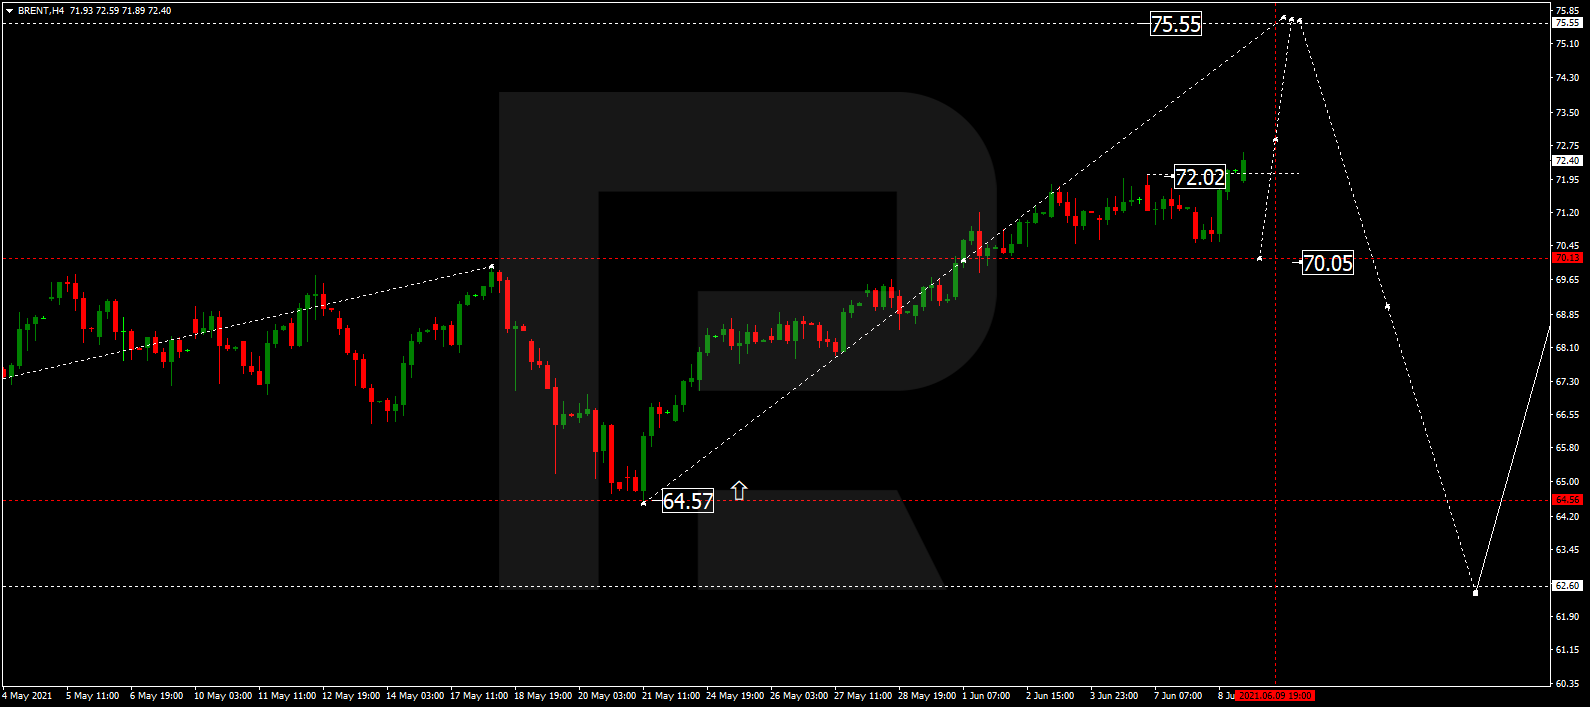
Brent is trading to break 72.20 and may later continue trading upwards with the target at 75.55. After that, the instrument may start a new correction to reach 70.00.
XAUUSD, “Gold vs US Dollar”
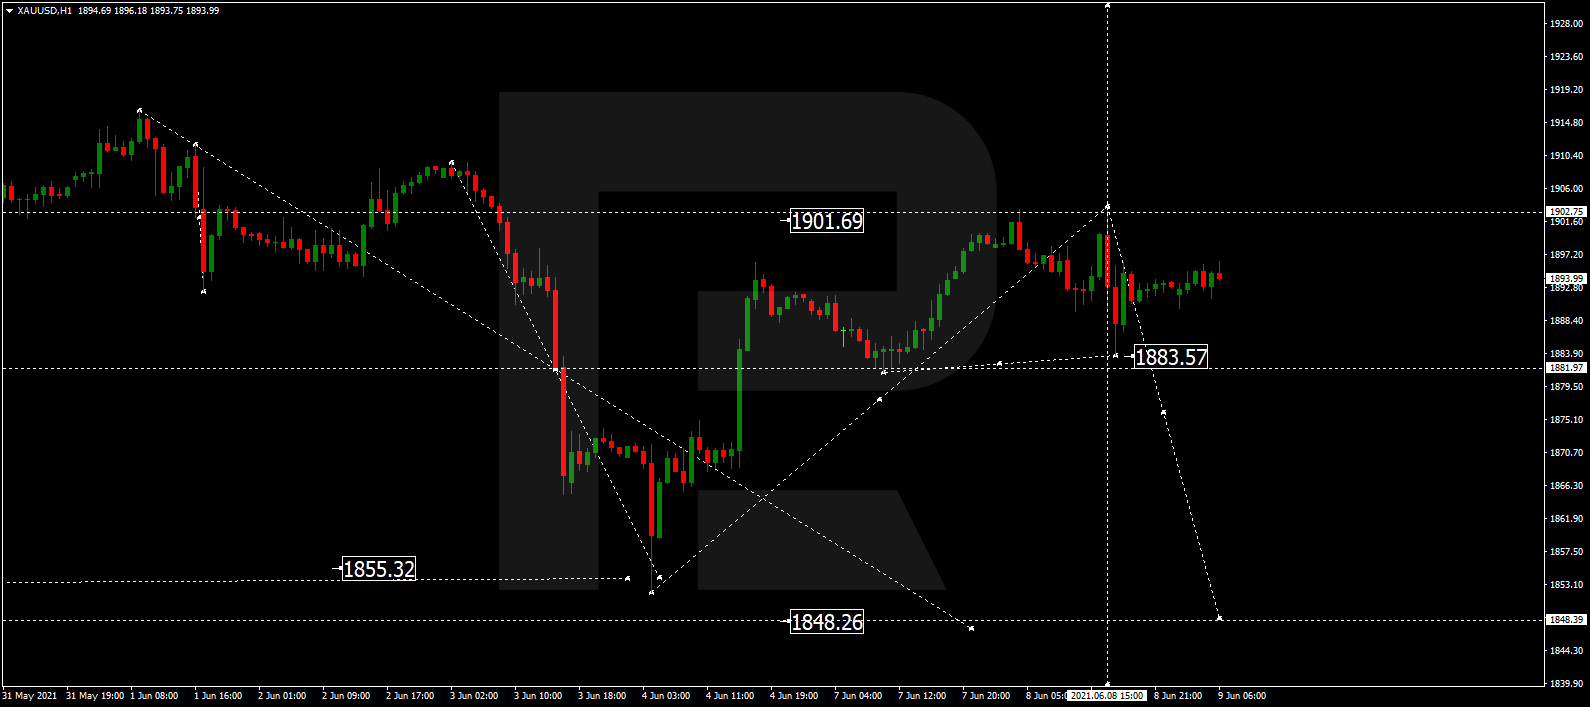
Gold has completed the descending wave at 1883.57 along with the correction towards 1895.00, thus forming a new consolidation range between these two levels. Today, the metal may form a new descending structure to break 1883.00 and then continue trading downwards with the target at 1848.26.
S&P 500
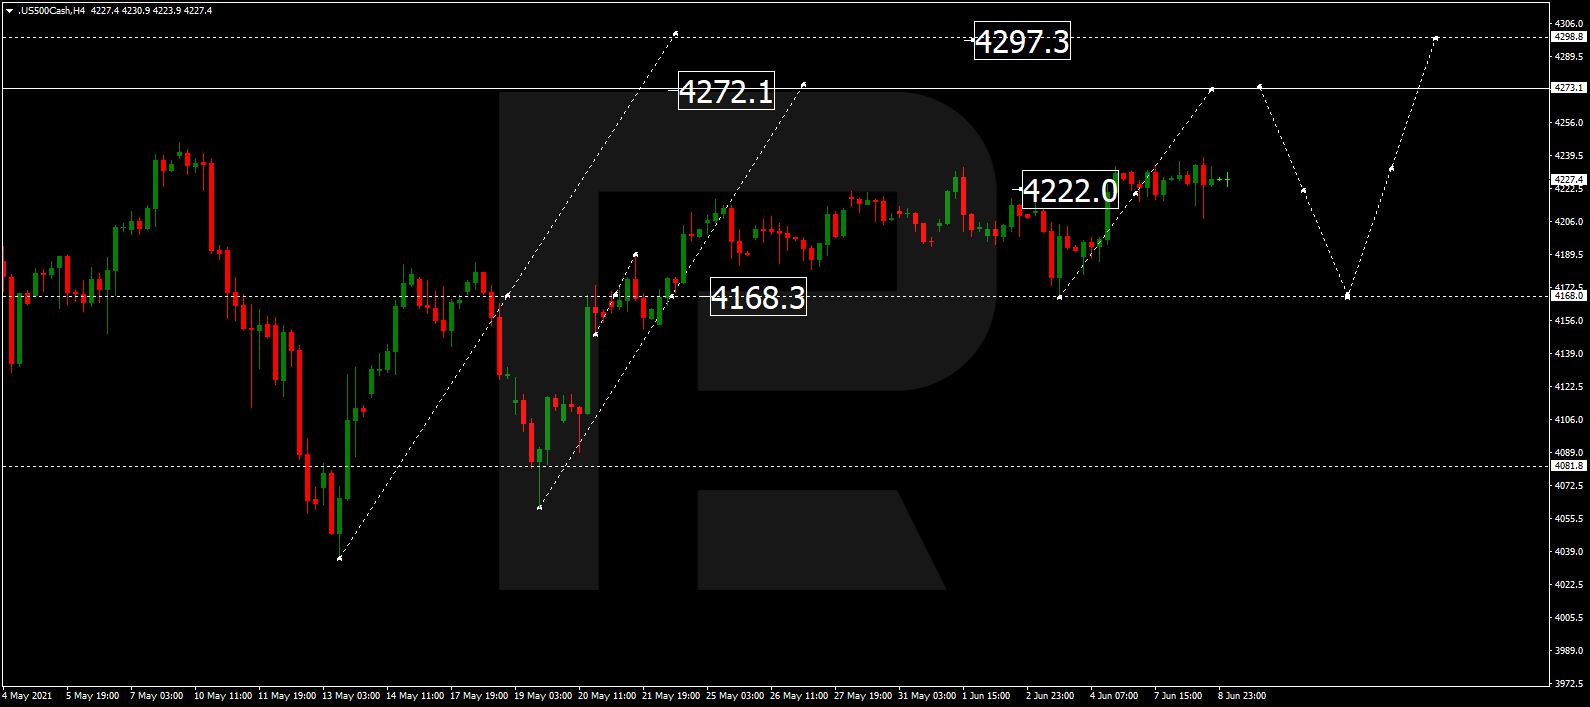
The S&P index is still consolidating around 4222.0. Possibly, today the asset may break this range to the upside and resume growing towards 4272.1. After that, the instrument may correct downwards to reach 4170.0 and then form one more ascending structure with the target at 4300.0.
Attention! Forecasts presented in this section only reflect the author’s private opinion and should not be considered as guidance for trading. RoboForex LP bears no responsibility for trading results based on trading recommendations described in these analytical reviews.
The EUR/USD currency pair has formed a narrow flat inside a wide corridor. Such uncertainty is common before important news releases. The situation is unlikely to change before the ECB interest rate decision, which will be published on Thursday.
Trading recommendations
Support levels: 1.2168, 1.2134, 1.2112, 1.2074, 1.2026, 1.2002, 1.1957
Resistance levels: 1.2212, 1.2243, 1.2311
The price is trading near the moving average line while the MACD indicator has become inactive. The uptrend is likely to resume, but only if the price breaks out through the priority change level of 1.2112. Under such market conditions, traders are better to look for both sell trades from the nearest resistance levels and buy trades from support levels within the upward momentum.
Alternative scenario: if the price breaks out through the 1.2212 resistance level and fixes above, the general uptrend is likely to resume.
News feed for 2021.06.09:
– US 10-y Bond Auction at 20:01 (GMT+3).
The GBP/USD currency pair
Technical indicators of the currency pair:
Prev Open: 1.4179
Prev Close: 1.4152
% chg. over the last day: -0.19%
London Interbank Offered Rate (LIBOR) has updated its minimum value again. Against the background of the dollar weakness, this situation plays in favor of the British currency. The GBP/USD currency pair is trading in the middle of a wide corridor, complicating the search for good entry points.
Trading recommendations
Support levels: 1.4110, 1.4075, 1.3996, 1.3913,1.3835, 1.3801, 1.3756, 1.3690
Resistance levels: 1.4191, 1.4212, 1.4338
The price is trading near the moving average, and the MACD indicator has become inactive. The trend of the GBP/USD currency pair remains bullish, as the price is above the priority change level. Under such market conditions, traders are better to look for buy trades from the support levels with the targets on the opposite boundary of the wide corridor with the 1.4107-1.4212 range.
Alternative scenario: if the price breaks down through the 1.4075 support level and consolidates below, the bullish scenario is likely to be canceled.
There is no news feed for today.
The USD/JPY currency pair
Technical indicators of the currency pair:
Prev Open: 109.24
Prev Close: 109.47
% chg. over the last day: +0.21%
The USD/JPY currency pair has also formed a narrow price range ahead of Thursday’s inflation (CPI) data. The currency pair is in a contradictory situation right now, as both the Dollar index and the Japanese yen are showing weakness. When both currencies show weakness, the price of the currency pair is usually trading in a corridor.
Trading recommendations
Support levels: 109.35, 109.13, 108.66, 108.44, 108.19, 107.77
Resistance levels: 109.83, 110.09 110.51, 110.73
Technically, the mid-term trend is bullish as the price is above the priority change level of 109.13. The price is trading near the moving average while the MACD indicator is inactive. Under such market conditions, traders are better to look for both buy trades from the nearest support levels and sell trades from resistance levels within the bearish momentum. But it’s better to look for trades on lower timeframes.
Alternative scenario: if the price falls below 109.13, the general downtrend is likely to resume.
There is no news feed for today.
The USD/CAD currency pair
Technical indicators of the currency pair:
Prev Open: 1.2080
Prev Close: 1.2115
% chg. over the last day: +0.29%
The USD/CAD currency pair slowly but surely moves to the priority change level. Yesterday, the price broke out of the narrow range. The interest rate from the Bank of Canada is expected today. Experts believe that the rate will remain the same, but the Canadian dollar is likely to be sensitive to changes in economic forecasts. Many analysts expect a large corrective movement of the USD/CAD pair, and today’s news could trigger a change in priority.
Technically, the trend remains bearish. But the current momentum is strictly bullish. Under such market conditions, traders are better to look for both sell trades from the nearest resistance levels and buy trades from support levels, but only on intraday timeframes. Though, it should be noted that the price is still inside a wide corridor with the 1.2032-1.2137 range.
Alternative scenario: if the price breaks out through the 1.2137 resistance level and fixes above, a local corrective uptrend is likely to form.
News feed for 2021.06.09:
– Bank of Canada Rate Statement (m/m) at 17:30 (GMT+3).
This article reflects a personal opinion and should not be interpreted as an investment advice, and/or offer, and/or a persistent request for carrying out financial transactions, and/or a guarantee, and/or a forecast of future events.
The US stock indices closed almost unchanged. The best performing index was the tech index Nasdaq, which increased by 0.3%, mainly due to the growth of FAANG companies (Facebook, Amazon, Apple, Netflix, Google). There is a lot of uncertainty among investors right now because everyone is waiting for inflation figures and no one is willing to take an additional risk before the statistics come out. But at the same time, meme-shares continue to pump one by one. Yesterday, Clover Health Investments (Ticker CLOV), which grew by 85%, was the growth leader. It became the most mentioned stock on the Reddit WallStreetBets forum.
European indices were mixed and closed the day with the mixed dynamics on Tuesday. The shares of telecom, tourism, and real estate companies became the leaders of the growth in Western Europe. Yesterday, Germany published a weak report on industrial production. The UK does not plan to lift the quarantine restrictions until the end of the month, this factor restrains the growth of the British currency.
Against the background of the signs of recovery in fuel demand in Europe and taking into account the fact that the prospect of resumption of Iranian oil supplies has weakened in the short term, all this plays in favor of the “black gold” price growth. Yesterday, WTI futures price reached $70.63 a barrel, renewing a two-year maximum again.
The situation with gold remains unchanged. While the US bond yields are at their lows, with inflation strengthening, the price of gold and silver will rise.
China has reported the inflation data. Rising commodity prices increased the factory inflation rate to its highest level since 2008 in May, which further aggravated already high concerns of investors about inflationary pressure. Chinese authorities announced that the producer price index is likely to continue rising in the second quarter, but then will start to decline. In Australia, the real estate sector is a hot topic. Rising prices and rapidly deteriorating housing affordability are putting serious pressure on the country’s main stock index.
Main market quotes:
S&P 500 (F) 4,227.26 +0.74 (+0.02%)
Dow Jones 34,599.82 -30.42 (-0.09%)
DAX 15,640.60 -36.55 (-0.23%)
FTSE 100 7,095.09 +17.87 (+0.25%)
USD Index 90.12 +0.17 (+0.19%)
Important events:
– China Consumer Price Index (m/m) at 04:30 (GMT+3);
– Canada BOC Rate Statement (m/m) at 17:30 (GMT+3);
This article reflects a personal opinion and should not be interpreted as an investment advice, and/or offer, and/or a persistent request for carrying out financial transactions, and/or a guarantee, and/or a forecast of future events.
It’s been a fairly quiet start to the week in many markets with FX ranges narrow and directionless trading in the dollar after the signature US payrolls data last week failed to embolden either the bulls or the bears. Asian markets are mixed and European bourses have opened up in similar fashion. That said, global equity indices are still sitting near to record / cycle highs as the Fed’s patient message continues to mean the stimulus punchbowl are still being passed around.
We had another reminder this morning about rising price pressures with China’s producer prices increasing at their fastest pace in 13 years. Soaring commodity prices as well as a low base effect after being in negative territory for most of last year has seen the index jump in recent months. This will add to global inflationary pressures and perhaps more action from the Chinese government economic planning agency who last month warned of “excessive speculation” in commodity markets and a crack down on monopolies.
Majors rangebound
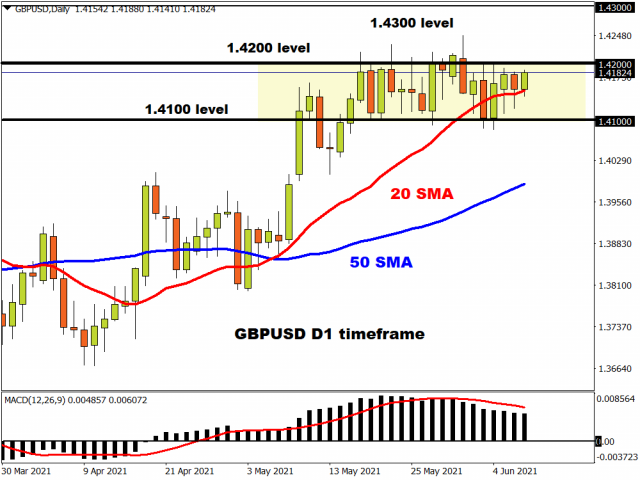
Expect more quiet trade in dollar crosses today ahead of the US CPI data and ECB meeting tomorrow. Sterling is trapped in a 1.41-1.42 range with the reopening delay not unduly worrying markets that much. June 21 has been in the minds of many in the UK, but a postponement of a couple of weeks is being signalled by the government.
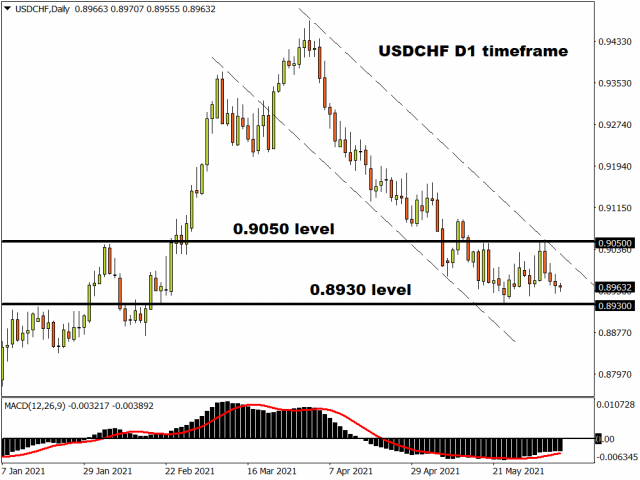
The swissie has been attracting buyers this week ahead of the ECB meeting tomorrow with USD/CHF back into its descending channel after venturing north last week above 0.9050. Bear will target the cycle low at 0.8930 unless the US inflation data prints to the topside of estimates.
Bank of Canada to stand pat
After shifting to a hawkish bias at its last meeting in April with the signalling of a rate rise in late 2022 and a second taper of its QE program, the leading hawkish central bank of the moment is set to wait for more post-lockdown data before continuing on its merry way to policy normalisation. A positive tone is expected from the Bank of Canada with an impressive vaccine rollout and strong CPI figures offset by two months of disappointing jobs data.
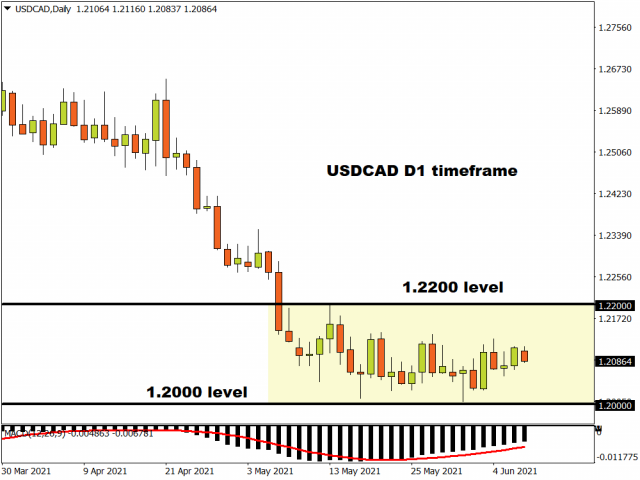
USD/CAD continues to consolidate above long-term support around 1.20. Any rebounds have been lacking in momentum with prices only moving above 1.22 on one occasion since mid-May. A downside break needs to develop sooner rather than later though as otherwise a deeper retracement may come into play.
Disclaimer: The content in this article comprises personal opinions and should not be construed as containing personal and/or other investment advice and/or an offer of and/or solicitation for any transactions in financial instruments and/or a guarantee and/or prediction of future performance. ForexTime (FXTM), its affiliates, agents, directors, officers or employees do not guarantee the accuracy, validity, timeliness or completeness, of any information or data made available and assume no liability as to any loss arising from any investment based on the same.
Euro traders have had to contend with a mixed bag of economic data at the onset of the week.
First, there was the unexpected decline in Germany’s factory orders released Monday, which showed a 0.2% drop in April compared to the month prior. This was in stark contrast to the projected 0.5% month-on-month gain.
On Tuesday, Germany’s April industrial production also posted a surprise 1% month-on-month contraction, compared to the market estimates for 0.4% growth, due to lower domestic demand.
On the other hand, the ZEW survey of Germany’s current conditions in June is at its highest since July 2019.
Also, the broader Eurozone posted a Q1 GDP final print today that had been revised upwards from a 0.6% quarter-on-quarter contraction to 0.3%, while the year-on-year figure was changed from a 1.8% decline to 1.3%, thanks to some positive surprises out of Italy.
Although the headline GDP print suggests that the Q1 recession in the Eurozone was not as deep as expected, potentially setting the base for a stronger recovery this quarter, yet the April manufacturing data out of the region’s largest economy shows that such optimism could be on shaky ground.
These push and pull factors have kept EURUSD just shy of the 1.22 psychological mark for the time being.
Markets are awaiting the potentially bigger catalyst for EURUSD that’s lying in wait.
And it’s less likely to be the European Central Bank policy meeting on Thursday, but more so the release of the May US consumer price index.
The biggest theme in global financial markets at present is the debate surrounding the timeline for the Fed’s next move. Some segments of the markets argue that US consumer prices that run too hot too fast could trigger the world’s most influential central bank (the Fed) into paring back its support for financial markets sooner than expected. Meanwhile, the Fed is urging patience, saying that these inflationary pressures are likely to be transitory, which implies they’ll maintain their ultra-accommodative policy stance for longer.
And the euro is not immune from such shifting expectations in this ongoing debate.
Consider how EURUSD quickly recovered in the wake of another miss in the US nonfarm payrolls print. May’s headline figure came in at 559k, which is lower than the forecasted 675k, prompting markets to rapidly unwind their optimism over the anticipated blockbuster NFP print which failed to materialise.
And with the European Central Bank unlikely to adjust their policy settings at their 10 June meeting, this sets up the US CPI announcement to be the larger catalyst for the FX universe, and more so for the world’s most-traded currency pair. Of course, should the ECB provide surprise cues that policymakers are warming up to the idea of reining in their Pandemic Emergency Purchase Programme (PEPP), that is sure to jolt the shared currency as well.
For now, the focus remains on what happens stateside.
Markets are currently expecting a 4.7% year-on-year increase in May, with the month-on-month reading expected to come in at 0.4%. Core inflation is forecasted to grow 3.5% compared to May 2020, while a 0.5% rise is expected compared to April 2021.
Further signs of inflationary pressures could send US Treasury climbing, boosting the dollar along the way while prompting EURUSD to test the 1.21 Fibonacci support level once more. A lacklustre inflation print however may encourage more dollar softness, potentially allowing EURUSD to breach 1.22 again.
Alternatively, the less volatile conduit could be the Euro index which is an equally-weighted index comprising the following pairs:
Hence this index’s performance this week could be mitigated by how the euro fares against other G10 peers, as opposed to the full force of an inflation shocker being manifested in EURUSD.
Disclaimer: The content in this article comprises personal opinions and should not be construed as containing personal and/or other investment advice and/or an offer of and/or solicitation for any transactions in financial instruments and/or a guarantee and/or prediction of future performance. ForexTime (FXTM), its affiliates, agents, directors, officers or employees do not guarantee the accuracy, validity, timeliness or completeness, of any information or data made available and assume no liability as to any loss arising from any investment based on the same.
















 Article by


