EIA Report: How High Can Oil Go?

By Orbex

Crude prices have been moving higher this week after snapping an initial move lower, following an unexpectedly hawkish tone from the Fed.

Even though the initial move in WTI was easily attributable to the strengthening of the dollar; since the start of the week, the dollar has been relatively flat. However, crude has continued to move higher.

One of the reasons for this is that investors are increasingly factoring in that OPEC will keep oil cuts in place at the next meeting.

Meanwhile, US retailers are stocking up ahead of the three-day weekend around July 4. The holiday weekend typically sees more travel. This is particularly true now with the lifting of covid restrictions.

Hence, we could expect to see a further build in gasoline inventories in tomorrow’s EIA report.

Where we are going

Moreover, there is a further consensus among analysts that EIA crude stocks will show a further decline in inventory. Generally, this is associated with a rise in crude prices, as the US increases its demand for imported fuel.

Although mobility trackers are now just 4% below pre-pandemic levels, there is an expectation of a seasonal increase in demand over the coming months. Additionally, airlines are reporting increasing load factors and are looking to acquire more refined fuel.

On the other hand, higher natural gas prices are pushing US power plants to use more coal. This is particularly relevant given the recent spike in temperatures across the southwest. Near-record temperatures have demanded more electricity for air conditioning.

An unusually large number of thermoelectric plants are offline in Texas, due to maintenance after the harsh weather in winter. This increases demand for peaking power, supplied by diesel and natural gas generators.

Upcoming risk events

Moving forward from these, the focus is now shifting towards the July OPEC meeting.

The latest report showed the production cut compliance was 115%. This suggests that OPEC members are not all that interested in fighting over market share.

Moreover, OPEC is reportedly expecting that the US crude production will not rise significantly in the coming years.

An additional factor to this belief is the latest delay in reaching an agreement on resuming the Iran nuclear deal. The deal is not expected to be announced at least until after the next OPEC meeting.

Experts anticipate that Iran joining the market would offset some of the strength of the Saudi-Russia axis within OPEC, which appears to be happy with higher crude prices.

Getting things in order

While the US is pushing to sign a deal before the inauguration of the new Iranian president, the “lame duck” administration in Iran might find it more convenient to wait until after.

The new administration’s more hardline attitude could have political implications for the US, including further negotiations to reach a deal.

That said, Ebrahim Raisi will be sworn in as the new Iranian president on August 3rd. Meanwhile, negotiators in Vienna are hopeful that a deal can be reached “in the next couple of weeks”.

By Orbex

Japanese Candlesticks Analysis 22.06.2021 (USDCAD, AUDUSD, USDCHF)

Article By RoboForex.com

USDCAD, “US Dollar vs Canadian Dollar”

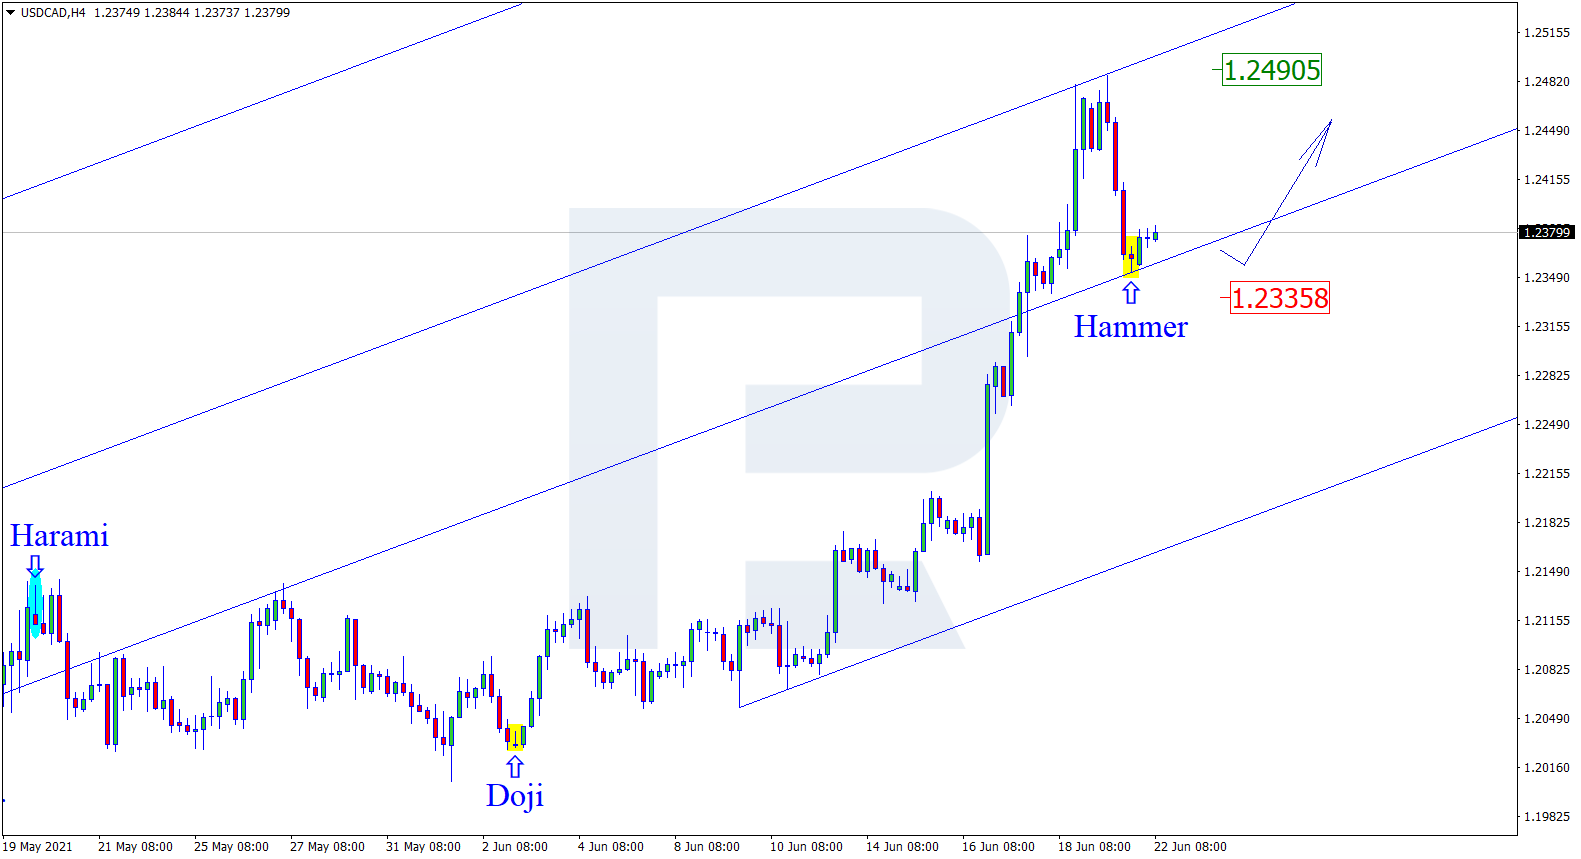
As we can see in the H4 chart, the asset continues testing the support level where it has formed several reversal patterns, including Hammer. At the moment, USDCAD may reverse and start a new growth towards 1.2490. After testing this level, the price may break it and continue its ascending tendency. However, an alternative scenario implies that the asset may fall to reach the next support area at 1.2335 before further growth.

USDCAD
Risk Warning: the result of previous trading operations do not guarantee the same results in the future

AUDUSD, “Australian Dollar vs US Dollar”

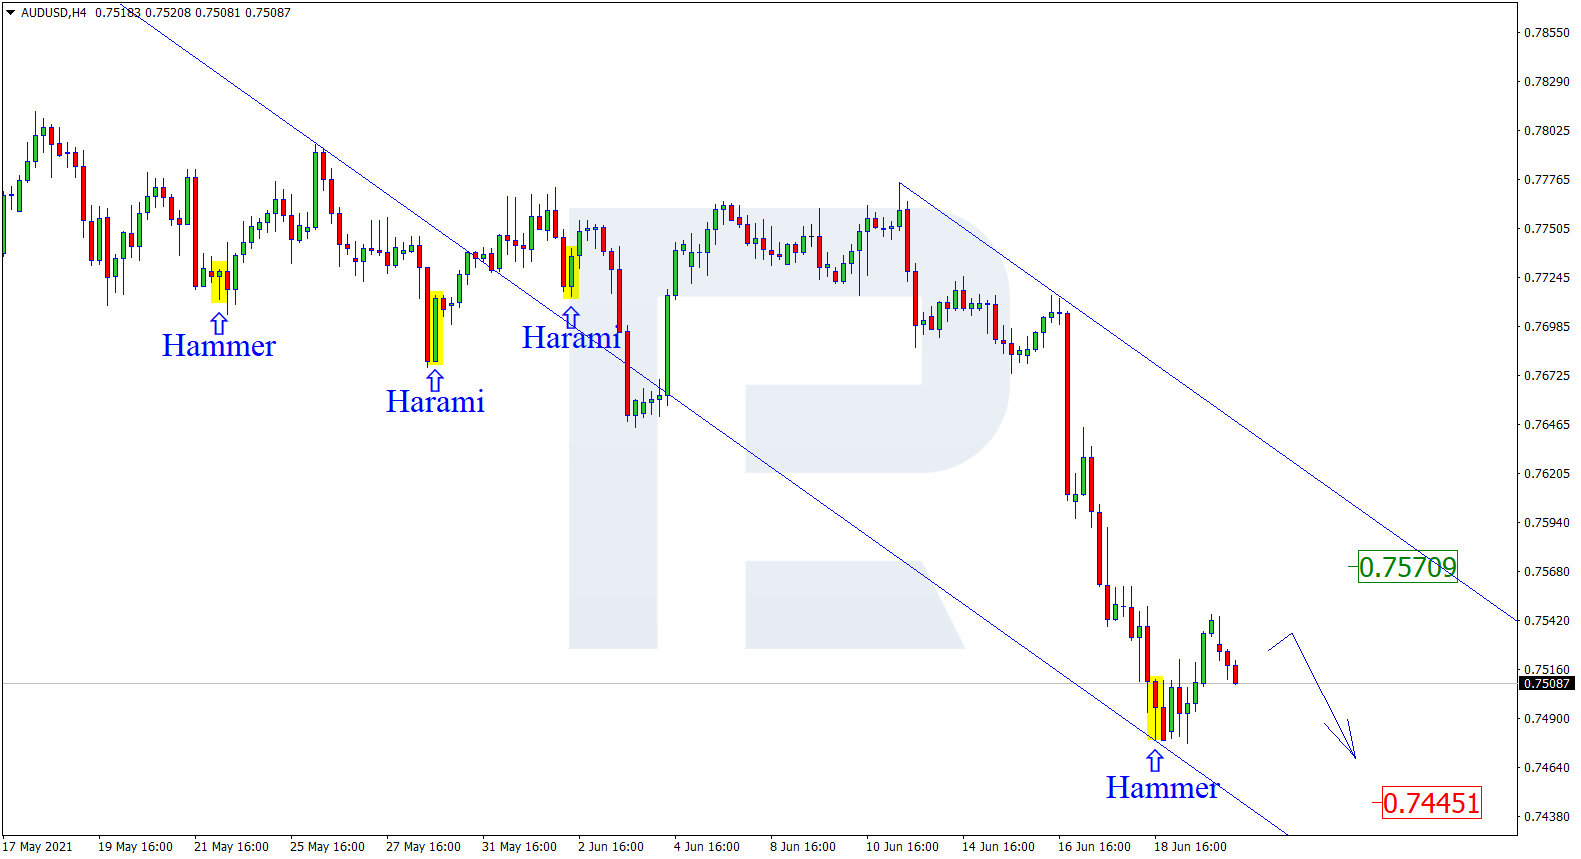
As we can see in the H4 chart, AUDUSD has formed several reversal patterns, such as Hammer, not far from the support level. At the moment, the asset may reverse in the form of another ascending impulse. In this case, the upside target may be the resistance area at 0.7570. At the same time, an opposite scenario implies that the price may fall towards the support level at 0.7445, break it, and then continue trading downwards.

AUDUSD
Risk Warning: the result of previous trading operations do not guarantee the same results in the future

USDCHF, “US Dollar vs Swiss Franc”

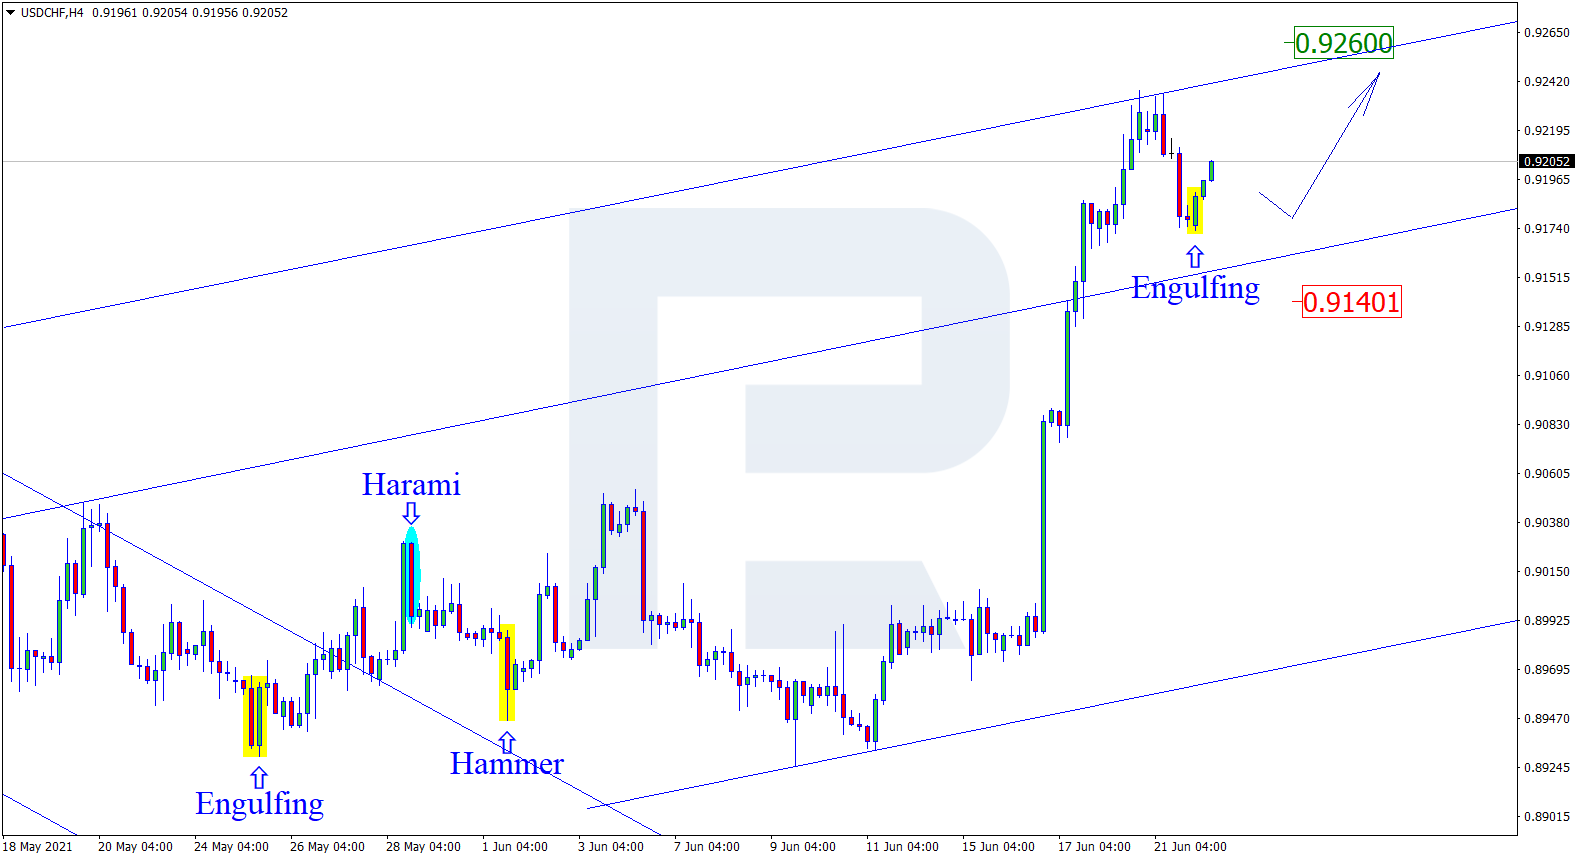
As we can see in the H4 chart, the asset is still rebounding from the support area, where it has formed an Engulfing reversal pattern. At the moment, USDCHF may reverse and start a new growth. In this case, the upside target may be the resistance level at 0.9260. Still, there might be an alternative scenario, according to which the asset may return to 0.9140 before resuming its growth.

USDCHF

Article By RoboForex.com

Attention!
Forecasts presented in this section only reflect the author’s private opinion and should not be considered as guidance for trading. RoboForex LP bears no responsibility for trading results based on trading recommendations described in these analytical reviews.

Intraday Market Analysis – EUR In Fragile Rebound

By Orbex

EURUSD faces psychological resistance

EURUSD

The euro rises back after ECB officials’ comment that global inflation is of a temporary nature.

Indeed, the pair is consolidating, which is usually the case following a strong directional movement.

The RSI has recovered into the neutrality area. Its divergence indicates a slowdown in the sell-off. 1.1925 is the immediate resistance. Its breach would lead to the psychological level of 1.2000, where sellers are likely to double down.

A break under 1.1850 may trigger a 100-pip sell-off towards 1.1750, a critical daily support.

AUDUSD tests daily support

AUDUSD

The Australian dollar is under pressure after flat retail sales numbers in May.

The sell-off below the major daily support (0.7550) and the lower range of a near six-month consolidation, are a strong bearish signal for the coming weeks. The pair is hovering above the next support at 0.7475 from the daily timeframe.

On an intraday level, the RSI has recovered from an extremely oversold situation. The bullish divergence suggests a loss in the downward momentum. A rebound will need to clear 0.7550 to gain traction.

US 30 recovers to key resistance

Dow Jones

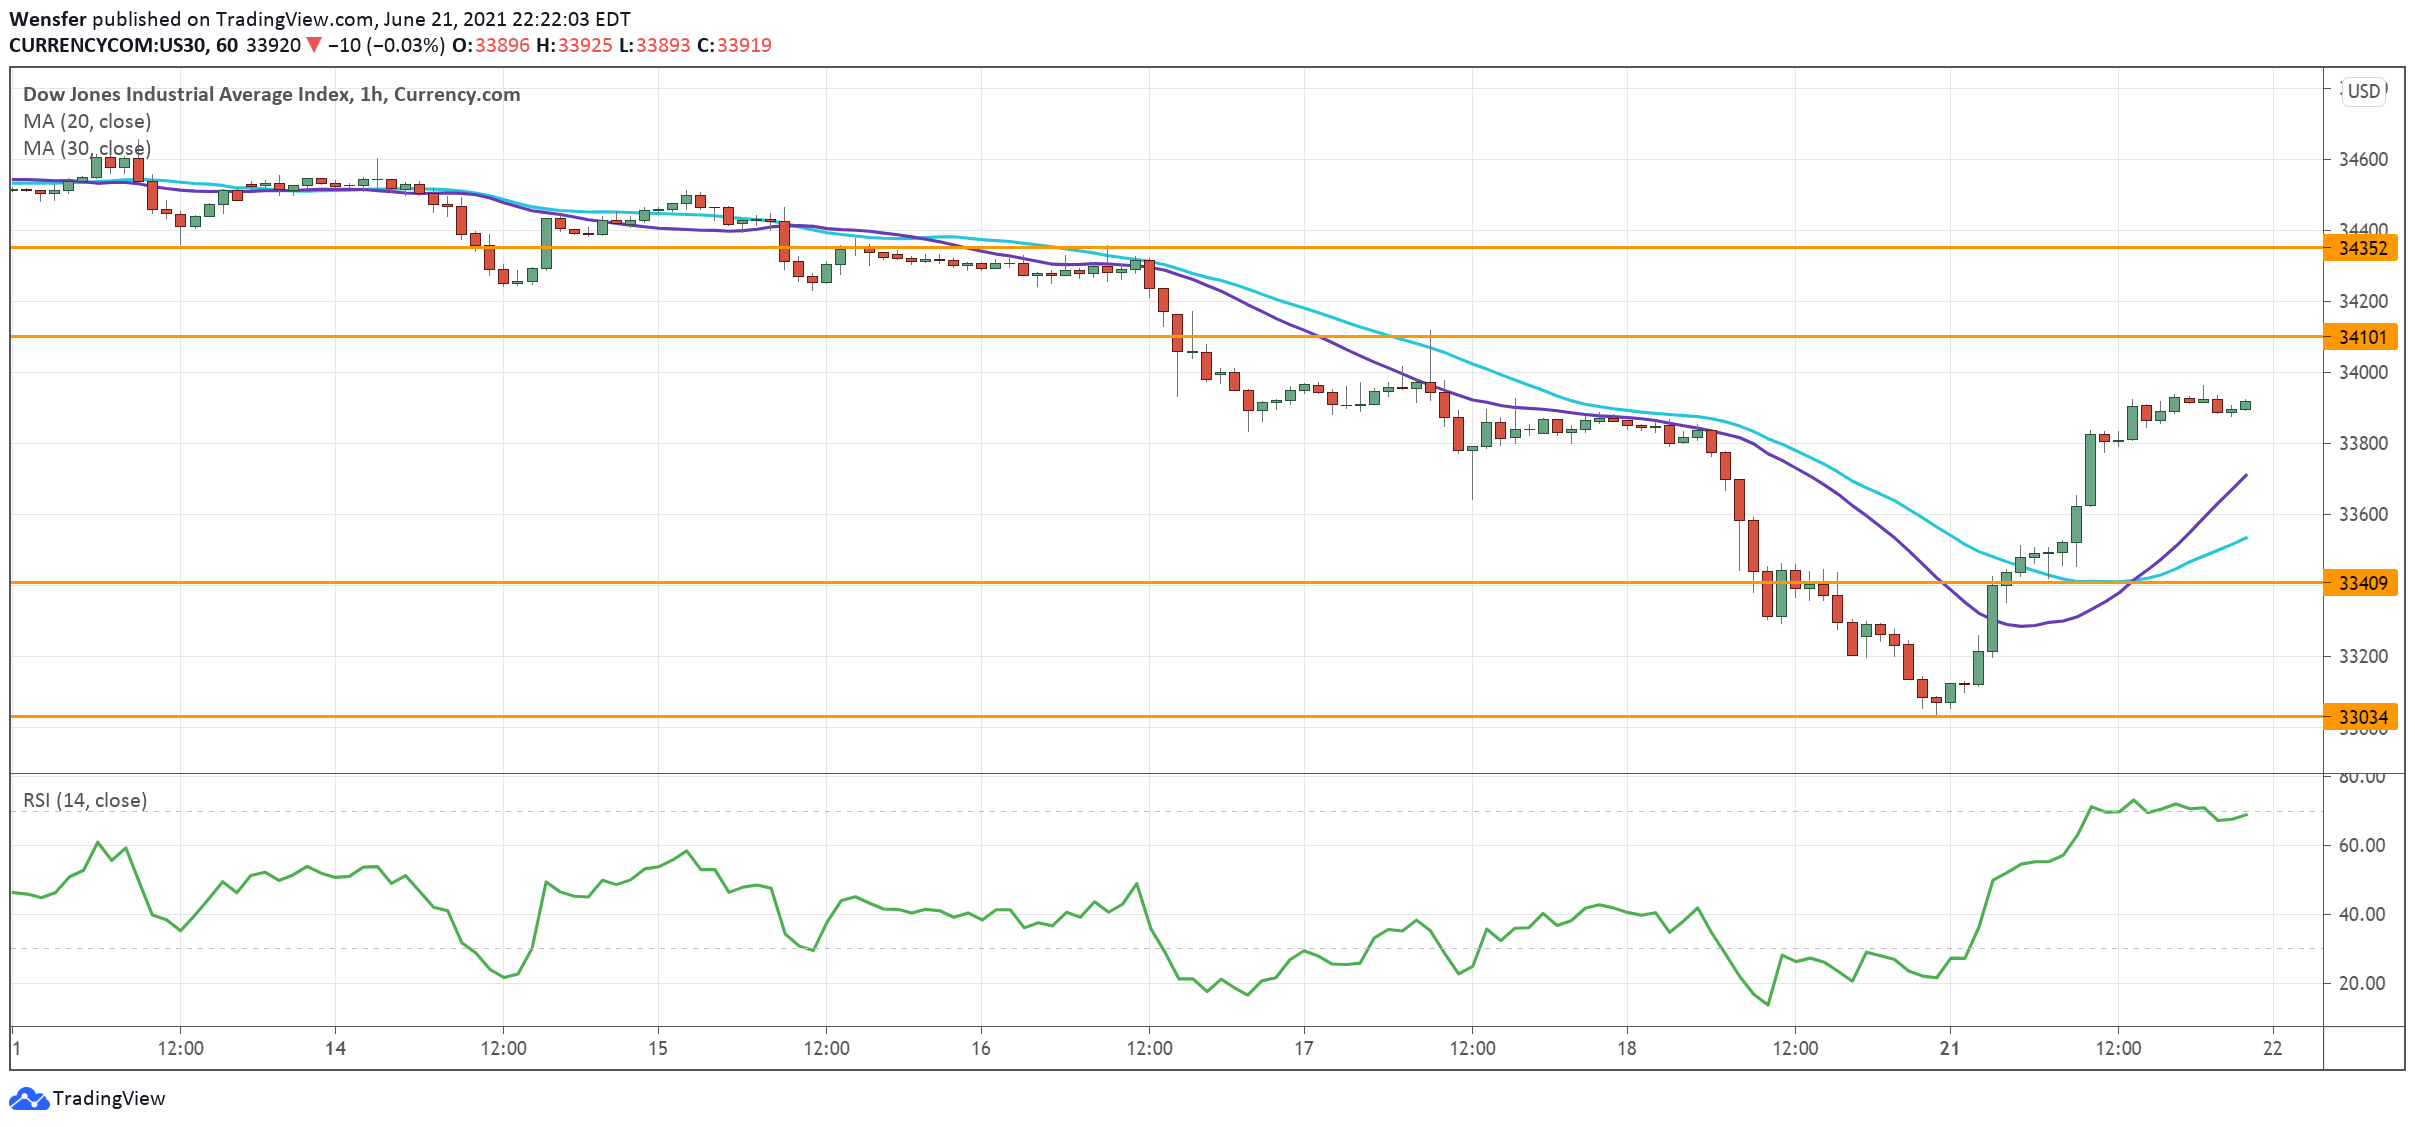
While the Dow Jones index recovers some of last week’s losses, sentiment, however, remains downbeat.

Price action has fallen below 33300, a critical support on the daily chart. While it would be too soon to call it an outright bearish reversal, the index is likely to go sideways in the short term.

The technical bounce may face stiff selling pressure around 34100, a demand zone turned into a supply zone as trapped buyers await to bail out unscathed. 33400 is the closest support when an overbought RSI falls back.

By Orbex

Forex Technical Analysis & Forecast 22.06.2021

Article By RoboForex.com

EURUSD, “Euro vs US Dollar”

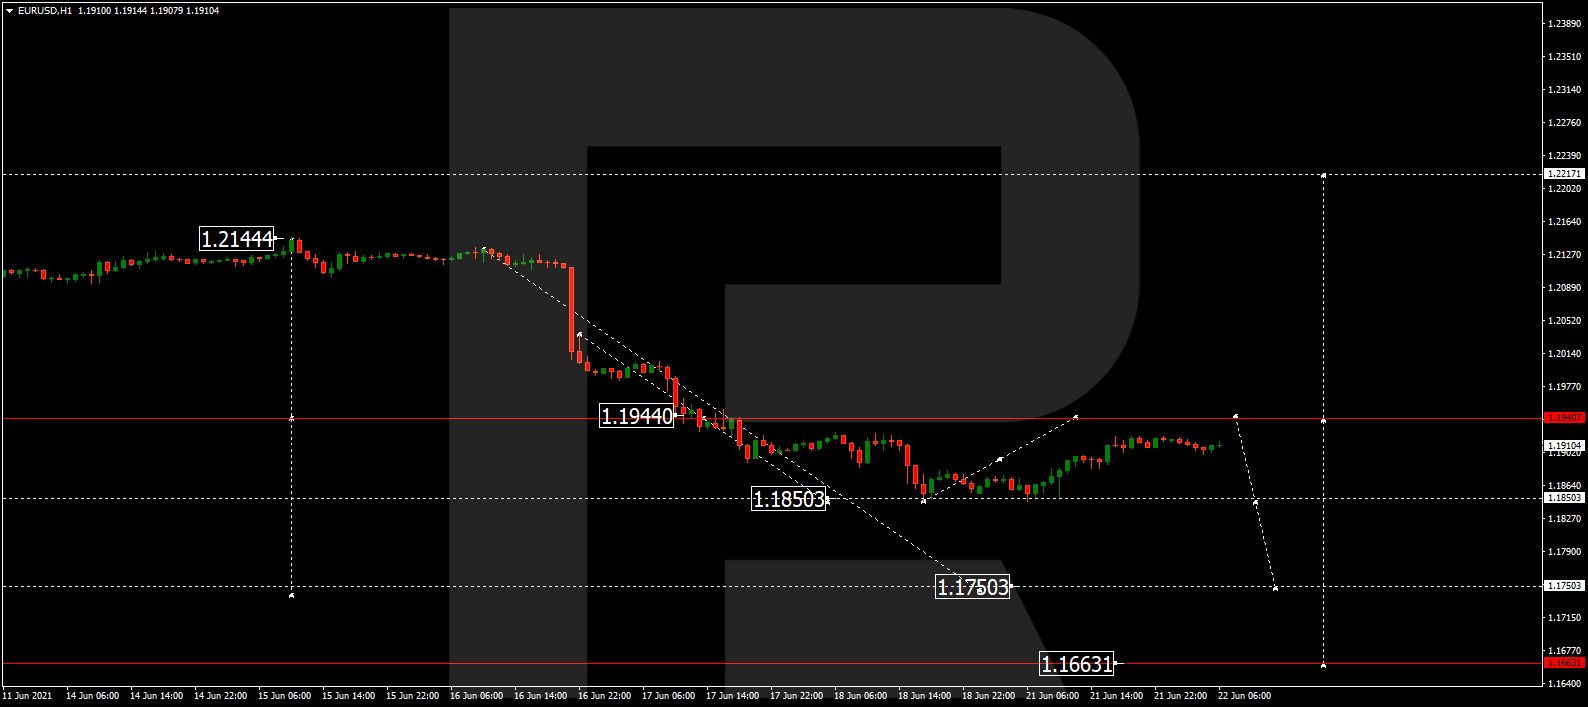
EURUSD is still correcting towards 1.1944 and may later resume falling with the short-term target at 1.1750. After that, the instrument may start a new growth to return to 1.1944 and then resume trading downwards to reach 1.1660.

EURUSD
Risk Warning: the result of previous trading operations do not guarantee the same results in the future

GBPUSD, “Great Britain Pound vs US Dollar”

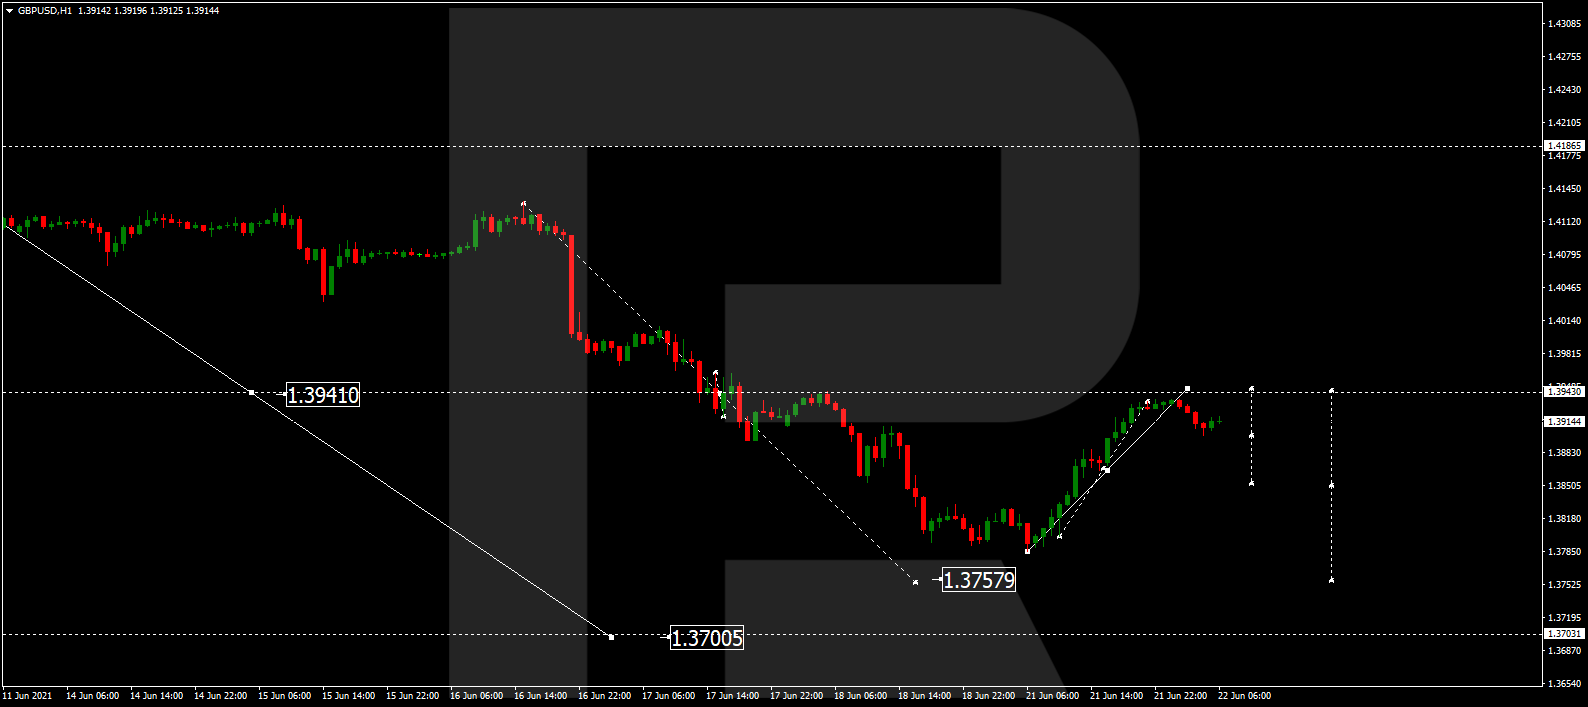
GBPUSD continues the correction to reach 1.3941. Later, the market may form a new descending structure with the short-term target at 1.3757.

GBPUSD
Risk Warning: the result of previous trading operations do not guarantee the same results in the future

USDRUB, “US Dollar vs Russian Ruble”

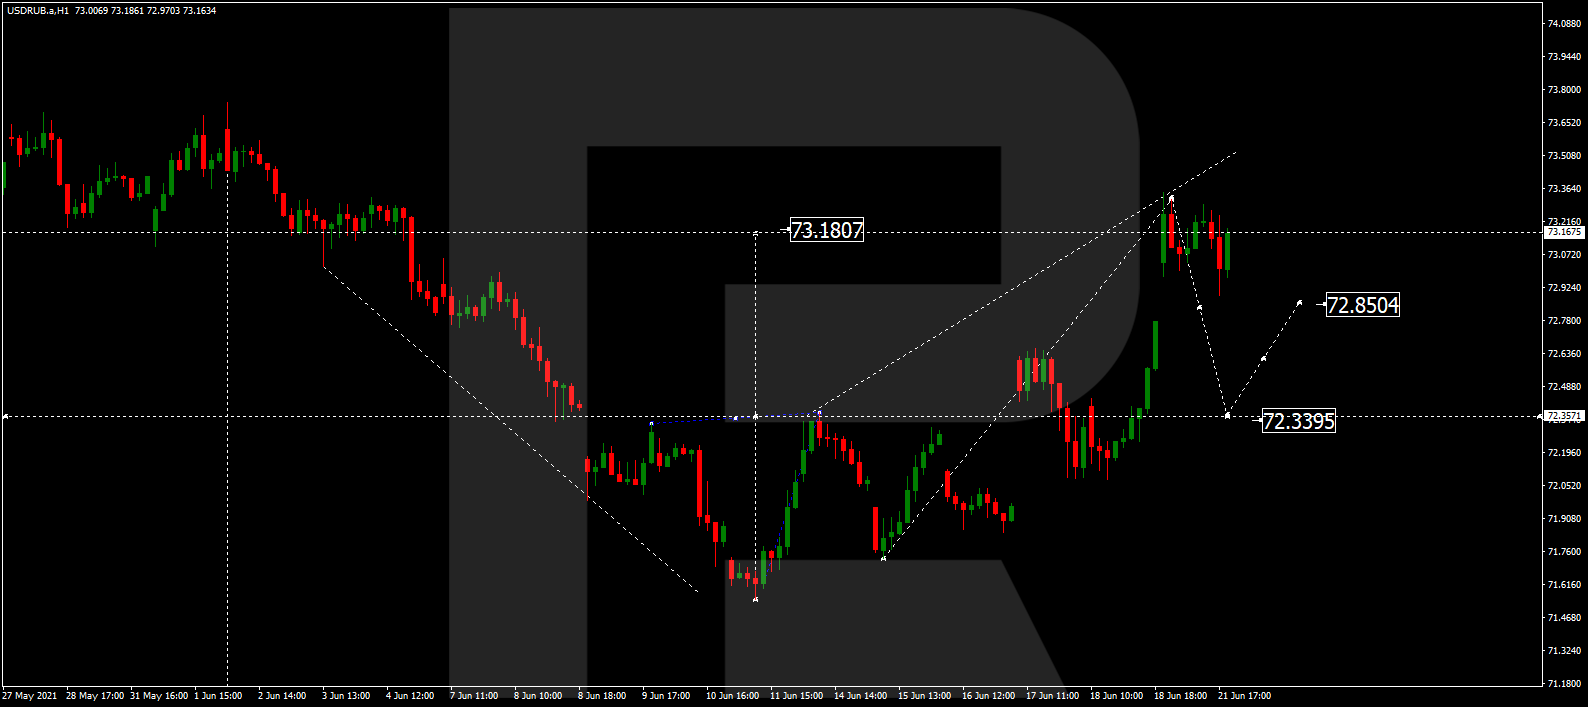
After finishing the ascending wave at 73.30, USDRUB is expected to consolidate below this level. After breaking this range to the downside, the instrument may start another decline to break 72.32 and then continue falling with the target at 71.00.

USDRUB
Risk Warning: the result of previous trading operations do not guarantee the same results in the future

USDJPY, “US Dollar vs Japanese Yen”

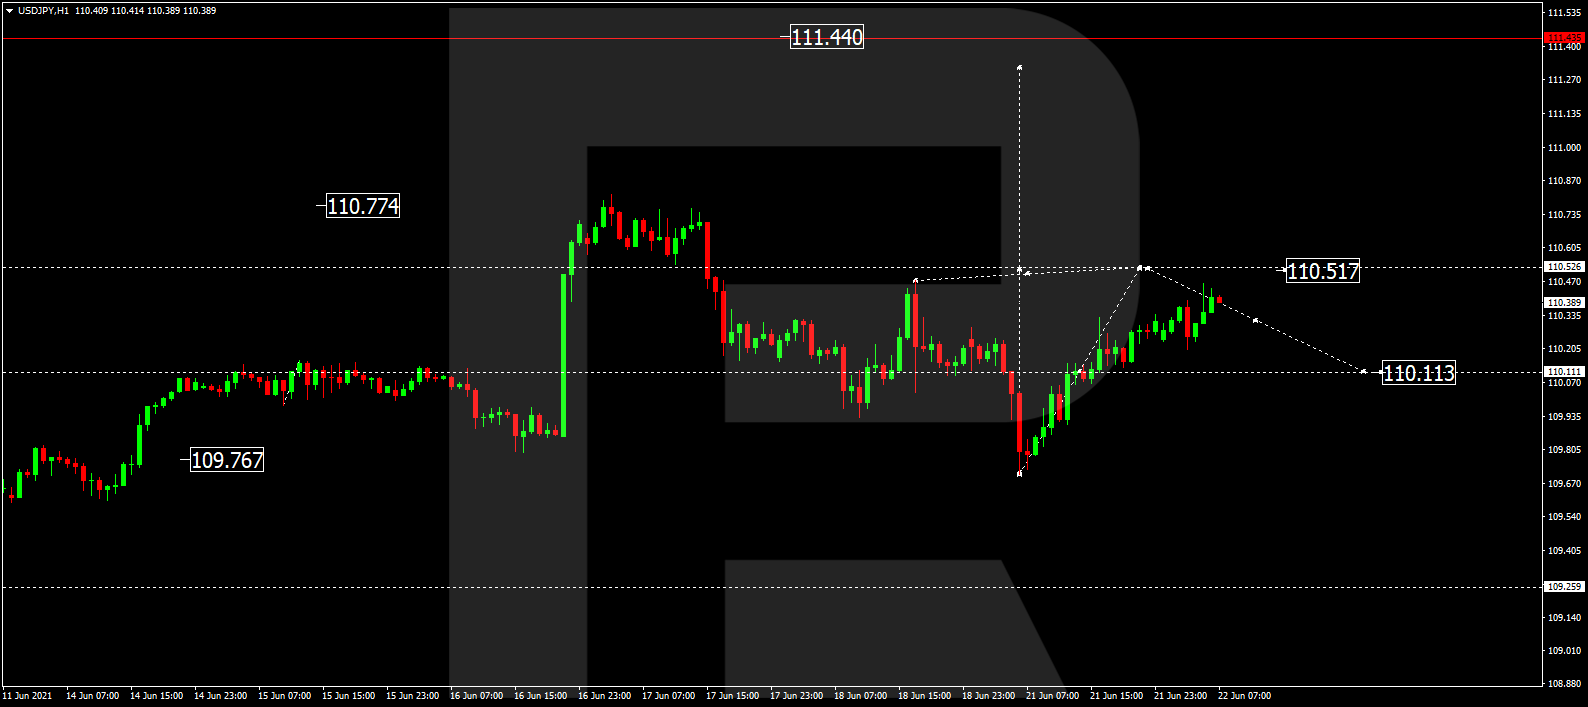
USDJPY is growing towards 110.51. Later, the market may form a new descending structure to reach 110.11 and then resume trading upwards with the target at 111.33.

USDJPY
Risk Warning: the result of previous trading operations do not guarantee the same results in the future

USDCHF, “US Dollar vs Swiss Franc”

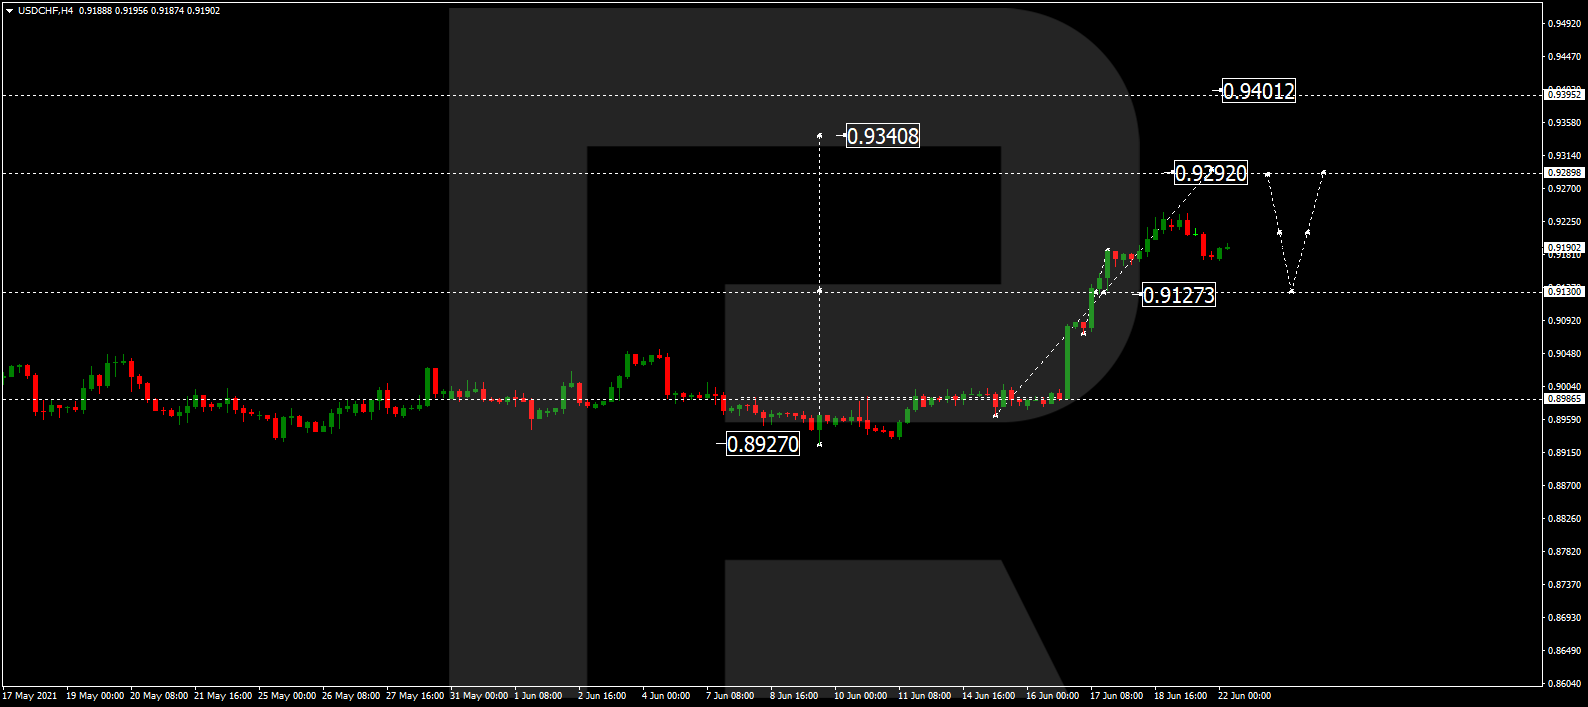
USDCHF is still moving upwards to reach 0.9292. After that, the instrument may start a new correction to return to 0.9127 and then form one more ascending structure with the target at 0.9400.

USDCHF
Risk Warning: the result of previous trading operations do not guarantee the same results in the future

AUDUSD, “Australian Dollar vs US Dollar”

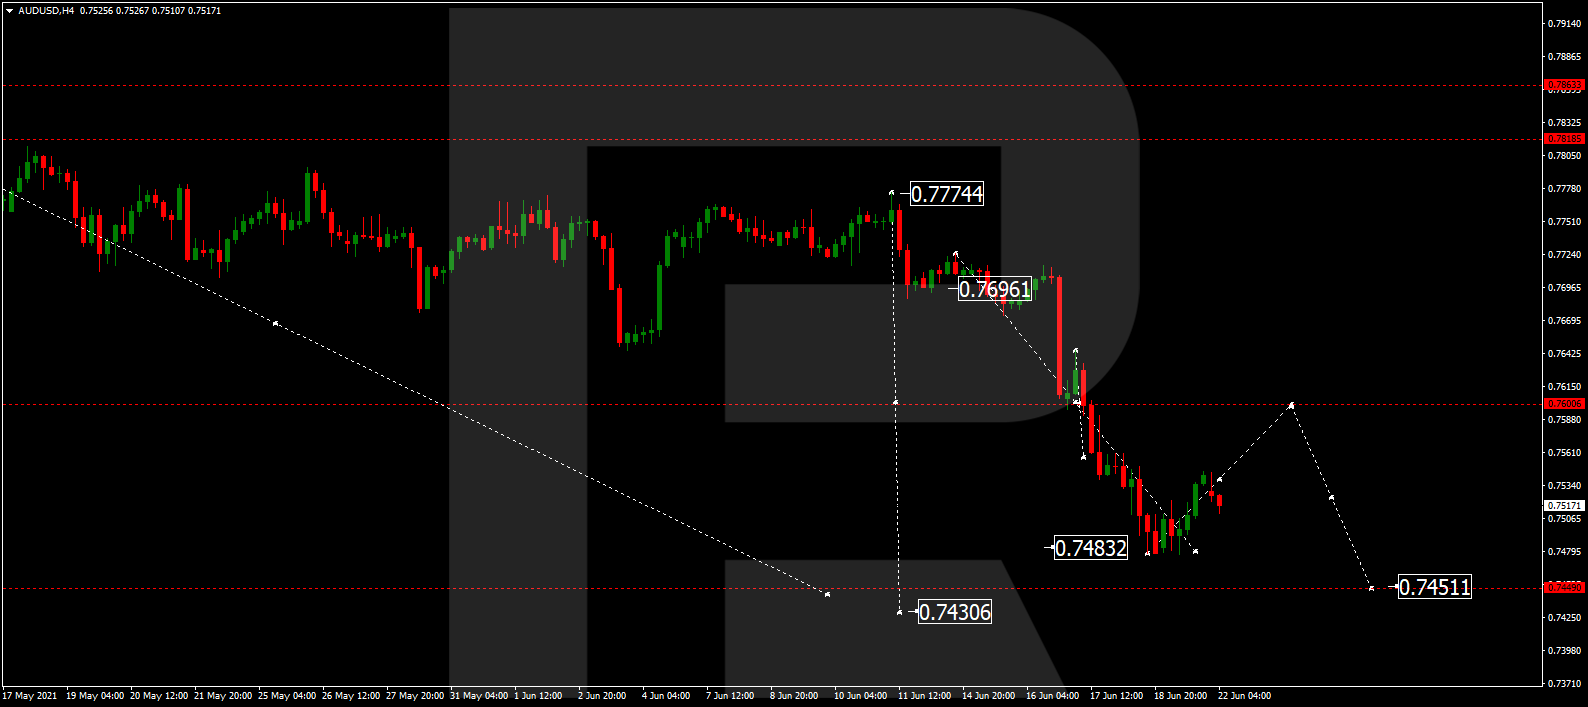
AUDUSD is still correcting towards 0.7600. Later, the market may resume trading downwards with the short-term target at 0.7451.

AUDUSD
Risk Warning: the result of previous trading operations do not guarantee the same results in the future

BRENT

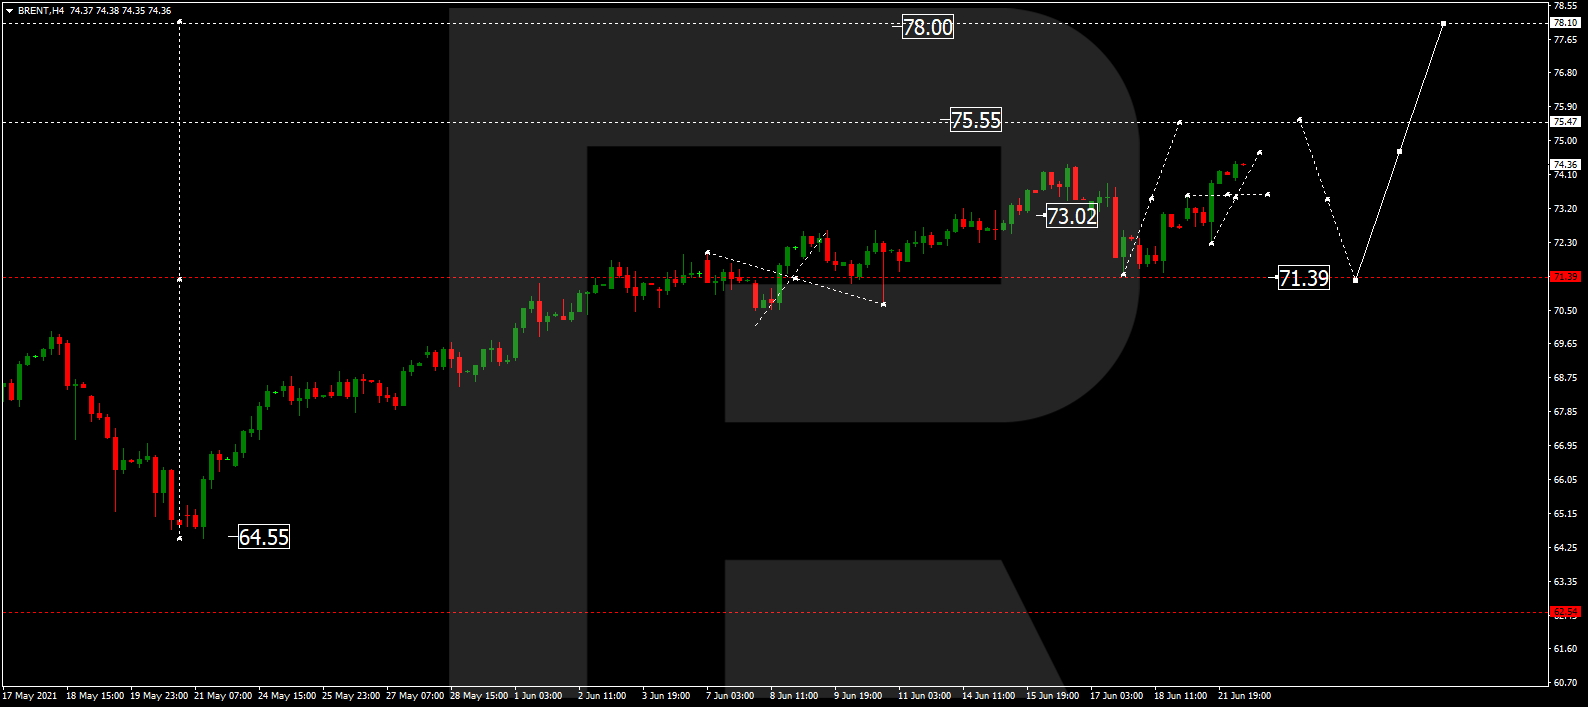
Brent continues growing towards 74.74 and may later form a new descending structure to reach 73.50. After that, the instrument may start another growth with the short-term target at 75.55 and then correct downwards to reach 70.00.

BRENT
Risk Warning: the result of previous trading operations do not guarantee the same results in the future

XAUUSD, “Gold vs US Dollar”

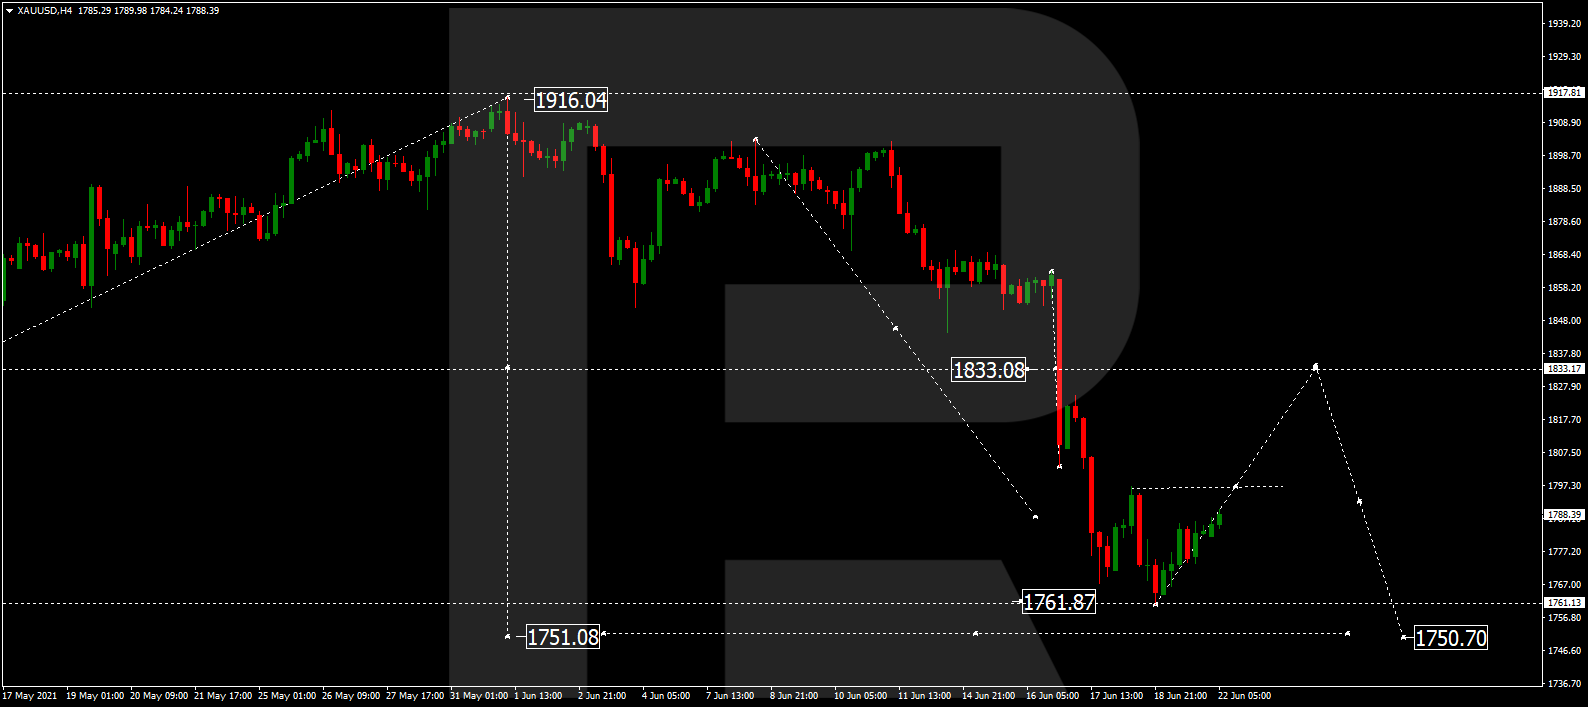
Gold is still consolidating above 1761.78. Possibly, the metal may break the range to the upside and correct towards 1833.20. Later, the market may resume trading downwards with the target at 1750.70.

GOLD
Risk Warning: the result of previous trading operations do not guarantee the same results in the future

S&P 500

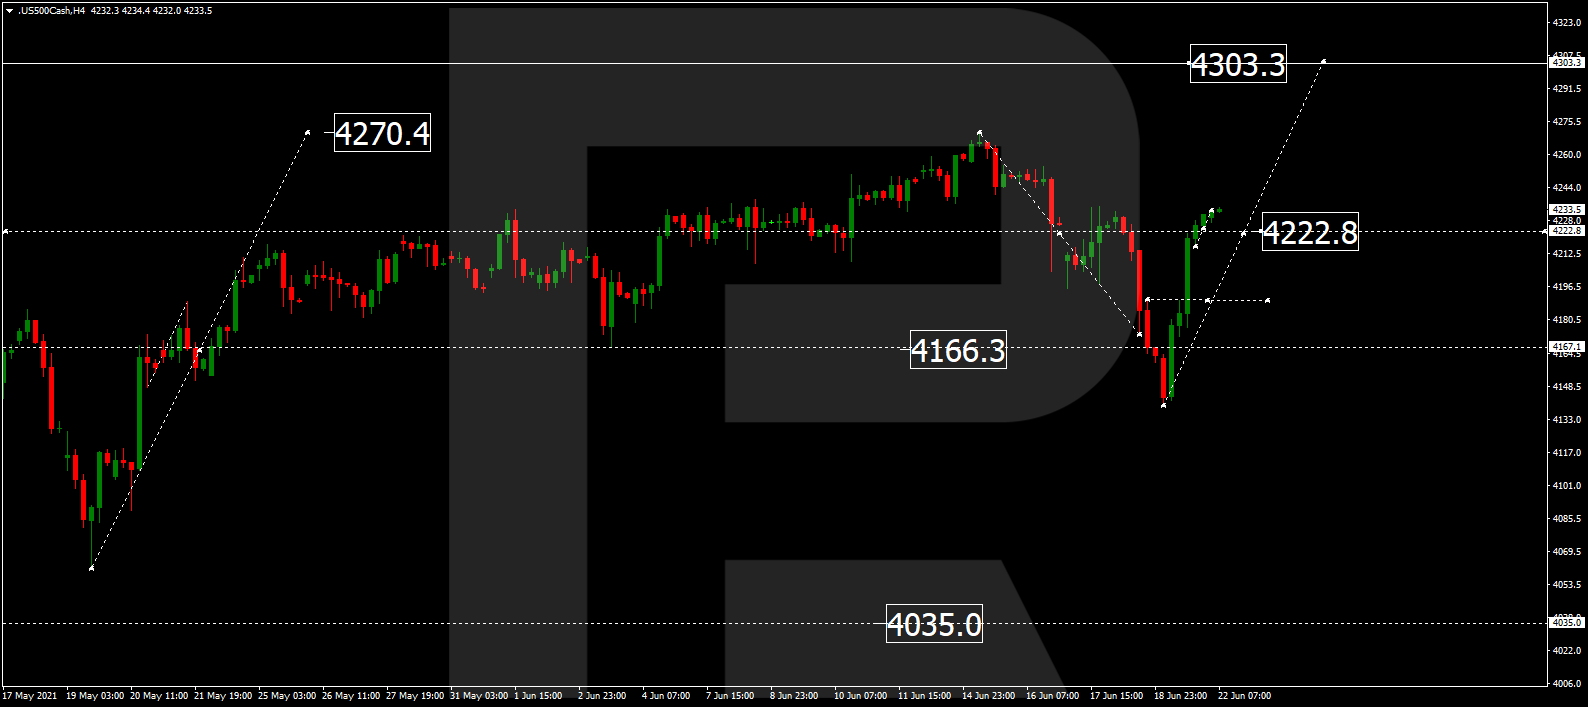
After finishing the ascending wave at 4222.8, the S&P index is consolidating around this level. If later the price breaks this range to the upside, the market may form one more ascending structure with the target at 4303.3 and then resume trading downwards to reach 4166.1.

S&P 500

Article By RoboForex.com

Attention!
Forecasts presented in this section only reflect the author’s private opinion and should not be considered as guidance for trading. RoboForex LP bears no responsibility for trading results based on trading recommendations described in these analytical reviews.

Food is poised to get a lot more expensive, but it doesn’t have to

By Evan Fraser, University of Guelph and Lenore Newman, University of The Fraser Valley 

As we emerge from the pandemic, people everywhere are facing punishing housing costs and stagnant wages. At the grocery store, consumers are also confronting rising food prices, a sobering reminder that good food costs too much for too many.

Consumers aren’t used to expensive food. Over the past few years, most North Americans have typically spent around 10 per cent of household income on sustenance. In 1900, (when housing was much more affordable), food costs took up 42 per cent of incomes in the United States.

By 1950, new agricultural technologies had boosted production, helping slash costs to 30 per cent, but the gains were just beginning. The number fell to 18 per cent by 1960, and has mostly trended downward since.

A man in a mask surveys grocery store shelves while carrying a basket.
We’re not used to expensive food, because it’s been relatively cheap for so long.
(Unsplash)

Today, with inflation on the rise, we need to consider what we can do to ensure the cost of a healthy diet stays within reach. There are two broad approaches. The first is to reduce poverty. The second is to reduce the cost of food.

Both approaches are necessary but we’re focusing on the latter: how to keep food costs down. In particular, we believe that with the right strategies, in the relatively near future, even healthy food may be cheaper than ever. The key will be technology and policy. To the doubters, and we know there are many, consider the following example.

Food prices are poised to become higher post-pandemic. But using technology smartly and humanely can put the brakes to food price inflation. (Pixabay)

40-year-old wager

In 1980, an economist made a bet against an ecologist.

Julian Simon, a business professor at the University of Maryland, wagered Paul Ehrlich, an ecologist at Stanford University, that the cost of raw materials would fall over the decade. Ehrlich chose a set of raw materials and the two agreed to reconvene on Sept. 29, 1990. If prices rose (a sign of scarcity), Ehrlich won. But if they fell (a sign of abundance), Simon would come out on top.

The reason for the bet related to each man’s world view. Simon was a strong proponent that innovation and technology allow us to overcome limits to growth. Ehrlich observed the world’s environmental problems and argued the result of population growth would be famine, scarcity and ruin.

Forty years later, with the spectre of inflation twinned with climate change, a similar debate is emerging. We’d like to advance our notion, more aligned with the optimism expressed by Simon. We believe that thanks to technology, healthy food might actually become cheaper — radically cheaper — over the next 20 years as innovation provides many tools to overcome some of the problems caused by resource scarcity.

How can we do it?

Today, a wave of technological innovation is sweeping over food and farming systems. Better quality seeds are helping farmers all over the world remain productive during droughts.

Smart tractors, new “green chemistry” platforms and nanotechnology promise that in the near future farmers will reap record harvests while only applying a fraction of the fertilizers and pesticides they once did.

A giant greenhouse with a sea of green plants.
Greenhouses could result in fresh fruits and vegetables grown in close proximity to consumers.
(Erwan Hesry/Unsplash)

Cellular agriculture, which involves producing animal proteins in bioreactors or fermentation tanks, is poised to produce an enormous amount of protein.

And extraordinary improvements in artificial lighting and automation suggest that even fruits and vegetables may soon be produced at low costs in greenhouses and vertical farms close to consumers.

‘Good cheap’ versus ‘bad cheap’

But before we get too carried away, there is an important nuance. If food is cheap because the environment is exploited, or agricultural workers and farm animals are treated badly, then having cheap food won’t solve any problems.

Similarly, if cheap food is low-quality and unhealthy, that doesn’t help either. When it comes to cheap food, we have to distinguish between “good cheap” and “bad cheap.”

Ensuring we end up on the right side of this equation is where policy comes in. Government regulations must put a price on things like greenhouse gas emissions and water pollution so that farmers who are good stewards of the environment are rewarded.

Similarly, animal welfare must be protected and labour compensated appropriately (both in agriculture and across the economy). If we calibrate the right policies, then the technologies that are giving us new ways of producing food really have potential to lower the cost of healthy, sustainable and affordable nutrition. Good food won’t have to cost the earth.

Who won the bet?

The economist won the bet against the ecologist. All of the resources Ehrlich identified declined in price over the 1980s. Simon crowed about the role of ingenuity and innovation. Ehrlich grumbled he’d chosen badly and a recession in 1990 artificially dampened prices.

Both academics were partly right and partly wrong. Ehrlich underestimated the innovation Simon celebrated. But Simon did not appreciate the importance of strong policy to protect labour and environment.

As we look at the 21st century, a century that threatens both massive disruptions but also promises huge innovations, we need two things.

First, we must capitalize on the technology that can help us change the way we produce food. And we can never forget the importance of public policy to ensure there’s a fair price put on things such as biodiversity, climate change, human labour and animal welfare.

If we embrace both of these principles, there is a very real chance that we will be able to bring the price of producing healthy food down without destroying the ecosystems we all depend on for life.The Conversation

About the Author:

Evan Fraser, Director of the Arrell Food Institute and Professor in the Dept. of Geography, Environment and Geomatics, University of Guelph and Lenore Newman, Canada Research Chair, Food Security and the Environment, University of The Fraser Valley

This article is republished from The Conversation under a Creative Commons license. Read the original article.


The Analytical Overview of the Main Currency Pairs on 2021.06.22

by JustForex

The EUR/USD currency pair

Technical indicators of the currency pair:
  • Prev Open: 1.1855
  • Prev Close: 1.1917
  • % chg. over the last day: +0.52%

On Monday, the head of ECB Christine Lagarde announced that more than 100 million people in the European Union have been vaccinated against COVID-19. The ECB officials expect that the second half of the year will show an acceleration of economic growth in the eurozone. Analysts are confident that, considering the continued soft monetary policy in the EU, the euro will strengthen in the medium term.

Trading recommendations
  • Support levels: 1.1835, 1.1809
  • Resistance levels: 1.1920, 1.2002, 1.2050, 1.2109, 1.2144, 1.2174, 1.2212, 1.2243

Sellers’ pressure is weakening. The MACD indicator has already moved into the positive zone, the correction bounce has started. The price is now trading in a narrow flat. Under such market conditions, traders can look for both selling deals from the resistance levels and buying deals from the support levels. There is an untested support level below, so the price can make one more downward move before it starts to rise.

Alternative scenario: if the price breaks through the 1.2144 resistance level and fixes above, the general uptrend is likely to resume.

EUR/USD
News feed for 2021.06.22:
  • – US Existing Home Sales (m/m) at 17:00 (GMT+3);
  • – US Fed Chair Jerome Powell testifies at 21:00 (GMT+3).

The GBP/USD currency pair

Technical indicators of the currency pair:
  • Prev Open: 1.3803
  • Prev Close: 1.3933
  • % chg. over the last day: +0.94%

The British pound increased by 0.94% on Monday. The acceleration of economic growth in the Foggy Albion is still limited by a tight quarantine due to the new Indian COVID-19 strain. But in general, low interest rates allow companies to borrow and expand capacity and business. Therefore, as soon as the restrictions are lifted, the investors should expect an increase in consumer demand, which will favorably affect the national currency.

Trading recommendations
  • Support levels: 1.3835, 1.3801, 1.3767
  • Resistance levels: 1.3931, 1.4002, 1.4075, 1.4101, 1.4138, 1.4191

The GBP/USD trend is bearish on the H1 timeframe. At the moment, the price is trading below the moving average. The MACD indicator returned to the positive zone. Under such market conditions, traders are better to look for both sell trades from the resistance levels and buy trades from the support levels on the intraday timeframes.

Alternative scenario: if the price breaks through the 1.4101 resistance level and consolidates above, the bearish scenario is likely to be canceled.

GBP/USD
There is no news feed for today.

The USD/JPY currency pair

Technical indicators of the currency pair:
  • Prev Open: 110.17
  • Prev Close: 110.31
  • % chg. over the last day: +0.14%

The USD/JPY currency pair failed to break down the priority change level of 109.83 and returned to the uptrend. Buyers not only kept the level but also managed to break through two resistance levels at once. The fundamental background for the USD/JPY is mixed now, as on the one hand, the dollar index will continue to weaken, and on the other hand, the Japanese yen is also demonstrating weakness. But at the moment, the Japanese yen is much weaker.

Trading recommendations
  • Support levels: 110.23,109.83, 109.62, 109.31
  • Resistance levels: 110.47, 110.73 110.94, 111.48

The trend is still bullish, but the price has reached the priority change level. The price is trading above the moving average, and the MACD indicator has returned to the positive zone. Under such market conditions, traders are better to look for buy trades from the support levels. The price has reached the resistance level now, so traders need to wait for either a breakout or a bounce from the level downward.

Alternative scenario: if the price falls below 109.83, the general downtrend is likely to resume.

USD/JPY
There is no news feed for today.

The USD/CAD currency pair

Technical indicators of the currency pair:
  • Prev Open: 1.2458
  • Prev Close: 1.2363
  • % chg. over the last day: -0.77%

There is a corrective movement down within the uptrend on the USD/CAD currency pair. But many analysts believe that the fundamental picture for the Canadian dollar is more promising because the Canadian dollar is a commodity currency and is correlated with oil prices, which show strong growth. Therefore, as soon as the market reaction to the Fed’s statements is over, the experts expect the USD/CAD quotes to decline in the mid-term.

Trading recommendations
  • Support levels: 1.2321, 1.2251, 1.2190, 1,2148 1.2121, 1.2096
  • Resistance levels: 1.2404, 1.2478, 1.2519

Technically, the trend remains bullish. The price is now trading above the moving average, and the MACD indicator has moved into the negative zone. Buyers should wait for the price on the support levels and then look for long deals. There are no optimal entry points for sell positions right now.

Alternative scenario: if the price breaks through the 1.2190 support level and fixes below, the downtrend is likely to be resumed.

USD/CAD
There is no news feed for today.

by JustForex


This article reflects a personal opinion and should not be interpreted as an investment advice, and/or offer, and/or a persistent request for carrying out financial transactions, and/or a guarantee, and/or a forecast of future events.

Investors are waiting for Jerome Powell to talk about the Fed’s plans

by JustForex

The US stock market closed with a strong gain yesterday. The S&P 500 increased by 1.4%, the Dow Jones jumped by 1.76%, and the NASDAQ added 0.79%. All sectors of the economy closed in the green zone, with oil and gas, financials, and industrials leading the gains. Today investors are waiting for Federal Reserve Chairman Jerome Powell’s speech that may lead to increased volatility and a temporary decline in indices. Yesterday, the head of one of the most successful hedge funds, billionaire Ray Dalio, said “what kind of interest rate hike can we talk about if the country has a post-covid economy with huge unemployment, where a huge number of companies are not profitable and survive only thanks to simulation programs? A rate hike will lead to a huge number of bankruptcies and crowds of unemployed people”. In the medium term, investors will also keep a close eye on the US labor market, as its results strongly influence the Fed’s stance.

The European stock market follows the US market. On Monday, the head of ECB Christine Lagarde announced that more than 100 million people in the European Union had been vaccinated against COVID-19. The ECB officials expect that the second half of the year will accelerate economic growth in the eurozone. Analysts are confident that, considering the continued soft monetary policy in the EU, the euro and British pound will strengthen in the medium term.

Gold stopped falling. Yesterday, gold price increased by more than 1% to $1,788 a troy ounce. At the moment, prices for precious metals are at good mid-term buying points. Investors need to keep an eye on Treasury bond yields because of their inverse correlation to gold.

The oil uptrend continues. Summer is in full swing, and fuel demand is rising, so fundamentally, investors shouldn’t expect any significant declines in oil prices until the end of August.

Asian financial markets also rose on Monday. Japan’s Nikkei 225 added 2.1%, Australia’s ASX 200 jumped by 1.2%, and China’s CSI 300 increased by 0.6%. China’s financial regulators are urging companies to protect themselves against currency risks and have launched a training program on currency hedging for banks. But many companies are against this policy of the People’s Bank because, for small businesses, currency hedging instruments such as futures and options are too difficult to understand.

Main market quotes:

S&P 500 (F) 4,224.79 +58.34 (+1.40%)

Dow Jones 33,876.97 -586.89 (+1.76%)

DAX 15,603.24 +155.20 (+1.00%)

FTSE 100 7,062.29 +44.82 (+0.64%)

USD Index 91.87 -0.36 (-0.39%)

Important events:
  • – US Existing Home Sales (m/m) at 17:00 (GMT+3);
  • – US Fed Chair Jerome Powell testifies at 21:00 (GMT+3).

by JustForex


This article reflects a personal opinion and should not be interpreted as an investment advice, and/or offer, and/or a persistent request for carrying out financial transactions, and/or a guarantee, and/or a forecast of future events.

All eyes on Jerome Powell’s testimony

By Lukman Otunuga Research Analyst, ForexTime

Asian shares were mostly up this morning following a rebound on Wall Street overnight.

Equity bulls have been injected with a renewed sense of confidence thanks to dovish commentary from Fed officials including Chairman Jerome Powell. In written remarks prepared for his testimony before the House Select Subcommittee on the Coronavirus Crises and released yesterday, Powell reiterated his view that the recent jump in inflation would prove transitory. While such comments seem to have soothed concerns over the Fed’s hawkish tilt, the question is for how long? Given how markets remain highly sensitive to comments from Fed officials and inflation expectations, the next few days promise to be quite eventful for markets with numerous Fed speakers on the roster.

Dollar waits for Powell

The dollar was on standby on Tuesday as investors waited for testimony by Jerome Powell.

Despite the weakness witnessed yesterday, the dollar remains in a position of power backed by Fed hawks. With the next few days jampacked with speeches from US central bank officials and key economic data, the greenback could be in store for a wild ride. Focusing on today, market players will closely scrutinise Powell’s Q&A for insight into the health of the US economy and outlook for monetary policy after last week’s Fed fireworks.

Looking at the technical picture, the dollar Index (DXY) remains heavily bullish on the daily charts. After being boosted by the Fed last week, the dollar has smashed through multiple walls of resistance. A strong move back above 92.00 could encourage an advance towards 92.50 and 92.80. Alternatively, sustained weakness under 92.00 may trigger a technical pullback towards the 200-day Simple Moving Average around 91.50.

EURUSD attempts to defend 1.19.

The euro has entered Tuesday’s session on a shaky note against the dollar with prices wobbling around 1.19 as of writing.

After the brutal selloff witnessed last week, the euro experienced a rebound on Monday forming support around 1.1850. Investors may turn their attention towards the Eurozone consumer confidence flash survey for June which is forecast at -3 compared to the -5.1 in May. Speeches from the ECB’s Lane and Schnabel are also on the calendar and any positivity could lend euro bulls a helping hand, pushing EURUSD back towards 1.1950 and possibly higher.

Commodity spotlight – Gold

Gold experienced a small bounce yesterday thanks to a weaker dollar and dovish comments from Federal Reserve officials. However, the precious metal remains shaky and vulnerable to further losses and this continues to be reflected in price action. A stronger dollar and the prospects of higher interest rates are set to offer the zero-yielding metal nothing but more potential pain ahead.

Looking at the technical picture, prices are heavily bearish on the daily charts with sustained weakness below $1800 opening the door to $1750 and $1735. Alternatively, a breakout above $1800 could trigger a move towards $1842, a level found above both the 50-day and 200-day Simple Moving Averages.

Disclaimer: The content in this article comprises personal opinions and should not be construed as containing personal and/or other investment advice and/or an offer of and/or solicitation for any transactions in financial instruments and/or a guarantee and/or prediction of future performance. ForexTime (FXTM), its affiliates, agents, directors, officers or employees do not guarantee the accuracy, validity, timeliness or completeness, of any information or data made available and assume no liability as to any loss arising from any investment based on the same.


Forex-Time-LogoArticle by ForexTime

ForexTime Ltd (FXTM) is an award winning international online forex broker regulated by CySEC 185/12 www.forextime.com

Better risk mood sees dollar soften

By Lukman Otunuga Research Analyst, ForexTime

Markets are taking a big deep breath and regathering their thoughts after the tumultuous Fed shock of last week. With trader’s eyes nervously peering across to the central bank’s favoured measure of inflation released on Friday in the form of the US PCE, we also get a host of Fed speakers and the main man himself, Chair Jay Powell speaking tomorrow.

Fed officials Bullard, Kaplan and Williams speak later today after the former was out on the wires Friday saying his “dot” was for a hike in 2022. He is not a voter at the Fed but predicted faster inflation next year of 2.5% in core PCE versus the 2.1% forecast at the recent FOMC meeting.

There are still question marks over the size of the recent market moves with yields rising at the front end and selling off further out – a flattening yield curve – normally suggesting a lack of confidence in the outlook for the US economy, even as the Fed creeps towards tapering.

Bond yields bounce back

The USD is trading broadly lower to kick off this week in the first real dip in the rally since last week.

Risk sentiment is more positive today which is seeing a bid in high beta commodity dollar currencies while JPY and CHF are little changed. 10-year US bond yields dropped near to 1.35% in Asian trade before rebounding strongly back near to 1.50% at the time of writing.

EUR/USD has found steady support today around 1.1850 which is last week’s low from Friday. Price signals are modestly positive on shorter timeframes possibly suggesting a base, though this is natural after such a violent move lower. The RSI also points to oversold conditions so gains through 1.1925 should push the pair north, with resistance at 1.1950 around the February lows.

Gold regains a footing

After the six per cent selloff last week, its biggest in 15 months, gold is desperately trying to find a foothold and some near-term support. A Fib level of this year’s low to high move sits at $1768 while the RSI is in oversold territory below 30. Resistance above comes in at the 100-day SMA just below $1800.

Disclaimer: The content in this article comprises personal opinions and should not be construed as containing personal and/or other investment advice and/or an offer of and/or solicitation for any transactions in financial instruments and/or a guarantee and/or prediction of future performance. ForexTime (FXTM), its affiliates, agents, directors, officers or employees do not guarantee the accuracy, validity, timeliness or completeness, of any information or data made available and assume no liability as to any loss arising from any investment based on the same.


Forex-Time-LogoArticle by ForexTime

ForexTime Ltd (FXTM) is an award winning international online forex broker regulated by CySEC 185/12 www.forextime.com

COT Currency Futures Charts: US Dollar, Euro, Yen, Pound, Swiss Franc, Peso, Bitcoin

By CountingPips.com COT Home | Data Tables | Data Downloads | Newsletter

Here are the latest charts and statistics for the Commitment of Traders (COT) data published by the Commodities Futures Trading Commission (CFTC).

The latest COT data is updated through Tuesday June 15 2021 and shows a quick view of how large traders (for-profit speculators and commercial entities) were positioned in the futures markets. All currency positions are in direct relation to the US dollar where, for example, a bet for the euro is a bet that the euro will rise versus the dollar while a bet against the euro will be a bet that the euro will decline versus the dollar.


US Dollar Index Futures:
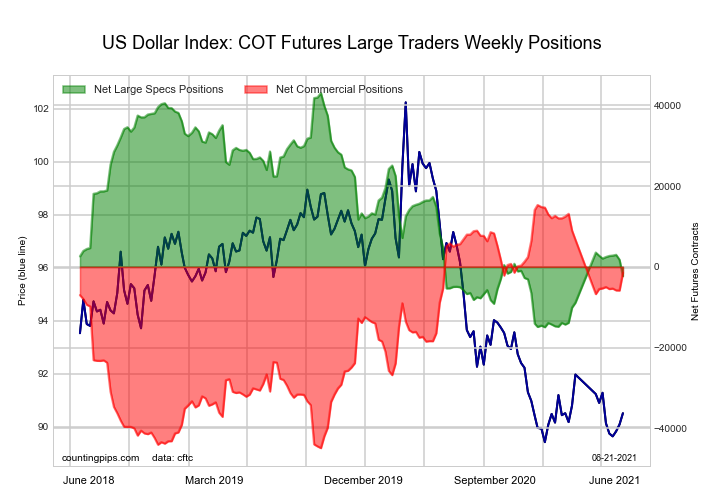
Federal Funds 30-Day Bonds Futures COT ChartThe US Dollar Index large speculator standing this week recorded a net position of -2,303 contracts in the data reported through Tuesday. This was a weekly fall of -4,054 contracts from the previous week which had a total of 1,751 net contracts.

This week’s current strength score (the trader positioning range over the past three years, measured from 0 to 100) shows the speculators are currently Bearish with a score of 21.8 percent. The commercials are Bullish with a score of 72.1 percent and the small traders (not shown in chart) are Bullish with a score of 68.5 percent.

US DOLLAR INDEX StatisticsSPECULATORSCOMMERCIALSSMALL TRADERS
– Percent of Open Interest Longs:68.48.317.6
– Percent of Open Interest Shorts:74.512.37.4
– Net Position:-2,303-1,4953,798
– Gross Longs:25,6183,1206,577
– Gross Shorts:27,9214,6152,779
– Long to Short Ratio:0.9 to 10.7 to 12.4 to 1
NET POSITION TREND:
– COT Index Score (3 Year Range Pct):21.872.168.5
– COT Index Reading (3 Year Range):BearishBullishBullish
NET POSITION MOVEMENT INDEX:
– 6-Week Change in Strength Index:-7.56.46.6


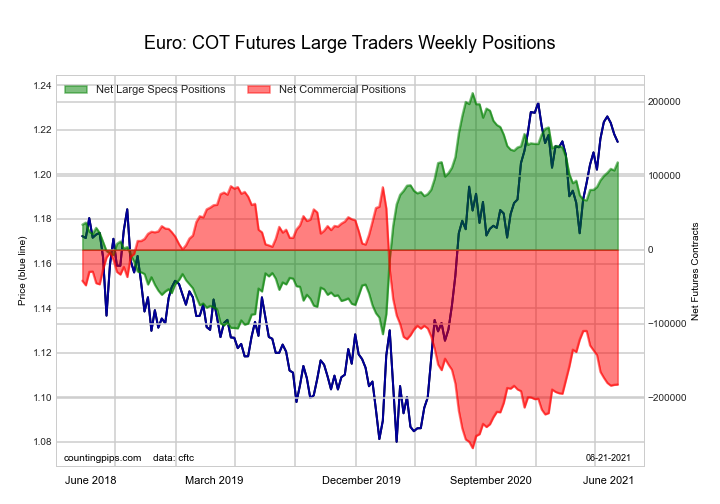
Euro Currency Futures:

2-Year Treasury Bonds Futures COT ChartThe Euro Currency large speculator standing this week recorded a net position of 118,186 contracts in the data reported through Tuesday. This was a weekly gain of 10,973 contracts from the previous week which had a total of 107,213 net contracts.

This week’s current strength score (the trader positioning range over the past three years, measured from 0 to 100) shows the speculators are currently Bullish with a score of 71.3 percent. The commercials are Bearish with a score of 24.3 percent and the small traders (not shown in chart) are Bullish-Extreme with a score of 83.0 percent.

EURO Currency StatisticsSPECULATORSCOMMERCIALSSMALL TRADERS
– Percent of Open Interest Longs:30.354.914.4
– Percent of Open Interest Shorts:13.381.15.2
– Net Position:118,186-182,09163,905
– Gross Longs:210,816381,40999,890
– Gross Shorts:92,630563,50035,985
– Long to Short Ratio:2.3 to 10.7 to 12.8 to 1
NET POSITION TREND:
– COT Index Score (3 Year Range Pct):71.324.383.0
– COT Index Reading (3 Year Range):BullishBearishBullish-Extreme
NET POSITION MOVEMENT INDEX:
– 6-Week Change in Strength Index:10.2-11.39.3


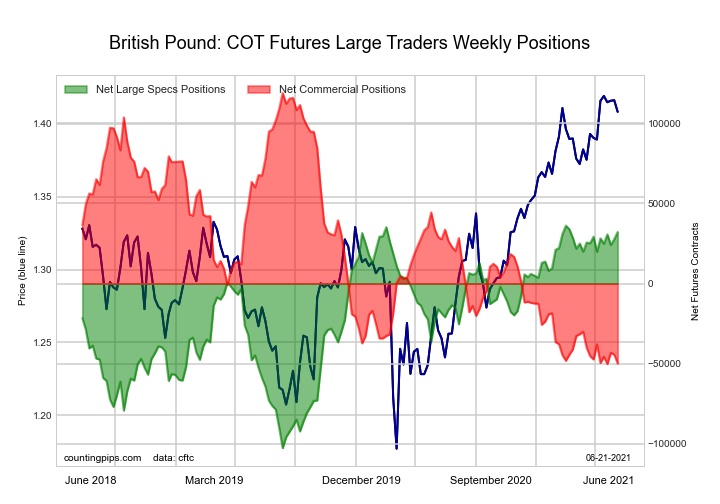
British Pound Sterling Futures:

5-Year Treasury Bonds Futures COT ChartThe British Pound Sterling large speculator standing this week recorded a net position of 32,170 contracts in the data reported through Tuesday. This was a weekly lift of 4,456 contracts from the previous week which had a total of 27,714 net contracts.

This week’s current strength score (the trader positioning range over the past three years, measured from 0 to 100) shows the speculators are currently Bullish-Extreme with a score of 97.2 percent. The commercials are Bearish-Extreme with a score of 0.2 percent and the small traders (not shown in chart) are Bullish-Extreme with a score of 92.4 percent.

BRITISH POUND StatisticsSPECULATORSCOMMERCIALSSMALL TRADERS
– Percent of Open Interest Longs:35.439.224.4
– Percent of Open Interest Shorts:14.871.113.0
– Net Position:32,170-49,88317,713
– Gross Longs:55,20361,12338,047
– Gross Shorts:23,033111,00620,334
– Long to Short Ratio:2.4 to 10.6 to 11.9 to 1
NET POSITION TREND:
– COT Index Score (3 Year Range Pct):97.20.292.4
– COT Index Reading (3 Year Range):Bullish-ExtremeBearish-ExtremeBullish-Extreme
NET POSITION MOVEMENT INDEX:
– 6-Week Change in Strength Index:8.9-7.0-0.9


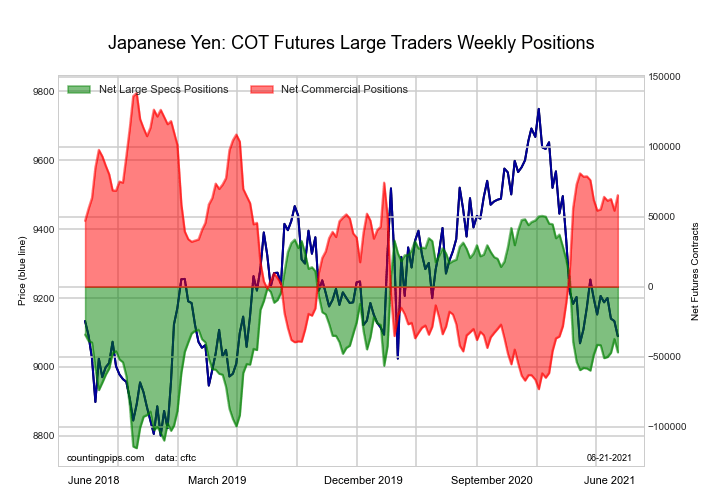
Japanese Yen Futures:

10-Year Treasury Notes Bonds Futures COT ChartThe Japanese Yen large speculator standing this week recorded a net position of -46,850 contracts in the data reported through Tuesday. This was a weekly reduction of -9,536 contracts from the previous week which had a total of -37,314 net contracts.

This week’s current strength score (the trader positioning range over the past three years, measured from 0 to 100) shows the speculators are currently Bearish with a score of 41.2 percent. The commercials are Bullish with a score of 65.5 percent and the small traders (not shown in chart) are Bearish with a score of 20.9 percent.

JAPANESE YEN StatisticsSPECULATORSCOMMERCIALSSMALL TRADERS
– Percent of Open Interest Longs:14.872.612.2
– Percent of Open Interest Shorts:44.930.624.0
– Net Position:-46,85065,317-18,467
– Gross Longs:22,974112,79818,879
– Gross Shorts:69,82447,48137,346
– Long to Short Ratio:0.3 to 12.4 to 10.5 to 1
NET POSITION TREND:
– COT Index Score (3 Year Range Pct):41.265.520.9
– COT Index Reading (3 Year Range):BearishBullishBearish
NET POSITION MOVEMENT INDEX:
– 6-Week Change in Strength Index:-3.25.2-10.8


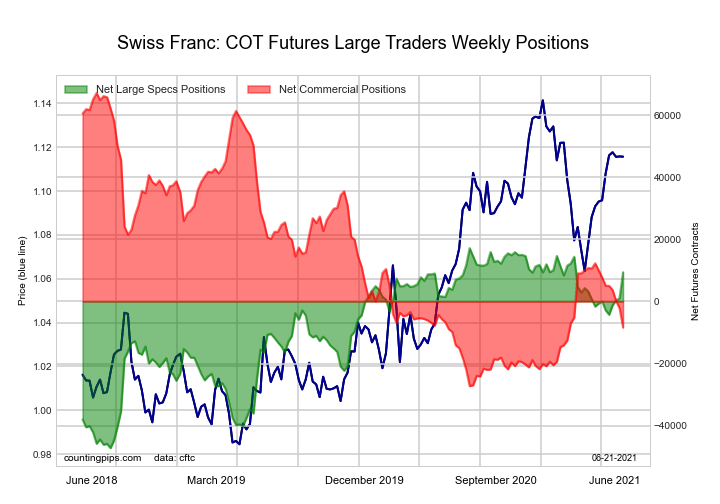
Swiss Franc Futures:

Ultra 10-Year Treasury Notes Bonds Futures COT ChartThe Swiss Franc large speculator standing this week recorded a net position of 9,387 contracts in the data reported through Tuesday. This was a weekly rise of 8,311 contracts from the previous week which had a total of 1,076 net contracts.

This week’s current strength score (the trader positioning range over the past three years, measured from 0 to 100) shows the speculators are currently Bullish-Extreme with a score of 87.9 percent. The commercials are Bearish with a score of 20.0 percent and the small traders (not shown in chart) are Bullish with a score of 61.9 percent.

SWISS FRANC StatisticsSPECULATORSCOMMERCIALSSMALL TRADERS
– Percent of Open Interest Longs:40.119.540.3
– Percent of Open Interest Shorts:14.842.243.0
– Net Position:9,387-8,396-991
– Gross Longs:14,8757,23114,949
– Gross Shorts:5,48815,62715,940
– Long to Short Ratio:2.7 to 10.5 to 10.9 to 1
NET POSITION TREND:
– COT Index Score (3 Year Range Pct):87.920.061.9
– COT Index Reading (3 Year Range):Bullish-ExtremeBearishBullish
NET POSITION MOVEMENT INDEX:
– 6-Week Change in Strength Index:14.5-17.119.1


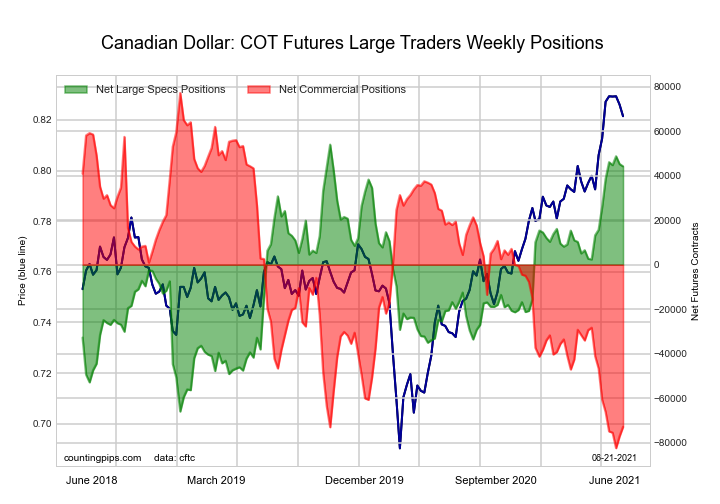
Canadian Dollar Futures:

US Year Treasury Notes Long Bonds Futures COT ChartThe Canadian Dollar large speculator standing this week recorded a net position of 44,254 contracts in the data reported through Tuesday. This was a weekly reduction of -1,027 contracts from the previous week which had a total of 45,281 net contracts.

This week’s current strength score (the trader positioning range over the past three years, measured from 0 to 100) shows the speculators are currently Bullish-Extreme with a score of 91.9 percent. The commercials are Bearish-Extreme with a score of 6.0 percent and the small traders (not shown in chart) are Bullish-Extreme with a score of 90.0 percent.

CANADIAN DOLLAR StatisticsSPECULATORSCOMMERCIALSSMALL TRADERS
– Percent of Open Interest Longs:28.951.119.0
– Percent of Open Interest Shorts:11.479.97.6
– Net Position:44,254-72,92128,667
– Gross Longs:73,071129,18548,013
– Gross Shorts:28,817202,10619,346
– Long to Short Ratio:2.5 to 10.6 to 12.5 to 1
NET POSITION TREND:
– COT Index Score (3 Year Range Pct):91.96.090.0
– COT Index Reading (3 Year Range):Bullish-ExtremeBearish-ExtremeBullish-Extreme
NET POSITION MOVEMENT INDEX:
– 6-Week Change in Strength Index:15.3-7.6-9.2


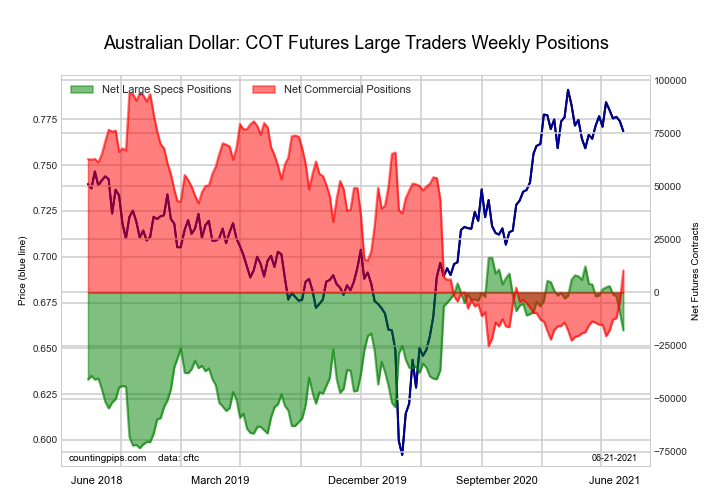
Australian Dollar Futures:

Ultra US Year Treasury Notes Long Bonds Futures COT ChartThe Australian Dollar large speculator standing this week recorded a net position of -17,880 contracts in the data reported through Tuesday. This was a weekly decrease of -8,443 contracts from the previous week which had a total of -9,437 net contracts.

This week’s current strength score (the trader positioning range over the past three years, measured from 0 to 100) shows the speculators are currently Bullish with a score of 61.8 percent. The commercials are Bearish with a score of 29.9 percent and the small traders (not shown in chart) are Bullish with a score of 73.7 percent.

AUSTRALIAN DOLLAR StatisticsSPECULATORSCOMMERCIALSSMALL TRADERS
– Percent of Open Interest Longs:32.345.821.2
– Percent of Open Interest Shorts:46.737.515.1
– Net Position:-17,88010,3567,524
– Gross Longs:40,13956,90226,262
– Gross Shorts:58,01946,54618,738
– Long to Short Ratio:0.7 to 11.2 to 11.4 to 1
NET POSITION TREND:
– COT Index Score (3 Year Range Pct):61.829.973.7
– COT Index Reading (3 Year Range):BullishBearishBullish
NET POSITION MOVEMENT INDEX:
– 6-Week Change in Strength Index:-21.621.4-13.6


New Zealand Dollar Futures:

Eurodollar Bonds Futures COT ChartThe New Zealand Dollar large speculator standing this week recorded a net position of 3,265 contracts in the data reported through Tuesday. This was a weekly fall of -2,241 contracts from the previous week which had a total of 5,506 net contracts.

This week’s current strength score (the trader positioning range over the past three years, measured from 0 to 100) shows the speculators are currently Bullish with a score of 76.7 percent. The commercials are Bearish with a score of 21.7 percent and the small traders (not shown in chart) are Bullish with a score of 79.9 percent.

NEW ZEALAND DOLLAR StatisticsSPECULATORSCOMMERCIALSSMALL TRADERS
– Percent of Open Interest Longs:48.734.215.3
– Percent of Open Interest Shorts:40.149.19.0
– Net Position:3,265-5,6572,392
– Gross Longs:18,46612,9625,787
– Gross Shorts:15,20118,6193,395
– Long to Short Ratio:1.2 to 10.7 to 11.7 to 1
NET POSITION TREND:
– COT Index Score (3 Year Range Pct):76.721.779.9
– COT Index Reading (3 Year Range):BullishBearishBullish
NET POSITION MOVEMENT INDEX:
– 6-Week Change in Strength Index:-8.97.64.6


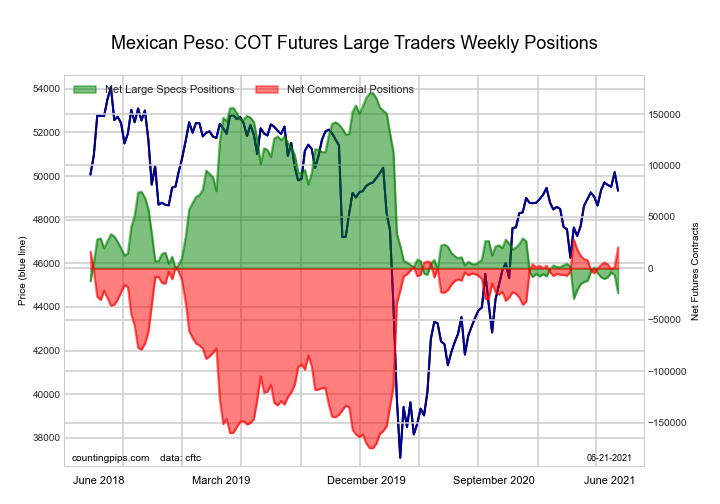
Mexican Peso Futures:

Ultra 10-Year Treasury Notes Bonds Futures COT ChartThe Mexican Peso large speculator standing this week recorded a net position of -23,930 contracts in the data reported through Tuesday. This was a weekly decrease of -17,369 contracts from the previous week which had a total of -6,561 net contracts.

This week’s current strength score (the trader positioning range over the past three years, measured from 0 to 100) shows the speculators are currently Bearish-Extreme with a score of 2.8 percent. The commercials are Bullish-Extreme with a score of 96.2 percent and the small traders (not shown in chart) are Bullish with a score of 58.0 percent.

MEXICAN PESO StatisticsSPECULATORSCOMMERCIALSSMALL TRADERS
– Percent of Open Interest Longs:47.447.24.6
– Percent of Open Interest Shorts:64.033.12.2
– Net Position:-23,93020,3973,533
– Gross Longs:68,67568,3076,669
– Gross Shorts:92,60547,9103,136
– Long to Short Ratio:0.7 to 11.4 to 12.1 to 1
NET POSITION TREND:
– COT Index Score (3 Year Range Pct):2.896.258.0
– COT Index Reading (3 Year Range):Bearish-ExtremeBullish-ExtremeBullish
NET POSITION MOVEMENT INDEX:
– 6-Week Change in Strength Index:-9.810.1-3.7


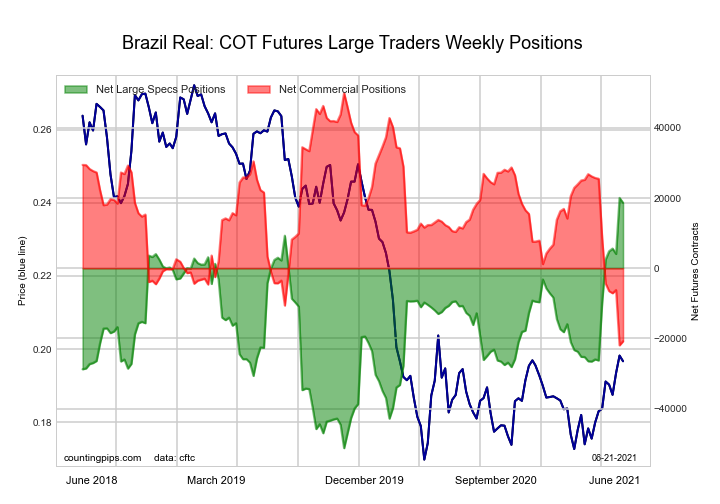
Brazilian Real Futures:

US Year Treasury Notes Long Bonds Futures COT ChartThe Brazilian Real large speculator standing this week recorded a net position of 18,659 contracts in the data reported through Tuesday. This was a weekly reduction of -1,389 contracts from the previous week which had a total of 20,048 net contracts.

This week’s current strength score (the trader positioning range over the past three years, measured from 0 to 100) shows the speculators are currently Bullish-Extreme with a score of 98.1 percent. The commercials are Bearish-Extreme with a score of 1.6 percent and the small traders (not shown in chart) are Bullish-Extreme with a score of 98.9 percent.

BRAZIL REAL StatisticsSPECULATORSCOMMERCIALSSMALL TRADERS
– Percent of Open Interest Longs:68.620.410.5
– Percent of Open Interest Shorts:22.272.25.1
– Net Position:18,659-20,8092,150
– Gross Longs:27,5648,2094,209
– Gross Shorts:8,90529,0182,059
– Long to Short Ratio:3.1 to 10.3 to 12.0 to 1
NET POSITION TREND:
– COT Index Score (3 Year Range Pct):98.11.698.9
– COT Index Reading (3 Year Range):Bullish-ExtremeBearish-ExtremeBullish-Extreme
NET POSITION MOVEMENT INDEX:
– 6-Week Change in Strength Index:40.0-41.012.0


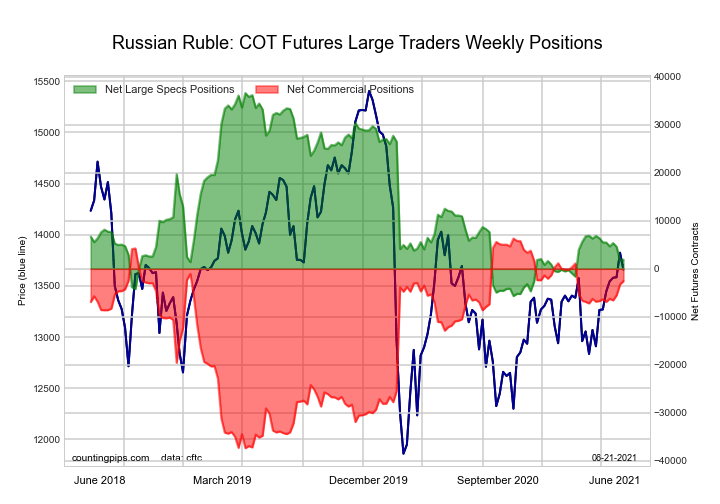
Russian Ruble Futures:

Ultra US Year Treasury Notes Long Bonds Futures COT ChartThe Russian Ruble large speculator standing this week recorded a net position of 1,904 contracts in the data reported through Tuesday. This was a weekly advance of 164 contracts from the previous week which had a total of 1,740 net contracts.

This week’s current strength score (the trader positioning range over the past three years, measured from 0 to 100) shows the speculators are currently Bearish-Extreme with a score of 17.9 percent. The commercials are Bullish with a score of 79.7 percent and the small traders (not shown in chart) are Bullish with a score of 63.9 percent.

RUSSIAN RUBLE StatisticsSPECULATORSCOMMERCIALSSMALL TRADERS
– Percent of Open Interest Longs:26.767.45.5
– Percent of Open Interest Shorts:22.872.64.2
– Net Position:1,904-2,540636
– Gross Longs:13,08933,0592,691
– Gross Shorts:11,18535,5992,055
– Long to Short Ratio:1.2 to 10.9 to 11.3 to 1
NET POSITION TREND:
– COT Index Score (3 Year Range Pct):17.979.763.9
– COT Index Reading (3 Year Range):Bearish-ExtremeBullishBullish
NET POSITION MOVEMENT INDEX:
– 6-Week Change in Strength Index:-8.58.7-6.3


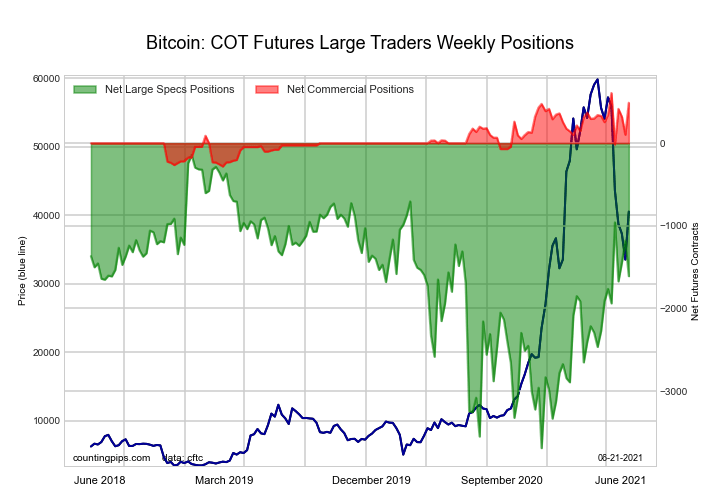
Bitcoin Futures:

Eurodollar Bonds Futures COT ChartThe Bitcoin large speculator standing this week recorded a net position of -1,609 contracts in the data reported through Tuesday. This was a weekly reduction of -428 contracts from the previous week which had a total of -1,181 net contracts.

This week’s current strength score (the trader positioning range over the past three years, measured from 0 to 100) shows the speculators are currently Bullish with a score of 58.7 percent. The commercials are Bullish-Extreme with a score of 86.7 percent and the small traders (not shown in chart) are Bearish with a score of 26.5 percent.

BITCOIN StatisticsSPECULATORSCOMMERCIALSSMALL TRADERS
– Percent of Open Interest Longs:57.48.424.6
– Percent of Open Interest Shorts:78.81.99.7
– Net Position:-1,6094891,120
– Gross Longs:4,3206311,851
– Gross Shorts:5,929142731
– Long to Short Ratio:0.7 to 14.4 to 12.5 to 1
NET POSITION TREND:
– COT Index Score (3 Year Range Pct):58.786.726.5
– COT Index Reading (3 Year Range):BullishBullish-ExtremeBearish
NET POSITION MOVEMENT INDEX:
– 6-Week Change in Strength Index:4.416.1-9.8


Article By CountingPips.comReceive our weekly COT Reports by Email

*COT Report: The COT data, released weekly to the public each Friday, is updated through the most recent Tuesday (data is 3 days old) and shows a quick view of how large speculators or non-commercials (for-profit traders) were positioned in the futures markets.

The CFTC categorizes trader positions according to commercial hedgers (traders who use futures contracts for hedging as part of the business), non-commercials (large traders who speculate to realize trading profits) and nonreportable traders (usually small traders/speculators).

Find CFTC criteria here: (http://www.cftc.gov/MarketReports/CommitmentsofTraders/ExplanatoryNotes/index.htm).