The central bank is monitoring inflation but is in no hurry to raise interest rates. That’s the bottom line from yesterday’s speech by the chairman of the US Federal Reserve to Congress. It should be noted that the Federal Reserve is guided by the Phillips curve, which illustrates the relationship between the rate of inflation and the rate of unemployment. If the unemployment rate rises, the inflation rate will also be high. Once the labor market data turn out to be positive and the unemployment rate falls, inflation will also follow a downward trend. For this reason, fundamentally, inflation has temporary nature. At the end of the day, the US stock indices closed in a positive zone, while the NASDAQ tech index hit a new all-time high.
European stocks were mostly rising on Tuesday. Investors closely followed Powell’s testimony and after the speech, when it became clear that the soft monetary policy is still in force, the euro and the British pound currency futures quotes started to rise. A lot of macroeconomic statistics in Europe are expected to be released today.
The pause in the negotiations on the Iran nuclear deal has a favorable effect on the growth of oil prices, which are at a 2-year high. With continued fuel shortages, the uptrend in oil will continue.
Powell’s comments halted the rise in the dollar index and lowered the US Treasury yields, which is positive for gold and silver. Gold is now trading in a range, but analysts are confident that as soon as the dollar index starts to fall back to previous levels, the uptrend in the precious metals will resume.
Asian stock indexes also rose on Tuesday. Japan’s Nikkei 225 increased by 1.3%, China’s CSI 300 added 0.35% and Australia’s ASX200 jumped by 2%. The situation in the Asia-Pacific countries remains the same.
Main market quotes:
S&P 500 (F) 4,246.44 +21.65 (+0.51%)
Dow Jones 33,945.58 +68.61 (+0.20%)
DAX 15,636.33 +33.09 (+0.21%)
FTSE 100 7,090.01 +27.72 (+0.39%)
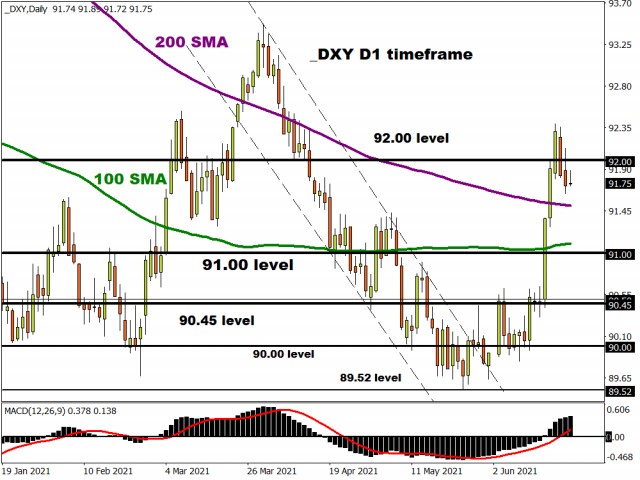
USD Index 91.74 -0.16 (-0.18%)
Important events:
– France Manufacturing PMI (m/m) at 10:15 (GMT+3);
– Germany Manufacturing PMI (m/m) at 10:30 (GMT+3);
– Eurozone Manufacturing PMI (m/m) at 11:00 (GMT+3);
– UK Manufacturing PMI (m/m) at 11:30 (GMT+3);
– UK Service PMI (m/m) at 11:30 (GMT+3);
– Canada Retail Sales (m/m) at 15:30 (GMT+3);
– US Manufacturing PMI (m/m) at 16:45 (GMT+3);
– US Service PMI (m/m) at 16:45 (GMT+3);
– US New Home Sales (m/m) at 17:00 (GMT+3);
– US Crude Oil Inventories (w/w) at 17:30 (GMT+3).
This article reflects a personal opinion and should not be interpreted as an investment advice, and/or offer, and/or a persistent request for carrying out financial transactions, and/or a guarantee, and/or a forecast of future events.
After the hawkish surprise last week from the Fed when the FOMC spooked markets by signalling much earlier rate hikes than expected, Chair Powell struck a decidedly more cautious tone yesterday. He repeated the temporary nature of current price pressures and although the recent debate on QE is on the cards, the Fed is nowhere near hiking interest rates. Other Fed officials this week have spread a similar message with New York Fed President Williams warning overnight that the recovery requires more time.
The latest smoke signals from the Fed all point to September as the key meeting when the Fed is most probably able to declare that substantial progress towards their goals has been achieved. This means we should perhaps pencil in the Jackson Hole symposium in August as the precursor to this where Powell really preps the markets.
Stocks certainly gained from the more dovish rhetoric with the tech-laden Nasdaq hitting fresh record highs. The broader S&P500 gained too with only the defensive utilities sector in the red. European bourses have opened up this morning marginally higher after Asian markets posted solid gains.
Dollar holding up for now
After hitting a two-month high at the end of last week, the greenback has suffered two days of losses and given back roughly a third of its sharp gains posted since the FOMC meeting last Wednesday.
Commodity-linked currencies benefitted the most from the more cautious Powell and this may be the case through the summer as those central banks on the hiking cycle see their currencies appreciate the most.
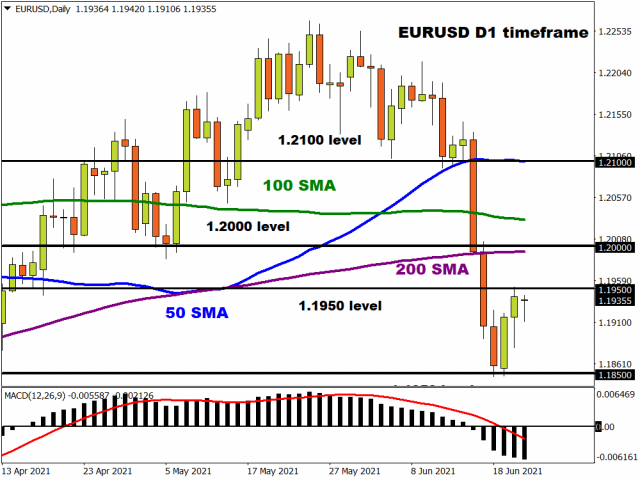
EUR/USD too was helped by markets breathing a sigh of relief, although the 1.20 barrier above is formidable with a confluence of resistance including the 50% retracement level and the 100-day and 200-day simple moving averages below and above.
EUR/GBP moving lower ahead of BoE
We get UK and European PMI data released today and traders will be on the look out for signs that we have seen a peak in manufacturing and a pick up in services due to covid restrictions easing. EUR/GBP also has to contend with the Bank of England meeting tomorrow, which my colleague Han Tan discussed yesterday and the potential for a hawkish surprise.
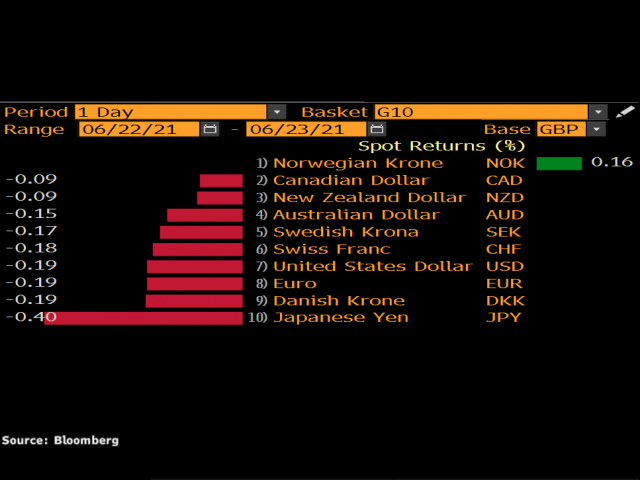
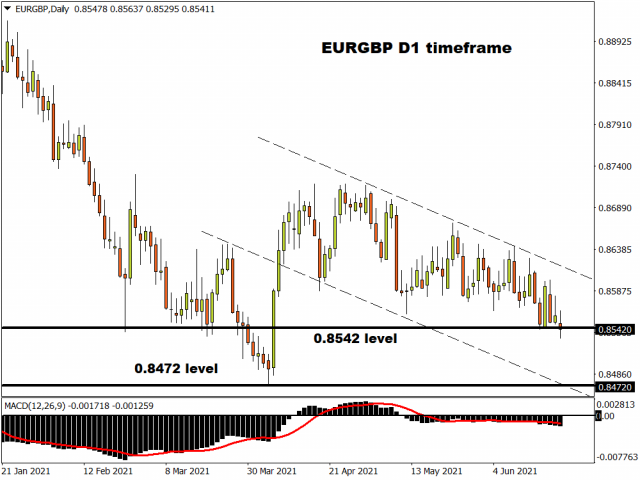
Perhaps the market read the report as sterling has appreciated against almost every single G10 currency today and EUR/GBP is breaking down through recent support at 0.8542. The downward trendline from the December high has acted as resistance above and bears have their eyes on the cycle low at 0.8472.
Disclaimer: The content in this article comprises personal opinions and should not be construed as containing personal and/or other investment advice and/or an offer of and/or solicitation for any transactions in financial instruments and/or a guarantee and/or prediction of future performance. ForexTime (FXTM), its affiliates, agents, directors, officers or employees do not guarantee the accuracy, validity, timeliness or completeness, of any information or data made available and assume no liability as to any loss arising from any investment based on the same.
GBPUSD was walloped last week, posting a decline of 2.11% for the period – its largest weekly drop since September 2020. The US dollar surged in the wake of the Fed’s hawkish surprise, sending cable below its 100-day simple moving average (SMA) and also blew past its lower Bollinger band.
However, the currency pair is now testing its 100-SMA as a key resistance, having recovered from near-oversold conditions when its 14-day relative strength index almost hit the 30 mark which typically denotes oversold conditions.
BOE to deliver another hawkish surprise?
Traders are certainly going to watch closely Thursday’s Bank of England policy meeting for any signs that policymakers could be readying to start withdrawing their support measures sooner than expected.
To be clear, the BOE is widely expected to leave the policy settings untouched this week. However, after the Fed’s surprise pivot last week, any hawkish signals out of this side of the pond could give GBPUSD a solid leg up above its 100-SMA.
There’s been enough market chatter about the BOE potentially towing the same line as the Fed.
Note that UK inflation rose by 2.1% year-on-year in May, surpassing the central bank’s target of 2%. Even with the low base effect (comparison from May 2020), there were enough price pressures linked to the UK economic reopening as seen in prices of clothing, footwear, restaurants and even hotels.
Also, outgoing BOE Chief Economist Andy Haldane had been sounding the alarm about soaring inflation. At the BOE’s meeting in May, he had already voted for a paring back of the central bank’s asset purchases. Likely to vote the same way this week, it remains to be seen whether Haldane can get more to adopt similar hawkish tones at his final meeting as an MPC member.
BOE still mindful of key risks
Still, policymakers are cognisant of several major factors which may kept the MPC sticking to its dovish stance. The delta variant of the coronavirus has already forced a delay to the UK economy’s full reopening. The UK’s furlough scheme is due to end at end-September, and the unemployment rate could tick higher once more.
Should any of these downside risks become more prominent, that could afford more runway for the MPC before they have to think about reining in its asset purchases which target 895 billion pounds at present. Of course, the opposite could happen too. If these downside risks subside meaningfully, that could ramp up the BOE’s willingness to ease up on its asset purchases.
On top of that, the BOE’s next set of economic forecasts are not due until August. Perhaps policymakers might wait until then to signal its change in tactics, with the updated forecast figures then giving more credence to the eventual pivot.
Markets turning bullish on Sterling
According to data from the Commodity Futures Trading Commission (CFTC) for the week through 15 June, leveraged funds raised their net long positions on the Pound for a second consecutive week to reach its highest level since April 2021. Asset managers however did the opposite, reducing their net GBP long positions for a second straight week to its lowest since mid-May.
Of course, this latest batch of CFTC data was for the period leading up to the Fed shocker; it’ll make for fascinating reading to see how markets’ positions have altered post-Fed.
In fact, Sterling has strengthened against most of its G10 peers, barring the US dollar and the Japanese Yen, in the days since last week’s FOMC meeting.
GBP Index to set new 2021 high?
Perhaps the optimism surrounding the UK economy that has fed into the Pound’s performance is best encapsulated in the GBP index, which is an equally-weighted index comprising the following pairs:
The GBP Index’s 20-day SMA has offered support while guiding it upwards, setting the index mere pips away from posting a new year-to-date high.
Such an achievement could be unlocked with another hawkish surprise twist out of the BOE this week, if it happens.
Disclaimer: The content in this article comprises personal opinions and should not be construed as containing personal and/or other investment advice and/or an offer of and/or solicitation for any transactions in financial instruments and/or a guarantee and/or prediction of future performance. ForexTime (FXTM), its affiliates, agents, directors, officers or employees do not guarantee the accuracy, validity, timeliness or completeness, of any information or data made available and assume no liability as to any loss arising from any investment based on the same.
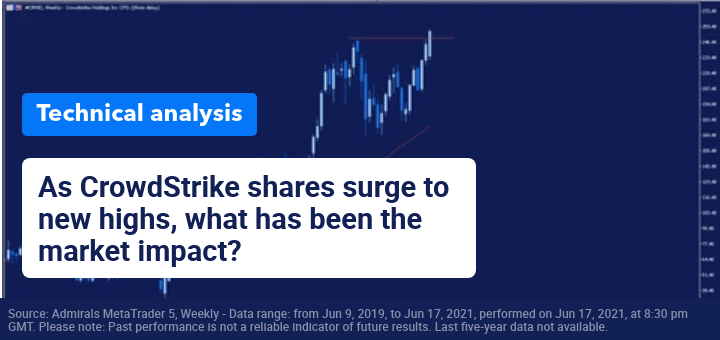
Shares in CrowdStrike surged more than 8% yesterday to a new record high after the cybersecurity stock received an investment bank upgrade. Analysts at Stifel are forecasting the stock to rally more than 25%.
Cybersecurity stocks have been in demand this year as ransomware attacks and hacks increase and become more sophisticated. However, the sector has become very competitive with new cybersecurity companies going public than ever before.
Since CrowdStrike went public in June 2019, the stock price has more than quadrupled, giving the company a very high price to earnings ratio. However, investors are currently happy to pay a high premium due to CrowdStrike’s strong positioning as a cloud-based cybersecurity company.
Source: Admirals MetaTrader 5, Weekly – Data range: from Jun 9, 2019, to Jun 17, 2021, performed on Jun 17, 2021, at 8:30 pm GMT. Please note: Past performance is not a reliable indicator of future results. Last five-year data not available.
From a technical analysis perspective, it’s clear to see the overall uptrend in CrowdStrike’s share price since 2020. While the price has dipped in 2021, buyers have regained control.
If the price can stay above the previous all-time high around 248.00 then the share price could breakaway. However, a move back below here may see the stock continue to range trade.
Did you know that you can use the Trading Central Technical Ideas Lookup indicator to find actionable trading ideas on thousands of different markets?
Start your free download by clicking on the banner below:
INFORMATION ABOUT ANALYTICAL MATERIALS:
The given data provides additional information regarding all analysis, estimates, prognosis, forecasts, market reviews, weekly outlooks or other similar assessments or information (hereinafter “Analysis”) published on the websites of Admiral Markets investment firms operating under the Admiral Markets trademark (hereinafter “Admiral Markets”) Before making any investment decisions please pay close attention to the following:
This is a marketing communication. The content is published for informative purposes only and is in no way to be construed as investment advice or recommendation. It has not been prepared in accordance with legal requirements designed to promote the independence of investment research, and that it is not subject to any prohibition on dealing ahead of the dissemination of investment research.
Any investment decision is made by each client alone whereas Admiral Markets shall not be responsible for any loss or damage arising from any such decision, whether or not based on the content.
With view to protecting the interests of our clients and the objectivity of the Analysis, Admiral Markets has established relevant internal procedures for prevention and management of conflicts of interest.
The Analysis is prepared by an independent analyst, Jitan Solanki (analyst), (hereinafter “Author”) based on their personal estimations.
Whilst every reasonable effort is taken to ensure that all sources of the content are reliable and that all information is presented, as much as possible, in an understandable, timely, precise and complete manner, Admiral Markets does not guarantee the accuracy or completeness of any information contained within the Analysis.
Any kind of past or modeled performance of financial instruments indicated within the content should not be construed as an express or implied promise, guarantee or implication by Admiral Markets for any future performance. The value of the financial instrument may both increase and decrease and the preservation of the asset value is not guaranteed.
Leveraged products (including contracts for difference) are speculative in nature and may result in losses or profit. Before you start trading, please ensure that you fully understand the risks involved.
Who doesn’t love a good story, especially one about amazing discoveries in Earth’s farthest reaches? Oceanographer, Navy veteran and explorer Robert D. Ballard has written a memoir, “Into the Deep,” that recounts many of his dramatic discoveries, including locating the wreck of the luxury ocean liner Titanic in 1985.
Ballard, now 79, is known for designing and using many types of vehicles for underwater exploration. His most important scientific contributions include mapping regions of the mid-Atlantic Ridge, an underwater mountain chain that runs north-south through the Atlantic ocean, and locating hydrothermal vents in the eastern Pacific. These underwater hot springs form at cracks in the ocean’s crust, where superheated water jets upward from Earth’s interior. Finding them changed scientists’ thinking about the evolution of life on Earth and the chemistry of the ocean.
Robert Ballard explains the importance of exploring the world’s oceans.
In the early 1970s, when Ballard was doing his graduate work in marine geology and geophysics, scientists were still refining the basics of plate tectonics theory. One key idea was that new ocean crust was created at spreading centers in the seafloor, where oceanic plates moved away from each other and magma from Earth’s interior welled up between them.
A 1972 study of a spreading center in the eastern Pacific, near the Galapagos Islands, observed that the water temperature was slightly warmer near parts of the spreading center – a surprising find at depths of 8,000 to 9,000 feet (2,440 to 2,750 meters) – but cooled rapidly as it flowed away from the site. This suggested that hydrothermal vents might be present.
In 1974 Ballard took part in Project FAMOUS, which used the U.S. manned submersible Alvin and a French submersible to explore the Mid-Atlantic Ridge. Researchers descended 8,000 feet into deep rift valleys on the ocean floor, and ascended to the adjacent rift mountains at depths of about 3,300 feet (1,000 meters). Fresh basalt suggested recent volcanic activity and the creation of new ocean crust, but their survey did not locate hydrothermal vents.
The submersible Alvin exploring hydrothermal vents in 1978. NOAA
Meanwhile, other researchers were exploring the Galapagos spreading center. In 1976 Kathleen Crane, a graduate student at the Scripps Institution of Oceanography, investigated marine heat flow in that area for her doctoral research. To do this she navigated an elaborate deep-ocean exploration machine, Deep Tow, which was pulled behind a research vessel near the ocean floor and transmitted data back to the ship.
Crane’s measurements identified hot springs. Photographs showed clam shells nearby. She dropped acoustic transponders marking the site that she called “Clambake” for future research.
A year later, scientists returned to the area with Alvin and a different deep-towed vehicle, ANGUS, that could travel closer to the ocean floor, providing better photographs and thermal measurements. Ballard and Crane both were on this expedition, along with other researchers from Oregon State University, MIT, Stanford, the Woods Hole Oceanographic Institution and Scripps.
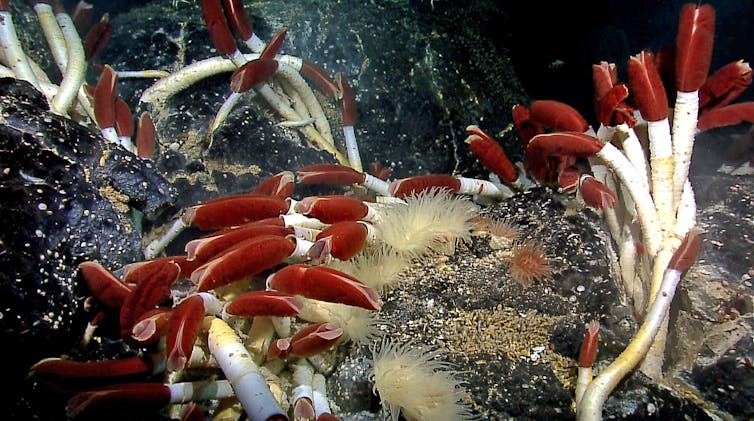
The new photographs allowed the scientists to pinpoint the most important dive sites. They made 24 dives in Alvin. At the hot spots, they were stunned to find dense clusters of shellfish, anemones, crabs, tube worms and other organisms around vents in the ocean floor where hot water rose up from below. Analysis showed that these organisms were performing chemosynthesis – creating energy from chemicals in the seawater, in complete darkness.
Hydrothermal vents are located in cold, dark waters but they support rich and diverse ecosystems that live off chemicals flowing from the seafloor.
Disappointingly, all that Ballard says in “Into the Deep” about Crane’s role in this discovery is that researchers from Scripps had scanned the area in 1976 using Deep Tow and “detected a few subtle temperature anomalies.” In the scramble for credit in important scientific discoveries it can be difficult, if not impossible, to clearly identify who made the discovery. In a collective effort, who should be recognized?
Crane, whom I have known since 1978, was listed as a co-author on the 1979 paper in the journal Science that described the hydrothermal vents, and went on to a distinguished career studying oceans and the Arctic. But her role in this discovery has received relatively little credit in popular accounts. As I see it, Ballard’s memoir would have been a perfect opportunity to acknowledge her contribution to one of the most important ocean science discoveries of the 20th century.
Finding lost ships
Ballard received much wider acclaim when he led the expedition that found the RMS Titanic in 1985. This trip was financed by the U.S. Navy – not out of interest in the Titanic, but as an add-on to secret studies of the wreckage of two nuclear-powered attack submarines, the USS Scorpion and the USS Thresher, which sank in the 1960s.
On Sept. 1, 1985, Ballard and his team captured the first photos of Titanic’s remains, 2.4 miles (3.8 kilometers) below the Atlantic Ocean’s surface and almost 400 miles (600 kilometers) south-southeast of Newfoundland. They found the wreck using Argo, a new deep-towed sonar and video camera system, to search back and forth over a 100-square-mile area of the seafloor. Ocean scientists call this process “mowing the lawn,” hoping and praying that something new will be revealed.
After Titanic, Ballard tracked down other well-known lost ships. In 1989 he and his crew located the Bismarck, a German World War II battleship sunk by Allied forces in the North Atlantic in 1941. And in 2002 they found PT-109, the patrol boat skippered by 26-year-old John F. Kennedy, which sank in the South Pacific in 1943 when it was rammed by a Japanese destroyer.
By 2008 Ballard had led five expeditions to the Black Sea, where oxygen-depleted deep water preserved ancient vessels and their cargo. Scientists are still probing and analyzing these archaeological time capsules.
All hands on deck
In recent decades, Ballard has put much effort into increasing diversity in oceanographic exploration and research, especially gender diversity. The Jason Learning project, which Ballard founded in 1989 to spark K-12 students’ interest in science, technology, engineering and math through the excitement of ocean research, features many women. His Ocean Exploration Trust research vessel, the E.V. Nautilus – named after Captain Nemo’s submarine in Jules Verne’s classic “Twenty Thousand Leagues Under the Sea” – has many women as permanent crew members, something that would have been unheard of 50 years ago.
For me, working with a skilled crew of scientists and technicians aboard ship is one of the most exciting aspects of marine research. No one can be an expert on all of the components of our planet’s amazing ocean system, from tiny plankton floating in surface currents to tectonic plates spreading and colliding underwater. Being at sea with other marine scientists has provided tremendous joy in my career.
There is a lot to discover about the ocean, and we need all kinds of talent to do it. Ballard’s talent lies in his construction and use of remotely operated vehicles to explore the seafloor, and his storytelling and fundraising capabilities, which provide inspiration for future generations of ocean explorers.
Throughout the gas tax’s controversial history, leaders have frequently called upon this revenue source when serious infrastructure investment is needed.
As he signed the Revenue Act of 1932 into law, President Herbert Hoover lauded “the willingness of our people to accept this added burden in these times in order impregnably to establish the credit of the federal government.”
In 1956 the levy rose once more, to 3 cents, when Americans were paying about 30 cents for a gallon of gas. At the same time, the government established the Highway Trust Fund to use the gas tax revenue to pay for building and maintaining the new interstates.
Gas tax revenue stopped keeping up with the expenses it was supposed to cover in the early 1970s following a severe bout of inflation and OPEC’s oil embargo. U.S. gas prices soared from about 36 cents per gallon in 1972 to $1.31 in 1981.
Responding to what members of both major political parties saw as a transportation infrastructure crisis, Congress more than doubled the tax to 9 cents per gallon as part of the Surface Transportation Assistance Act of 1982. The same law split the Highway Trust Fund and its revenue stream into two parts: The first 8 cents would finance roadwork while the other penny would finance mass transit projects.
This hike may have struck drivers as a sharp increase, but public spending on transportation infrastructure would continue to fall as a percentage of all outlays.
In 1984, Congress increased spending on highways by funneling proceeds from fines and other penalties that businesses pay for safety violations, such as failing to label hazardous materials or forcing drivers to work too many hours in a row.
Congress boosted the tax twice more in the 1990s but primarily to reduce the then-ballooning federal deficit. Only half of a 5-cent increase in 1990 went to highways and transit, while a 4.3-cent lift three years later went entirely to lowering the deficit.
Along the way, other federal fuel taxes arose, including a 24.4-cent-per-gallon diesel tax and taxes on methanol and compressed natural gas. And state fuel taxes, which in most cases began before the federal gas tax, range from as low as 8.95 cents per gallon in Alaska to as high as 57.6 cents per gallon in Pennsylvania.
Making do
Since 1993, when the federal gas tax was first parked at 18.4 cents, inflation and rising construction costs have eroded its effectiveness as a transportation-related revenue source. In addition, U.S. vehicles have grown more fuel-efficient overall – which means Americans use less fuel for every mile they drive.
As a result, highway and transit spending has significantly outpaced the revenue collected from the gas tax and other sources. Since 2008, the government has transferred over $80 billion to the fund that it had to take from other sources.
But it’s still not enough. The American Society of Civil Engineers, which gives U.S. infrastructure a C-minus, is calling on the government and private sector to increase spending on roads and bridges by at least $2.5 trillion within a decade.
While it’s true the gas tax may be regressive because lower-income people pay the same rate as those who earn higher incomes, there are still advantages to this tax.
For one thing, it follows the “user pays” principle of providing government services. Under this principle, the people using the roads are held responsible for paying for their upkeep. As the number of motorists using electric vehicles increases, however, this may become less true over time.
Finally, the government could always subsidize the tax for the poor, perhaps through annual lump-sum payments, making it less regressive.
Clearly, U.S. infrastructure is in dire need of upgrading and investment. At the end of the day, Americans will pay for it one way or another – whether in taxes or through costs of unsafe and inadequate infrastructure, including in lost lives. How the government pays for investment may matter less than that it finally does it.
About the Author:
This is an updated version of an article first published on Feb. 27, 2018.
Due to unanswered questions into the origins of the coronavirus pandemic, both the U.S. government and scientists have called for a deeper examination into the validity of claims that a virus could have escaped from a lab in Wuhan, China.
Much of the discussion surrounds “gain-of-function” research. So The Conversation asked David Gillum and Rebecca Moritz, who work closely with virologists on a day-to-day basis to ensure the safety and security of the research, and Sam Weiss Evans and Megan Palmer, who are science and technology policy experts, to explain what this term means and why this kind of research is important.
What does gain of function mean?
Any organism can acquire a new ability or property, or “gain” a “function.” This can happen through natural selection or a researcher’s experiments. In research, many different types of experiments generate functions, and some pose certain safety and security concerns.
Scientists use a variety of techniques to modify organisms depending on the properties of the organism itself and the end goal. Some of these methods involve directly making changes at the level of genetic code. Others may involve placing organisms in environments that select for functions linked to genetic changes.
In the current debate around SARS-CoV-2, the virus that causes COVID-19, gain of function has a much narrower meaning related to a virus becoming easier to move between humans, or becoming more lethal in humans. It is important to remember, though, that the term “gain of function” by itself covers much more than this type of research.
Why would researchers do gain-of-function work on potentially dangerous pathogens?
Gain-of-function experiments may help researchers test scientific theories, develop new technologies and find treatments for infectious diseases. For example, in 2003, when the original SARS-CoV outbreak occurred, researchers developed a method to study the virus in the laboratory. One of the experiments was to grow the virus in mice so they could study it. This work led to a model for researching the virus and testing potential vaccines and treatments.
Gain-of-function research that focuses on potential pandemic pathogens has been supported on the premise that it will help researchers better understand the evolving pathogenic landscape, be better prepared for a pandemic response and develop treatments and countermeasures.
But critics argue that this research to anticipate potential pandemic pathogens does not lead to substantial benefit and is not worth the potential risks. And they say getting out ahead of such threats can be achieved through other means – biological research and otherwise. For instance, the current pandemic has provided numerous lessons on the social and behavioral dynamics of disease prevention measures, which could lead to robust new research programs on the cultural aspects of pandemic preparedness. Understanding when the risks of gain-of-function research outweigh the potential benefits and alternatives, therefore, continues to be subject to debate.
What are some examples of gain-of-function research, and how risky is it?
Some potential outcomes of gain-of-function research may include the creation of organisms that are more transmissible or more virulent than the original organism or those that evade current detection methods and available treatments. Other examples include engineering organisms that can evade current detection methods and available treatments, or grow in another part of an organism, such as the ability to cross the blood-brain barrier.
There is no such thing as zero risk in conducting experiments. So the question is whether certain gain-of-function research can be performed at an acceptable level of safety and security by utilizing risk-mitigation measures. These strategies for reducing risk include the use of biocontainment facilities, exposure control plans, strict operating procedures and training, incident response planning and much more. These efforts involve dedication and meticulous attention to detail at multiple levels of an institution.
Lab incidents will still occur. A robust biosafety and biosecurity system, along with appropriate institutional response, helps to ensure that these incidents are inconsequential. The challenge is to make sure that any research conducted – gain-of-function or otherwise – doesn’t pose unreasonable risks to researchers, the public and the environment.
Determining whether specific experiments with potential pathogens should be conducted remains a difficult and contentious topic.
How do experts determine which gain-of-function research poses too much risk?
There are multiple ways to answer this question. The first is if the research is intended to develop a biological weapon. The United Nations Biological Weapons Convention, which went into effect in 1975, forbids state parties from developing, producing, stockpiling, or otherwise acquiring or sharing biological agents, toxins and equipment that have no justification for peaceful or defensive purposes. There should be no research, then, whether gain-of-function or otherwise, that seeks to purposefully develop a biological weapon.
Another way to answer the question is by focusing on the content of the research, rather than its intent. Through experience, researchers and governments have developed lists of both experiments and organisms that need additional oversight because of their potential safety and security risks. One example of this arose when flu researchers placed a self-imposed pause on gain-of-function research involving the transmissibility of highly pathogenic avian influenza H5N1 viruses in 2012. The U.S. government subsequently imposed a moratorium on the work in 2014. Both moratoriums were lifted by the end of 2017 following a lengthy debate and study of the risks and the development of additional oversight and reporting requirements.
The main point is that our understanding is constantly evolving. Just before the COVID-19 pandemic began, the U.S. government had started to review and update its policies. It is an open question what lessons will be learned from this pandemic, and how that will reshape our understanding of the value of gain-of-function research. One thing that is likely to happen, though, is that we will rethink the assumptions we have been making about the relationships between biological research, security and society. This may be an opportunity to review and enhance systems of biosecurity and biosafety governance.
Iran’s Interior Ministry on June 19 announced that the winner is Ebrahim Raisi, chief of Iran’s judiciary and close ally of the supreme leader. He was all but assured of victory after the candidates who could have posed a serious challenge to him – including three reformists – were disqualified and prevented from participating in the election.
But who is Ebrahim Raisi, and how will his presidency alter Iran’s domestic and foreign policies? As an economist and close observer of Iran, I believe we can start to answer these questions by exploring his past.
Loyal insider
Raisi is a loyal regime insider with a long career in Iran’s judicial branch, which goes back more than four decades.
He was only 19 when the Islamic revolution deposed the shah in 1979. As a young Islamic activist, he caught the attention of several top revolutionary clerics, including Ali Khamenei, who became Iran’s supreme leader a decade later.
Named the general-prosecutor of Kataj – a small city near Tehran – at age 20, Raisi quickly rose to more prominent positions. In 1989, when Khamenei replaced Ruhollah Khomeini as supreme leader, Raisi was promoted to chief prosecutor-general of Tehran.
This promotion reflected the high level of trust that Khamenei had in him. While serving in these positions, Raisi also attended seminary and religious studies under Khamenei and other influential religious leaders.
Executing dissidents and fighting corruption
During the first decade of his career, Raisi convicted a large number of dissidents and political opponents of the Islamic regime and sentenced many of them to death.
Regime critics and his political opponents have condemned his direct role in these executions, particularly the large number of political prisoners who were executed in 1988.
From 1994 to 2004, Raisi served as head of Iran’s general inspector office, which is responsible for preventing abuse of power and corruption in government institutions. It was in this position that he developed a reputation as a crusader against government corruption. Even as he was appointed as the first deputy chief justice in 2004 and finally promoted to chief justice in March 2019, he continued his fight against corruption by prosecuting many government officials.
His critics have argued, however, that his fight against corruption has been highly politicized and selective. They claimed that he targeted individuals who were affiliated with his political rivals such as President Hassan Rouhani.
Raisi first ran for president in 2017 but was defeated by Iran’s current President Hassan Rouhani, who after two terms is ineligible to run again.
In this year’s election, Raisi was the favorite candidate of the conservative right wing of the Islamic ruling elite and also enjoys the support of Ayatollah Khamenei, who has absolute power over all branches of government. Khamenei also directly appoints half of the 12-member Council of Guardians, which oversees all political elections and has the power to disqualify candidates without any public explanation. Khamenei publicly endorsed and defended the disqualifications.
Likely return to the nuclear deal
One of the institutional weaknesses of Iran’s political system since the 1979 Islamic revolution is the potential for tension and disagreement between the elected presidents and the supreme leader.
That is, unlike in the U.S. system of government, the Iranian president’s powers are extremely limited. For example, a reformist president may want to engage more with the West or stay out of a foreign conflict, but the supreme leader could overrule or simply ignore him.
As a protege and close ally of the supreme leader, Raisi is expected to support Khamenei’s policies on both domestic and foreign policy – which means more coordination between the various branches of government. With the Parliament also dominated by Khamenei supporters, it also means that the conservatives will control all three branches of the government once again after eight years.
This harmony means Raisi will be a lot more effective as president because whatever policies he pursues will most likely be supported by the supreme leader.
And perhaps ironically, his victory could pave the way for a more compromising attitude on the side of Iran in the negotiations that are currently underway in Vienna for restoration of the 2015 nuclear agreement, which was derailed by former U.S. President Donald Trump in 2018.
The reason for this unconventional prediction is that both reformist and conservative factions in Iran are fully aware that a new nuclear agreement, which could end the severe economic sanctions imposed on the country, is highly popular. The team that signs the agreement will receive credit for ending the economic hardship the country is currently enduring. For example, inflation is over 50%, exports have plunged due to the sanctions and over 60% of the population is now in poverty, up from 48% just two years ago.
With Raisi president, the conservatives and the supreme leader have greater incentives to reach an agreement with the United States for lifting the sanctions as they can no longer blame a reformist president for the economic hardships.
The success of this strategy, however, is far from guaranteed.
First, if Khamenei, Raisi and their hard-line supporters insist on maintaining Iran’s confrontational foreign policy, it seems unlikely to me that the economic sanctions against Iran will ease. Not all of them are tied directly to the nuclear deal, including sanctions against Raisi himself.
Second, the growing alienation and frustration of large segments of Iran’s population – especially after reformists were banned from running for president – may still lead to mass unrest and political instability.
Supreme Leader Raisi?
Raisi’s victory may have an even more significant impact on Iran’s politics in the long run because it might pave the way for him to become Iran’s next supreme leader.
Ayatollah Khamenei is in his 80s, and a succession to a new supreme leader is considered probable in the next four years. According to many regime insiders, Raisi became the most likely person to replace Khamenei by winning the presidential election.
If Raisi eventually becomes Iran’s supreme leader, he would have far more powers to shape all types of policies. Based on his background and values, he is likely to resist political and social reforms and try to gain legitimacy for the Islamic regime by focusing on economic development in a similar fashion to the authoritarian regimes in Asia, such as China, by focusing on economic growth while curtailing political and social freedoms.
Raisi – and eventually as the supreme leader – is unlikely to abandon Iran’s anti-Western foreign policy, but he has the potential to lower the tensions to a more manageable level in order to improve Iran’s economy.
In my view, he seems to have recognized that the continuation of current economic hardships poses the largest threat to the Islamic regime in the long run.
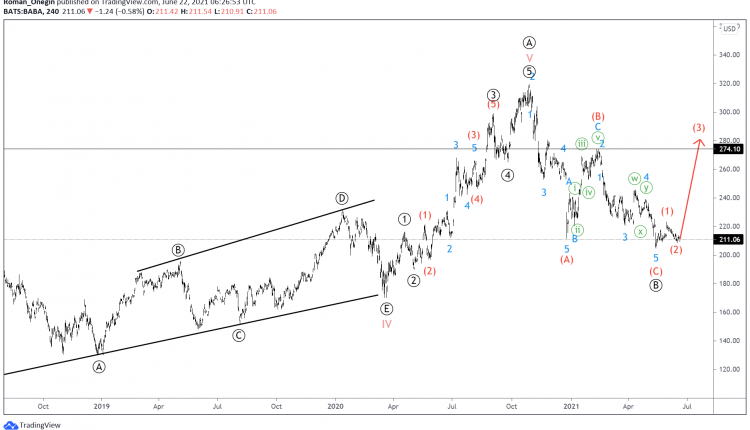
The ALIBABA formation shows that the impulse wave Ⓐ has ended. This followed the development of a bearish correction Ⓑ in a primary zigzag.
It is likely that the correction Ⓑ has completed, taking the form of an intermediate zigzag (A)-(B)-(C).
In this case, we currently see the formation of the initial part of a new bullish wave, which will consist of intermediate waves (1)-(2)-(3)-(4)-(5). At the moment, the small sub-waves (1) and (2) look complete.
In the short term, the intermediate wave (3) may update the previous high, that is, go above the level of 274.10.
However, there is a possibility that the primary correction wave Ⓑ is still under development. We see only two parts of it formed – the impulse (A) and the zigzag (B). To complete the wave Ⓑ, a wave (C) is required.
The intermediate impulse wave (C) consists of minor sub-waves 1-2-3-4-5. Most likely, in the near future, minute wave five will complete the minor impulse wave 5 near the 168.13 area.
At that level, intermediate impulses (A) and (C) will be equal.
– Bitcoin has followed our Excess Phase Peak breakdown pattern almost perfectly. Each phase of any Excess Phase Peak is important to understand as it relates to other asset classes. For example, as an asset, like Bitcoin, begins a Excess Phase breakdown in trend, other assets will likely follow along. The psychological impact of a major decline can often result in traders also expecting breakdown events in various other asset classes.
Before we begin to go into deeper detail regarding this Excess Phase Peak setup in Bitcoin, I suggest taking a minute or two to review our earlier research posts related to this pattern: How To Spot The End Of An Excess Phase – Part I November 25, 2020; How To Spot The End Of An Excess Phase – Part II November 27, 2020; and, Bitcoin Completes Phase #3 Of Excess Phase Top Pattern – What Next May 20, 2021. As this breakdown continues to unfold, we want to warn you that other asset classes (as mentioned above) may follow this trend as trader/investor psychology often impacts future expectations/trends across the globe.
If traders suddenly develop an expectation that the recent price rally in the global markets is at risk of failing, or that the downtrend in Bitcoin may have broader implications across other assets, we may see a bigger rotation in the global markets throughout the rest or 2021 (and beyond).
Phase #4 of the Excess Phase Peak Setup Is Pending
Now, as we begin to enter Phase #4 of the Excess Phase peak pattern, the final breakdown of intermediate support, our research suggests Bitcoin may fall to levels below $10k. A confirmed start of Phase #4 would be indicated with a downward breach of the $30,240 level.
Traders need to be prepared for the next phase of this move. This may last many months as Bitcoin attempts to identify a key support level that will act as a new momentum base for any potential future upside price trending. The current breakdown in trend is expected to breach the $30,240 level fairly soon. At that point, a stronger downside price trend will likely wipe out another 60% to 75% of the current price valuation – resulting in a bottom forming below $10k. This potential bottom level may not be the ultimate low for Bitcoin. Traders are advised to wait for a strong bottom/base to setup before attempting to jump into any new upward price trending expectations. As mentioned above, the process of setting up this ultimate bottom/base may take many months to complete.
Let’s go over the Excess Phase Peak Pattern Setup, illustrated in the chart below.
Phase #1: The rally to the ultimate peak level
Phase #2: The breakdown of that peak level, setting up the initial support level and prompting a sideways price Flag/Pennant price channel
Phase #3: The breakdown of the #2 sideways price channel leading to a steep decline to intermediate support – which acts as a temporary sideways bottom.
Phase #4: The breakdown of the intermediate support level which ultimately leads to the strongest price decline targeting the ultimate bottom in price.
Phase #5: Identifying the ultimate bottom/momentum base in price. This trending phase can last many months (possibly more than 12 months at time), or could be in the form of a deep “V” bottom.
After the completed five phases, a new momentum bottom will setup which will likely prompt early stage accumulation again – eventually prompting another rally attempt.
Could Bitcoin Target A Bottom Below $7500?
My team and I believe the lower support level in September 2020, near $9850, is a likely target for the ultimate bottom. Although, we want to warn you this level may act as a temporary support level if the unwinding of this Phase #5 downward trend persists beyond our expectations.
This Weekly Bitcoin chart highlights the current three completed phases and the pending #4 and #5 phases of the Excess Phase Peak pattern. We find it interesting that we highlighted this pattern setup more than 7 months ago and warned that an Excess Phase Rally was taking place back in November 2020. Even though Bitcoin rallied far beyond our expectations for a peak (near $32k), we strongly believe the ultimate bottom setup from this extended Excess Phase collapse will prompt another incredible opportunity once the final phase of this pattern is complete.
To help answer your question, “where is the ultimate bottom in price?”, the simple answer is “we don’t know exactly where Bitcoin will find an ultimate bottom price level.”. We believe the $9850 level is a likely target for a bottom. But we also believe the unwinding of this broad market excess phase peak may prompt a bigger downtrend that may last many months as global assets break away from the recent rally phase. This means we may see a broader unwinding of the global markets throughout the end of 2021 and into 2022.
Many major commodities have recently broken their rally phase trends and have started to move dramatically lower in recent weeks. The US major indexes, particularly the Dow Jones and the Transportation Index, have begun to break upward sloping price channels. Gold and Silver have reacted, recently, to the FOMC statements by breaking strongly to the downside. All of these setups are indicative of a change in trader/investor psychology – a breakdown of expectations.
I advise traders and investors to be cautious with regards to trying to pick a bottom as we watch the markets attempt to identify new support levels. Bitcoin will likely break below the $30,240 level (the Phase #3 intermediate support level) in a big way sometime in the near future. Once that happens, we may see the broader markets attempt a downside price correction as well – as psychology often leads to some type of “herd mentality”.
Want to know how our BAN strategy is identifying and ranking various sectors and ETFs for the best possible opportunities for future profits? Please take a minute to learn about my BAN Trader Pro newsletter service and how it can help you identify and trade better sector setups. My team and I have built this strategy to help us identify the strongest and best trade setups in any market sector. Every day, we deliver these setups to our subscribers along with the BAN Trader Pro system trades. You owe it to yourself to see how simple it is to trade 30% to 40% of the time to generate incredible results.


 Article by



 Source: Admirals MetaTrader 5, Weekly – Data range: from Jun 9, 2019, to Jun 17, 2021, performed on Jun 17, 2021, at 8:30 pm GMT. Please note: Past performance is not a reliable indicator of future results. Last five-year data not available.

 Tube worms, anemones and mussels clustered near a hydrothermal vent on the Galapagos Rift.