Ichimoku Cloud Analysis 14.10.2021 (EURUSD, AUDUSD, USDCHF)

Article By RoboForex.com

EURUSD, “Euro vs US Dollar”

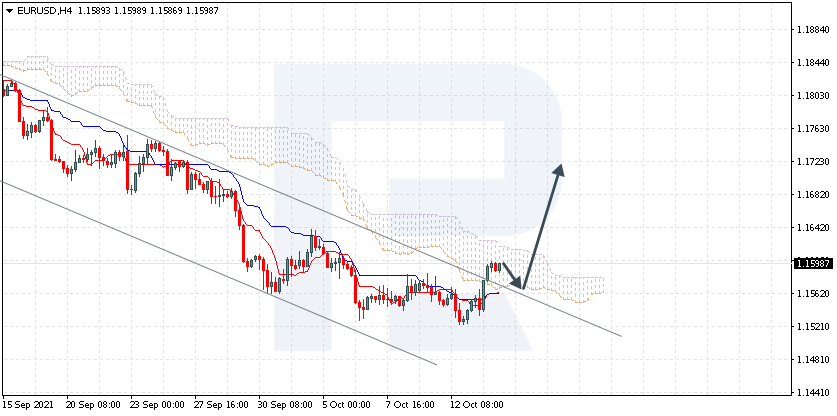
EURUSD is trading at 1.1598; the instrument is moving inside Ichimoku Cloud, thus indicating a sideways tendency. The markets could indicate that the price may test the cloud’s downside border at 1.1560 and then resume moving upwards to reach 1.1725. Another signal in favour of a further uptrend will be a rebound from the descending channel’s upside border. However, the bullish scenario may no longer be valid if the price breaks the cloud’s downside border and fixes below 1.1520. In this case, the pair may continue falling towards 1.1430. To confirm further growth, the asset must break the cloud’s upside border and fix above 1.1645.

EURUSD
Risk Warning: the result of previous trading operations do not guarantee the same results in the future

AUDUSD, “Australian Dollar vs US Dollar”

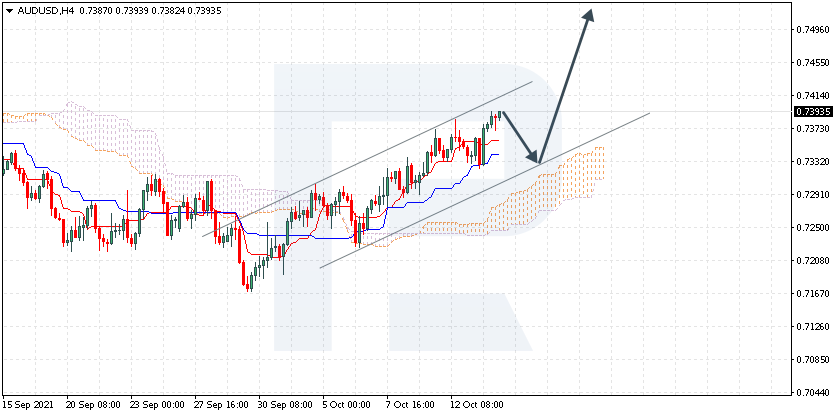
AUDUSD is trading at 0.7393; the instrument is moving above Ichimoku Cloud, thus indicating an ascending tendency. The markets could indicate that the price may test Tenkan-Sen and Kijun-Sen at 0.7335 and then resume moving upwards to reach 0.7525. Another signal in favour of a further uptrend will be a rebound from the rising channel’s downside border. However, the bullish scenario may no longer be valid if the price breaks the cloud’s downside border and fixes below 0.7210. In this case, the pair may continue falling towards 0.7120.

AUDUSD
Risk Warning: the result of previous trading operations do not guarantee the same results in the future

USDCHF, “US Dollar vs Swiss Franc”

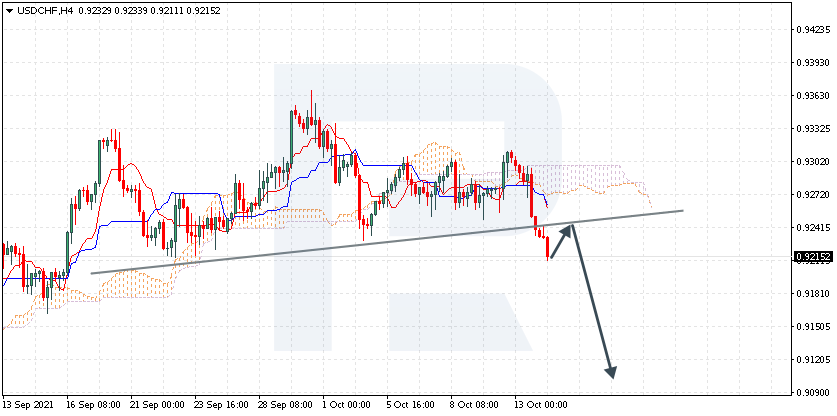
USDCHF is trading at 0.9215; the instrument is moving below Ichimoku Cloud, thus indicating a descending tendency. The markets could indicate that the price may test Tenkan-Sen and Kijun-Sen at 0.9240 and then resume moving downwards to reach 0.9105. Another signal in favour of a further downtrend will be a rebound from the “neckline” of a Head & Shoulders reversal pattern. However, the bearish scenario may no longer be valid if the price breaks the cloud’s upside border and fixes above 0.9315. In this case, the pair may continue growing towards 0.9405.

USDCHF

Article By RoboForex.com

Attention!
Forecasts presented in this section only reflect the author’s private opinion and should not be considered as guidance for trading. RoboForex LP bears no responsibility for trading results based on trading recommendations described in these analytical reviews.

AAPL Ending Diagonal Above $180

By Orbex

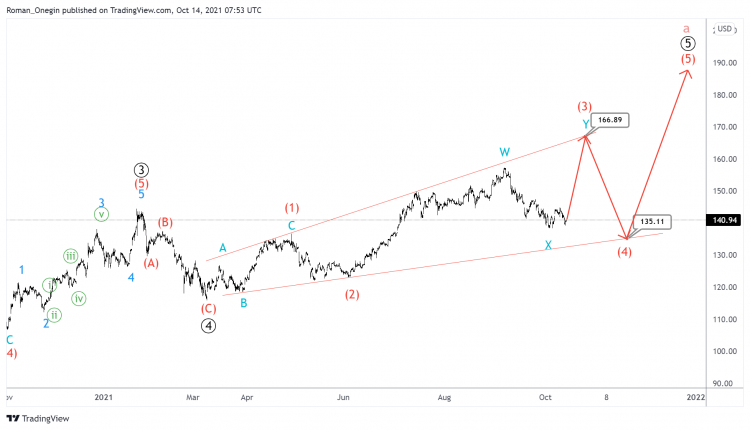
The current AAPL structure hints at the construction of a primary fifth wave. This takes the form of an ending diagonal (1)-(2)-(3)-(4)-(5) of the intermediate degree.

Most likely we are in the intermediate wave (3), taking the form of a double combination W-X-Y. Perhaps the minor intervening wave X has recently ended. Thus, to complete the specified pattern, we need an actionary wave Y.

The minor wave Y can send the market to the level of 166.89, which is on the resistance line, and then the price could fall within the correction (4) to the support level of 135.11.

An approximate scheme of a possible future move is on the chart.

AAPL

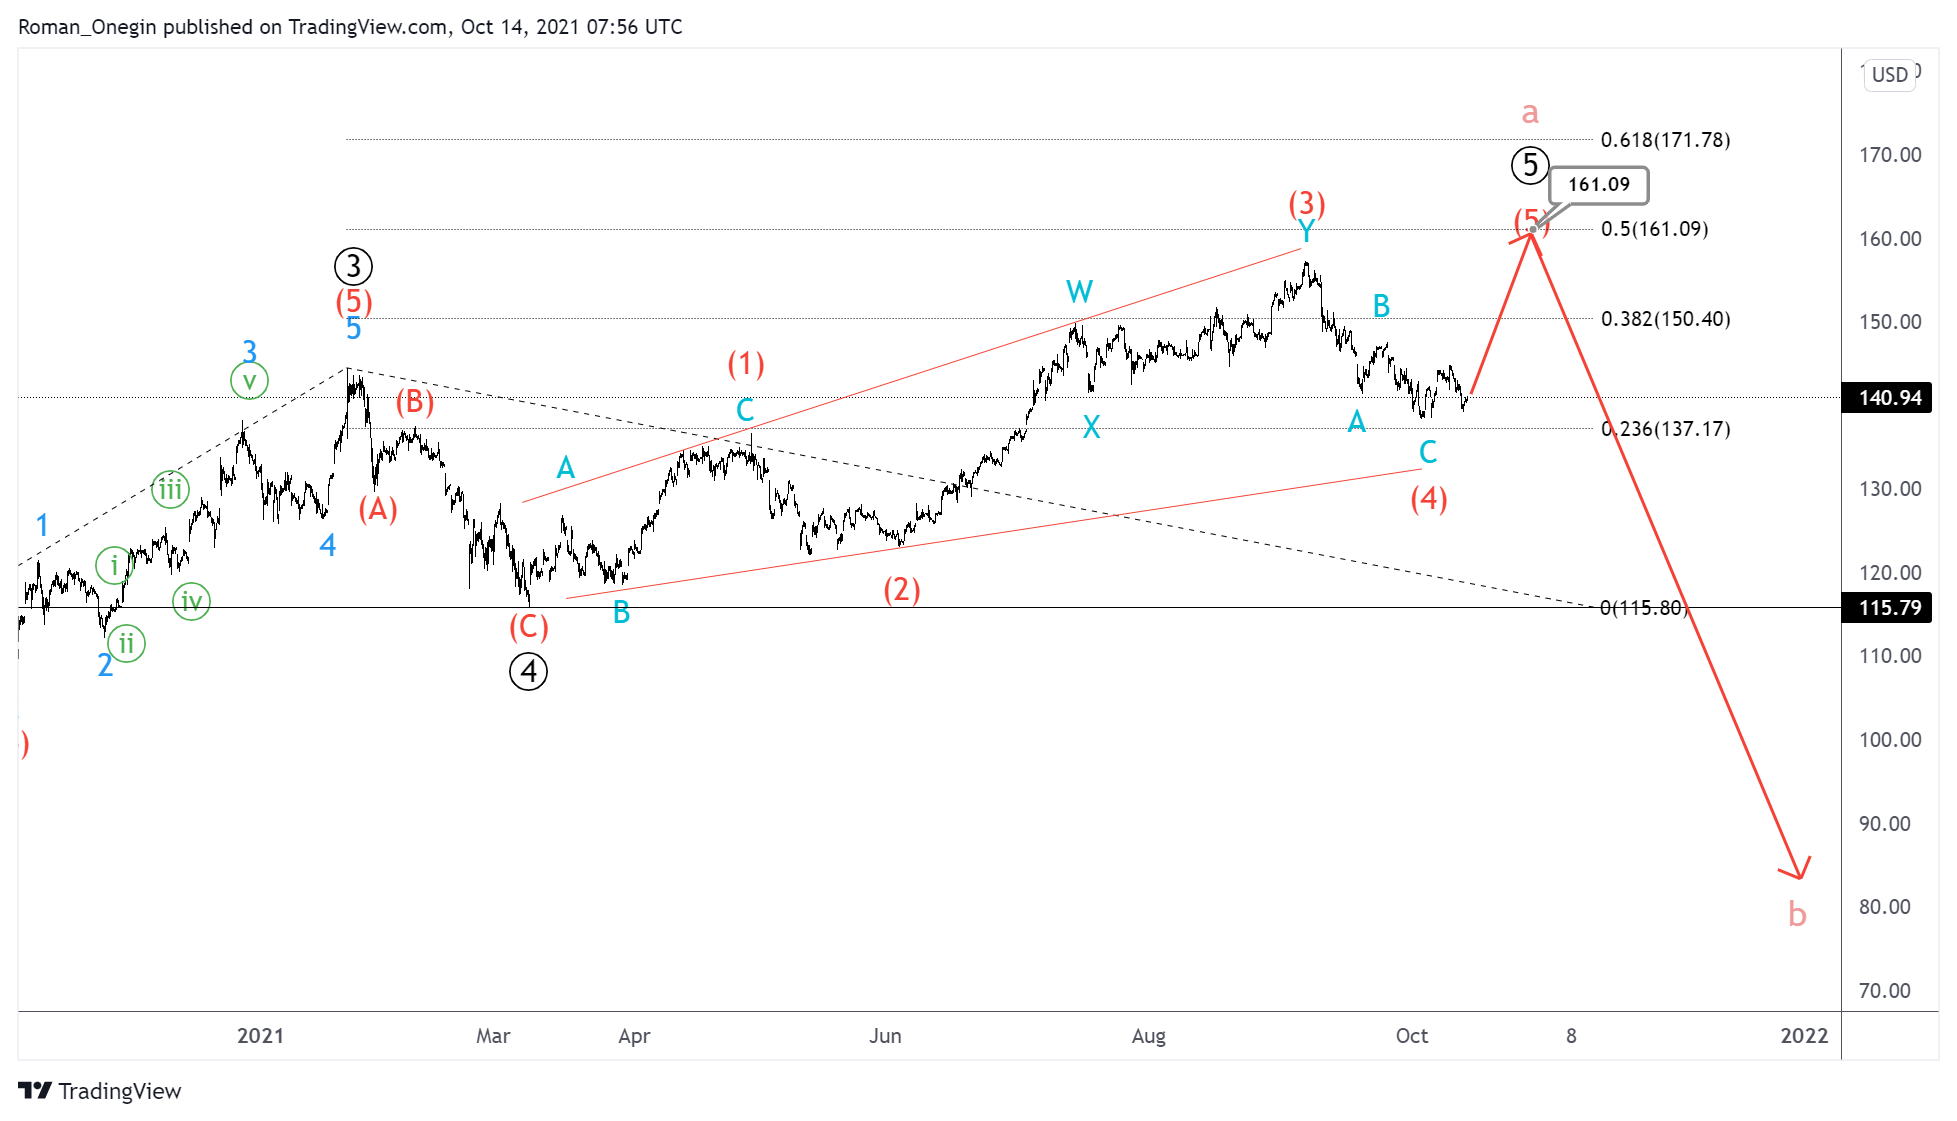
An alternative take is that an intermediate zigzag correction (4) has already been formed, and now the price is moving up in the final wave (5).

Price growth is likely to reach the level of 161.09. This is where the ending diagonal ⑤ will be at 50% of primary wave ③.

After the completion of the ending diagonal, prices could decline in the cycle correction b, below the level of 115.79.


Orbex-LogoArticle by Orbex

Orbex is a fully licensed broker that was established in 2011. Founded with a mission to serve its traders responsibly and provides traders with access to the world’s largest and most liquid financial markets. www.orbex.com

Intraday Market Analysis – USD Seeks Support

By Orbex

USDCHF tests short-term support

USDCHF

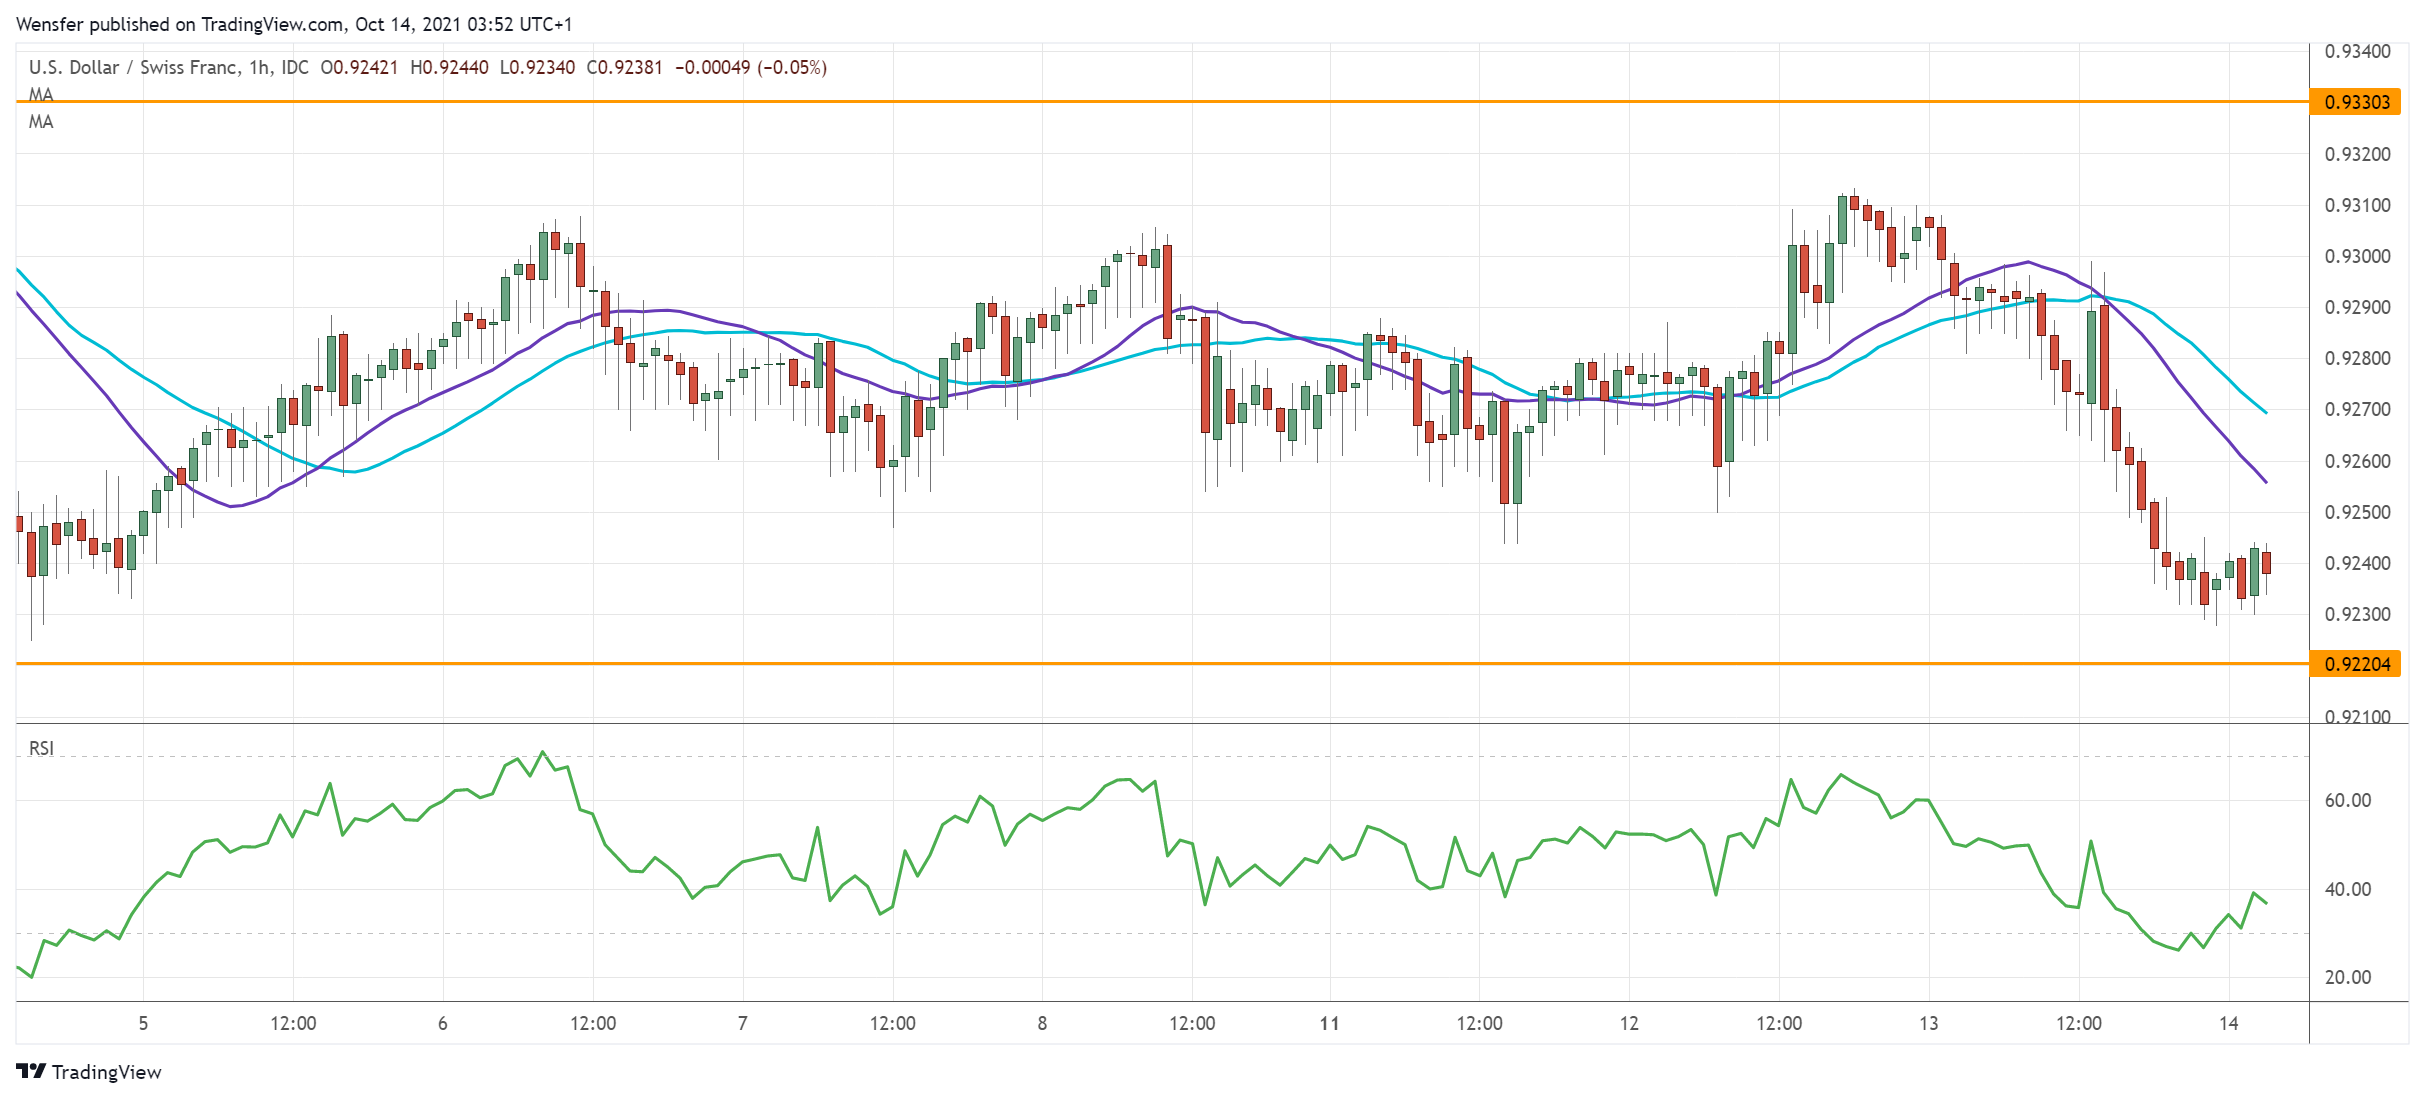
The US dollar eased after the FOMC minutes failed to pinpoint the first rate hike next year. The drop below 0.9280 was a sign of profit-taking after the RSI showed that the rally had overextended.

The pair has then found support along the 20-day moving average (0.9220). This is a major level for the bulls to keep the uptrend intact after a short-lived bounce revealed weakness.

A bearish breakout would send the pair to 0.9150. A rebound could propel the pair to 0.9400 if it succeeds in absorbing offers around 0.9330.

AUDUSD tests key resistance

AUDUSD

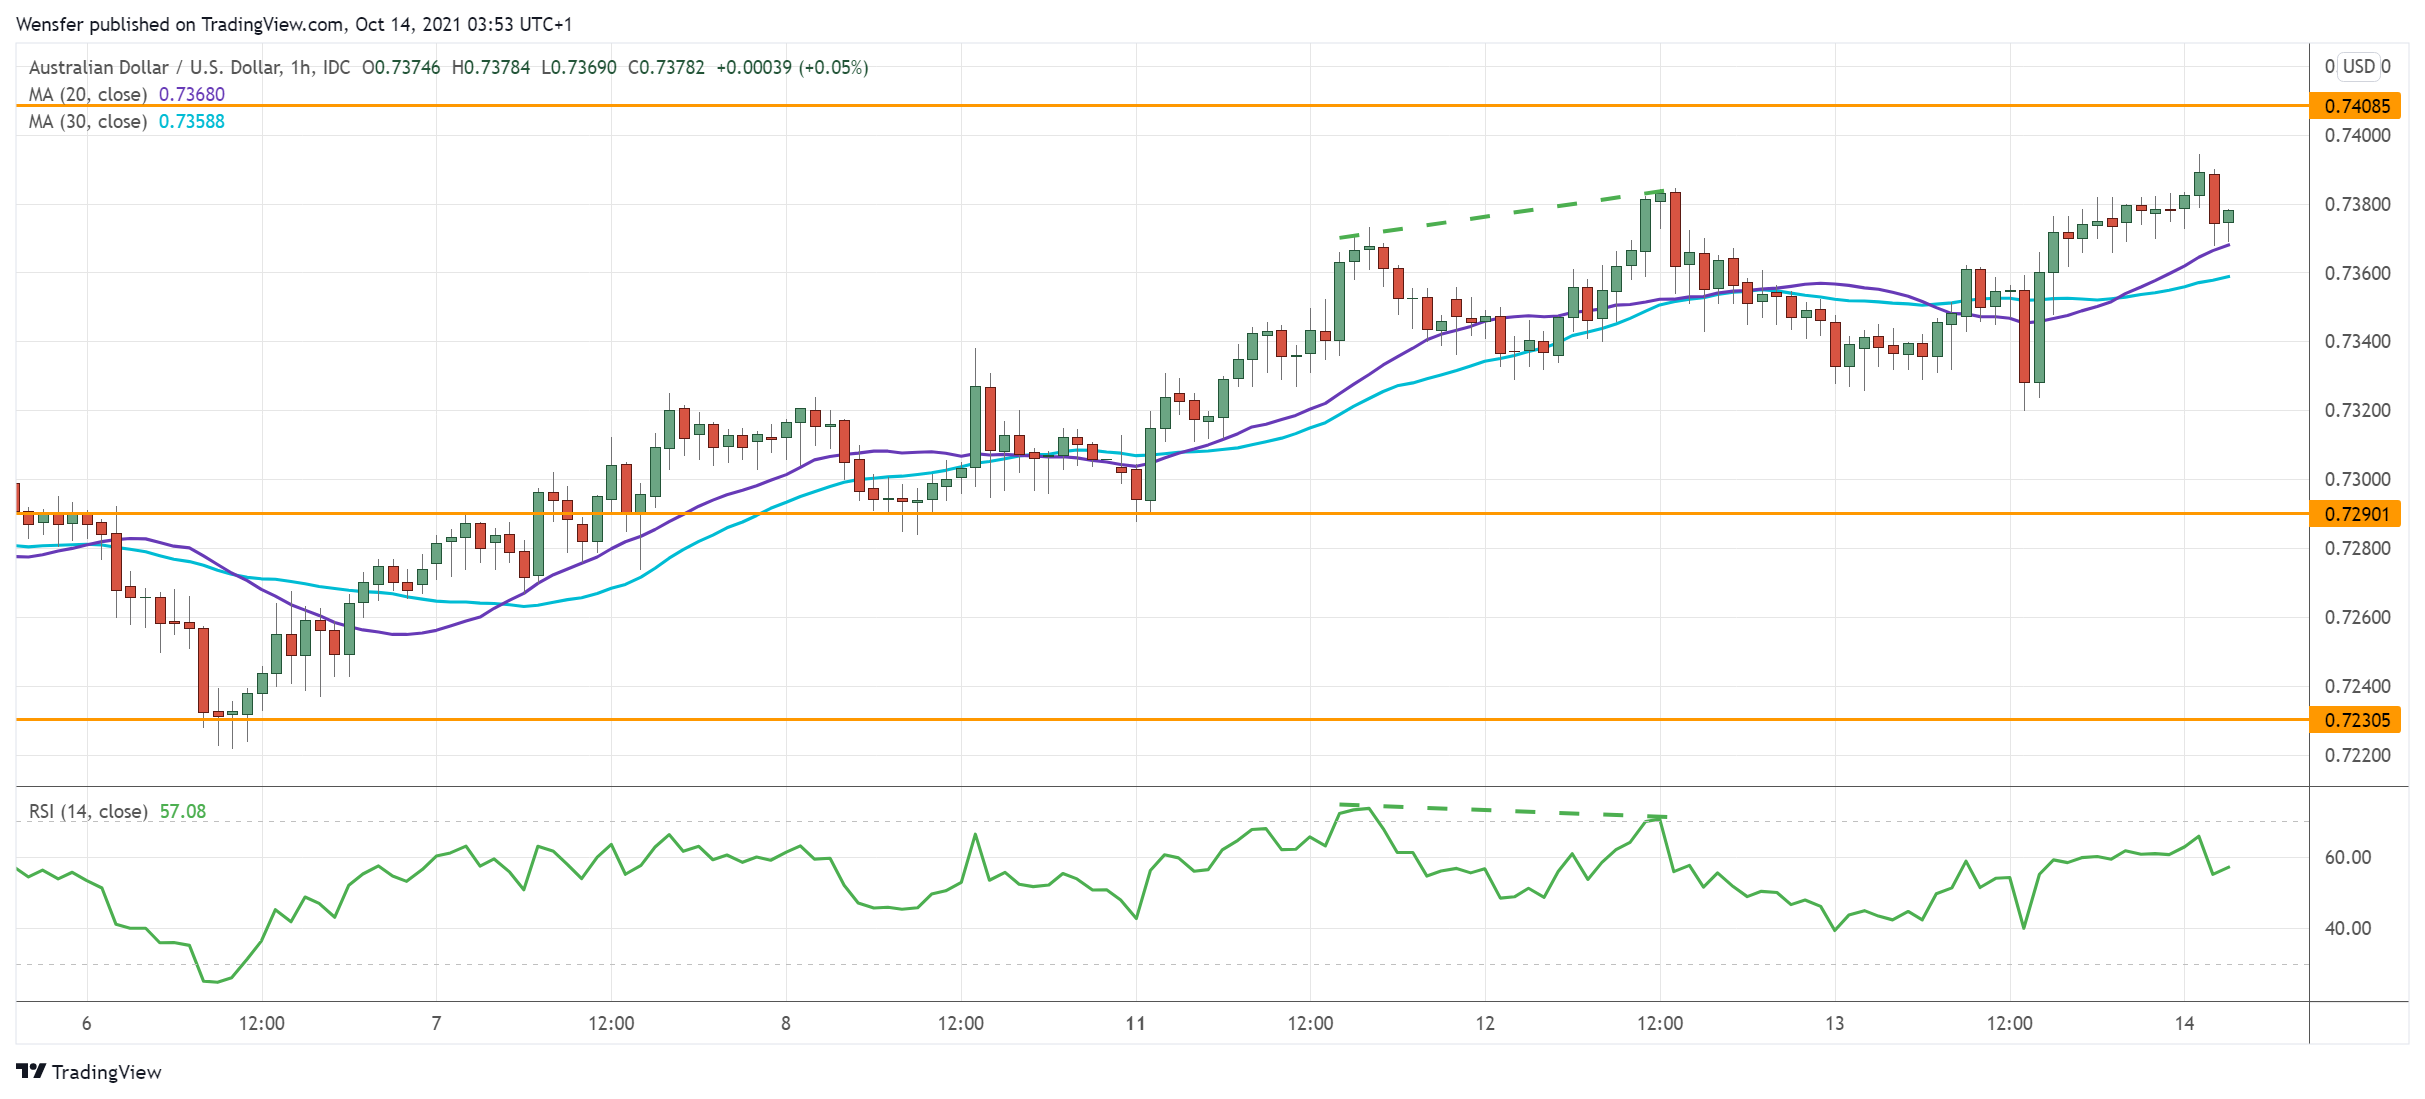
The Australian dollar rallied after the unemployment rate fell to 4.6% in September. The pair has met stiff selling pressure near 0.7480, a supply zone from the sell-off in early September.

The RSI’s double top in the overbought area and its bearish divergence are signs of exhaustion. This has led cautious buyers’ to take some chips off the table with a drop below 0.7335.

0.7290 would be the support to monitor in case of a pullback. On the upside, a greater high would pave the way for September’s peak at 0.7460.

EURGBP hovers above major support

EURGBP

The pound inched higher after Britain’s GDP returned to positive territory in August. The euro, on the other hand, has fallen victim to the selling pressure after it broke below 0.8530.

Price action is heading to 0.8450, a daily support from the August rally. To the bulls’ relief, the RSI’s divergence shows a slowdown in the bearish impetus.

They will need to lift 0.8520 before they could attempt a reversal. Failing that, a breakout below the said floor would trigger an extended sell-off towards 0.8360.


Orbex-LogoArticle by Orbex

Orbex is a fully licensed broker that was established in 2011. Founded with a mission to serve its traders responsibly and provides traders with access to the world’s largest and most liquid financial markets. www.orbex.com

Japanese Candlesticks Analysis 14.10.2021 (XAUUSD, NZDUSD, GBPUSD)

Article By RoboForex.com

XAUUSD, “Gold vs US Dollar”

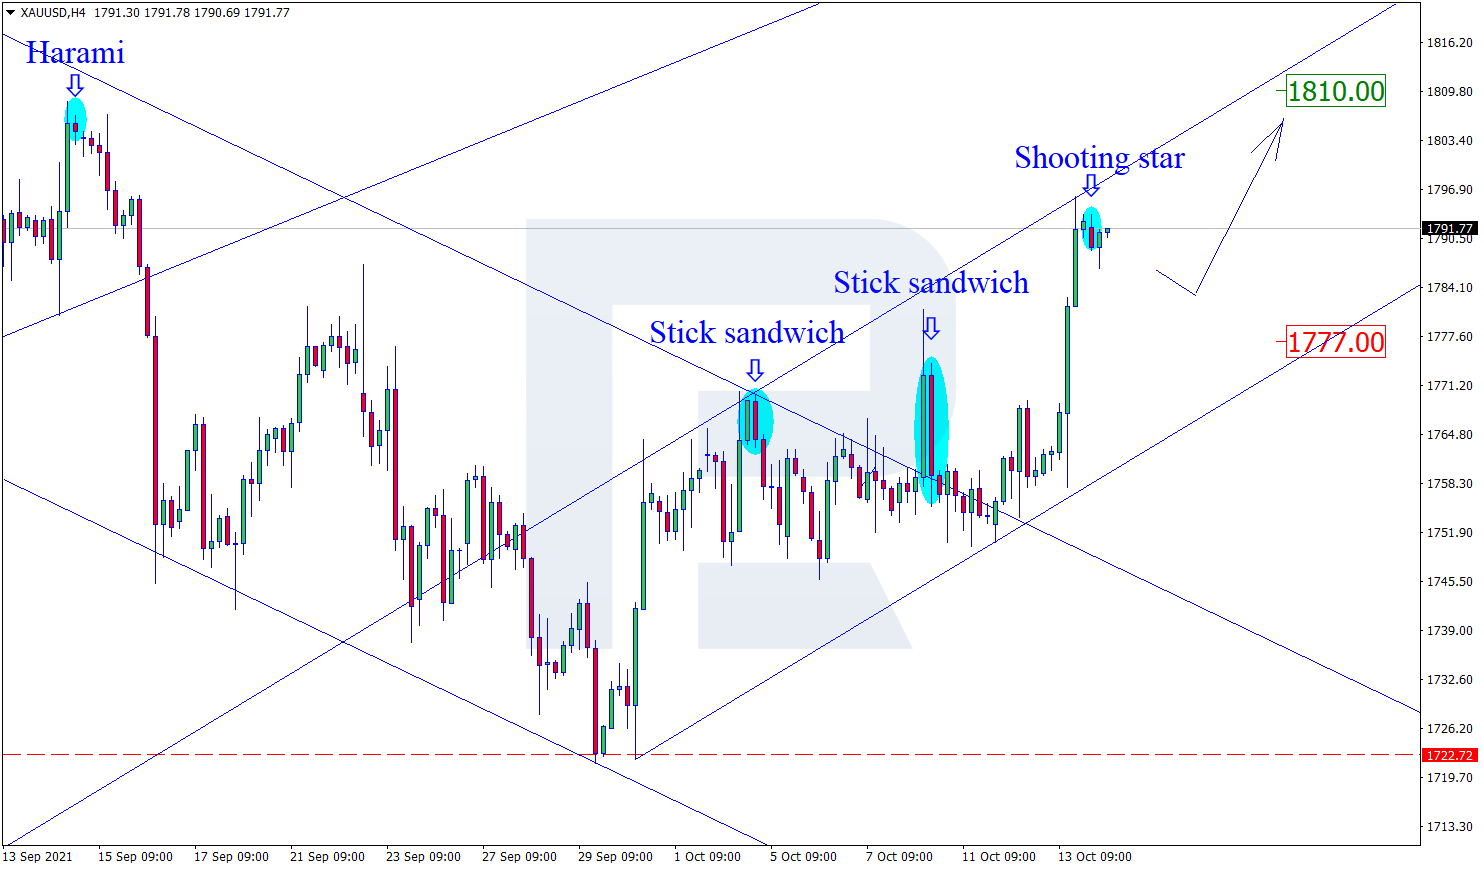
As we can see in the H4 chart, the asset continues trading upwards. After forming several reversal patterns, such as Shooting Star, not far from the resistance level, XAUUSD is reversing and may form a new correctional impulse. In this case, the downside target may be the support area at 1777.00. At the same time, an opposite scenario implies that the price may continue growing towards 1810.00 without any corrections.

XAUUSD
Risk Warning: the result of previous trading operations do not guarantee the same results in the future

NZDUSD, “New Zealand vs US Dollar”

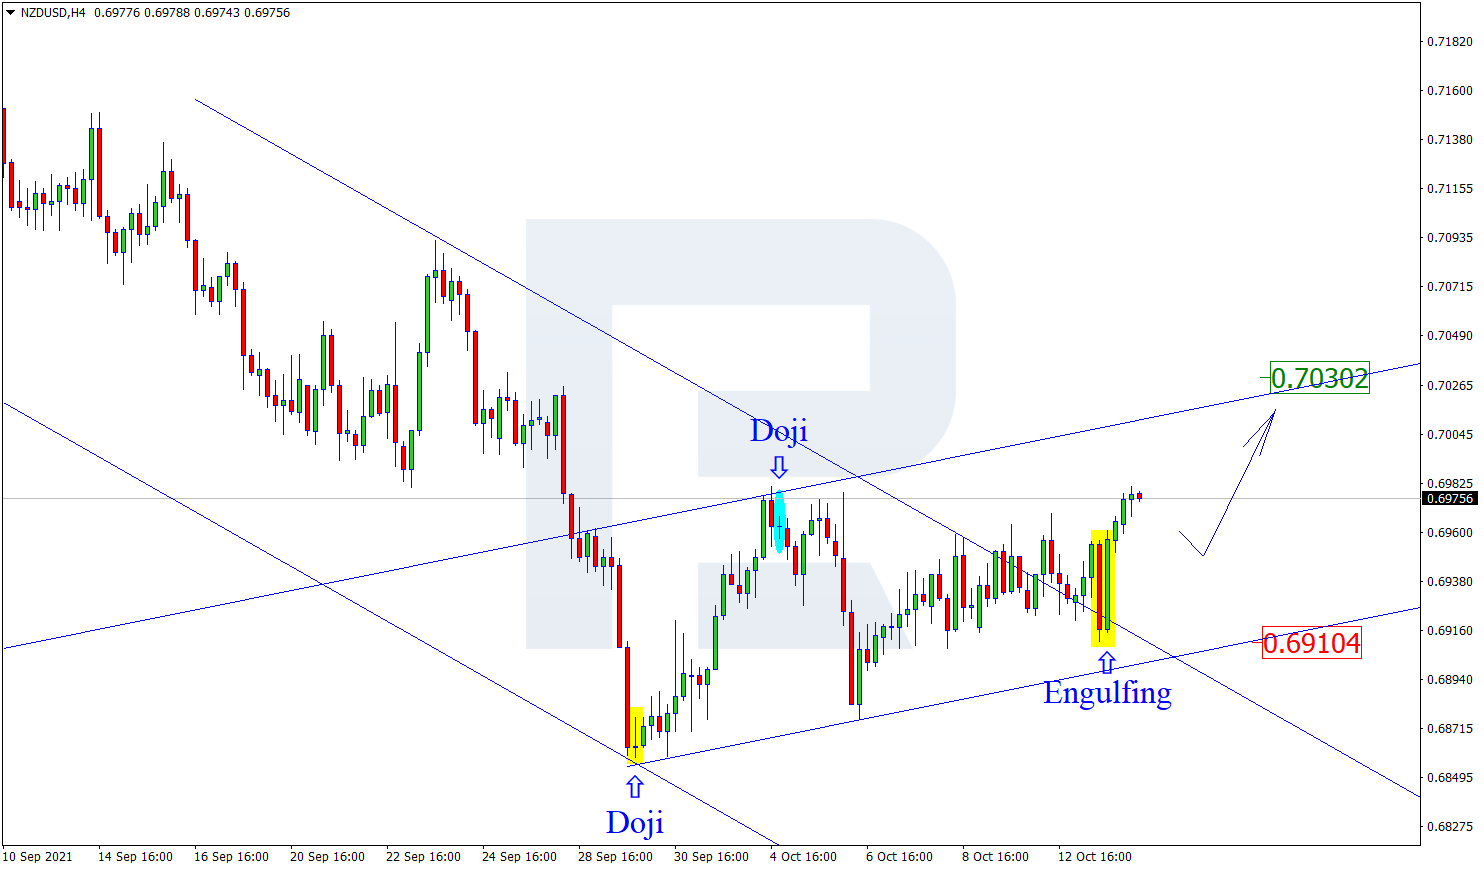
As we can see in the H4 chart, NZDUSD has formed several reversal patterns, such as Engulfing, close to the support level. At the moment, the asset is reversing in the form of a new growth. In this case, the upside target may be the resistance area at 0.7030. After that, the asset may break it and continue moving upwards. However, an alternative scenario implies that the price may correct to reach 0.6910 before resuming its ascending tendency.

NZDUSD
Risk Warning: the result of previous trading operations do not guarantee the same results in the future

GBPUSD, “Great Britain Pound vs US Dollar”

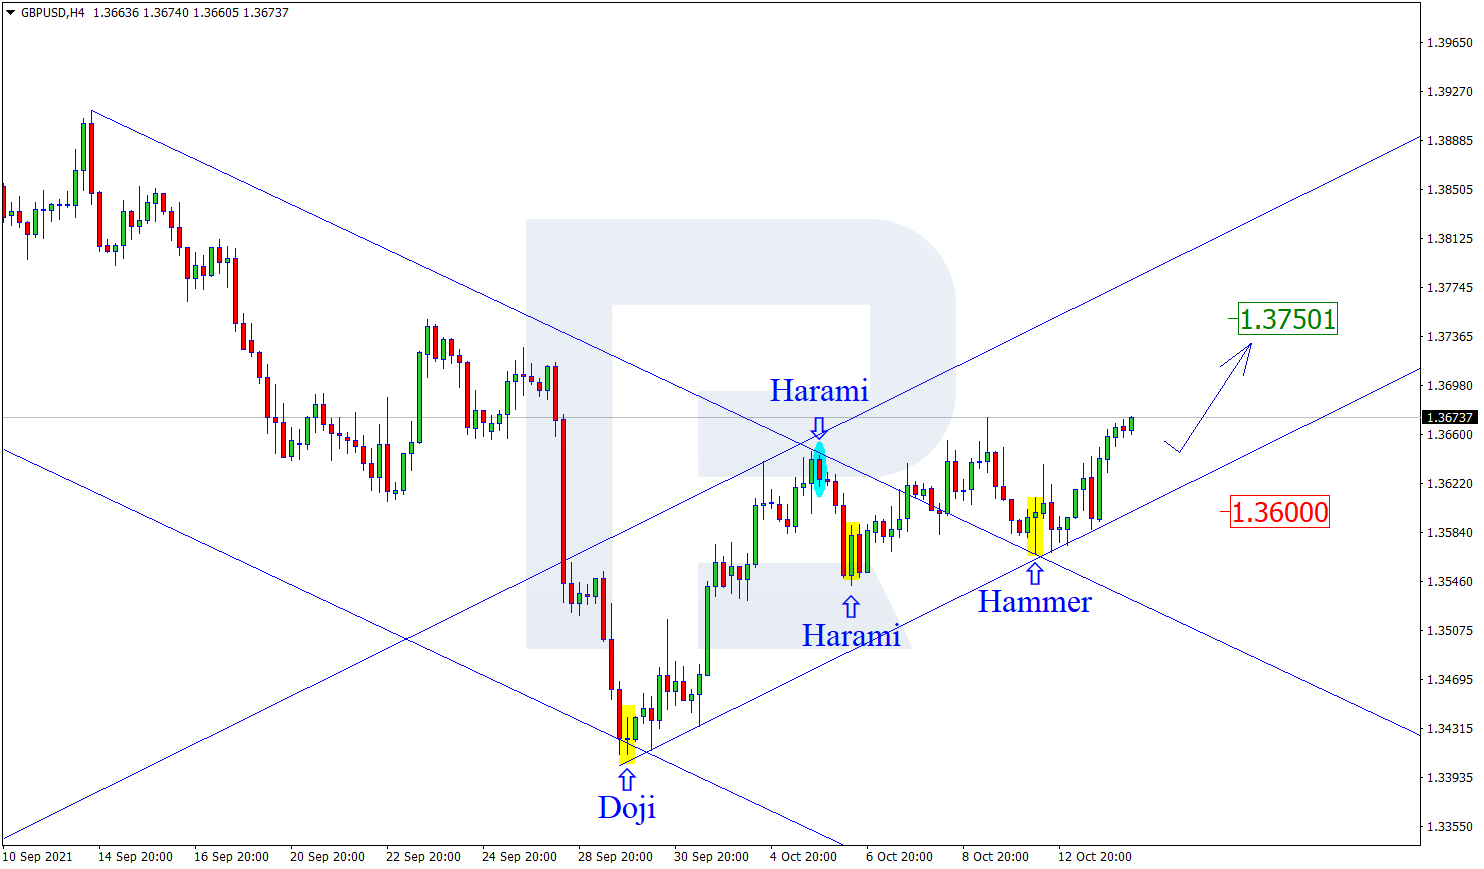
As we can see in the H4 chart, after breaking the channel’s upside border, the asset continues growing. By now, GBPUSD has formed several reversal patterns, such as Hammer, not far from the support area. At the moment, the pair is reversing in the form of another growth. In this case, the upside target may be at 1.3750. After testing the resistance level, the market may break it and continue growing. Still, there might be an alternative scenario, according to which the asset may correct towards 1.3600 before resuming the uptrend to reach the resistance level.

GBPUSD

Article By RoboForex.com

Attention!
Forecasts presented in this section only reflect the author’s private opinion and should not be considered as guidance for trading. RoboForex LP bears no responsibility for trading results based on trading recommendations described in these analytical reviews.

The Analytical Overview of the Main Currency Pairs on 2021.10.14

by JustForex

The EUR/USD currency pair

Technical indicators of the currency pair:
  • Prev Open: 1.1530
  • Prev Close: 1.1596
  • % chg. over the last day: +0.57%

Inflation in Germany remains above 4%, which is the highest level since December 1993. This is mainly due to high energy and food prices. German economic institutions lowered their growth forecast for 2021 to 2.4% from the previous forecast of 3.7%.

Trading recommendations
  • Support levels: 1.1548, 1.1502, 1.1453
  • Resistance levels: 1.1615, 1.1671, 1.1717, 1.1772, 1.1802, 1.1835

From the technical point of view, the EUR/USD trend is bearish. The MACD indicator has become positive. Under such market conditions, traders can look for Sell deals from the resistance levels near the moving average. Buy trades should be considered only from the support levels or from the buyers’ initiative zone.

Alternative scenario: if the price breaks out through the 1.1615 resistance level and fixes above, the mid-term uptrend is more likely to resume.

EUR/USD
News feed for 2021.10.14:
  • – US Producer Price Index (m/m) at 15:30 (GMT+3);
  • – US Initial Jobless Claims (w/w) at 15:30 (GMT+3);
  • – US FOMC Member Bostic’s Speech at 17:00 (GMT+3);
  • – US FOMC Member Barkin’s Speech at 20:00 (GMT+3).

The GBP/USD currency pair

Technical indicators of the currency pair:
  • Prev Open: 1.3586
  • Prev Close: 1.3660
  • % chg. over the last day: +0.54%

UK actual GDP for the month increased by 0.4% (forecast 0.5%, previous 0.1%). Industrial and manufacturing productions also increased slightly, compared to the previous month.

Trading recommendations
  • Support levels: 1.3617, 1.3584, 1.3532, 1.3457, 1.3360, 1.3282
  • Resistance levels: 1.3685, 1.3759, 1.3812, 1.3886

On the hourly time frame, the GBP/USD trend is bearish. However, the British currency looks more confident than the euro due to its direct correlation with oil prices and approaching the priority change level on the current timeframe. The MACD has become positive. Buy trades should be considered only within the day and only from the initiative zone of the buyers. It is better to look for sell deals from the nearest resistance levels, but after an additional confirmation in the form of a sellers’ initiative, because the buyers’ pressure is higher now.

Alternative scenario: if the price breaks through the 1.3685 resistance level and consolidates above, the bullish scenario is likely to resume.

GBP/USD
There is no news feed for today.

The USD/JPY currency pair

Technical indicators of the currency pair:
  • Prev Open: 113.58
  • Prev Close: 113.24
  • % chg. over the last day: -0.30%

The Japanese currency has weakened nearly 4% against the dollar over the past three weeks.However, there are signs that this might just be the start of a much bigger decline in the future as the Bank of Japan is not going to take any action on monetary policy yet while the Fed prepares to cut its QE program.

Trading recommendations
  • Support levels: 113.25, 112.19, 111.53, 110.99, 110.65, 109.95, 109.63
  • Resistance levels: 113.66, 114.40

The main trend of the USD/JPY currency pair is bullish. The Japanese yen is rapidly declining against the US dollar. The MACD indicator has become inactive. Under such market conditions, it’s better to look for buy positions from the support levels near the moving average, since the price has deviated greatly from the average line. Sell positions should be considered only throughout the day from the resistance levels, given there is sellers’ initiative.

Alternative scenario: if the price falls below 111.53, the uptrend is likely to be broken.

USD/JPY
News feed for 2021.10.14:
  • – Japan Industrial Production (m/m) at 07:30 (GMT+3).

The USD/CAD currency pair

Technical indicators of the currency pair:
  • Prev Open: 1.2460
  • Prev Close: 1.2441
  • % chg. over the last day: -0.15%

The Canadian dollar is a commodity currency, so USD/CAD is highly dependent on the dynamics of the dollar index and oil prices. At the end of yesterday the dollar index sharply decreased on the news on inflation in the US, while oil prices remained unchanged. As a result, the price of the USD/CAD currency pair declined due to the weakness of the US currency.

Trading recommendations
  • Support levels: 1.2425
  • Resistance levels: 1.2518, 1.2565, 1.2628, 1.2729, 1.2774, 1.2891

From the technical point of view, the trend of the USD/CAD currency pair is bearish. But now the price is trading in a corridor which turns into a narrowing triangle pattern. The MACD indicator has become inactive, but there are signs of divergence on higher time frames. Under such market conditions, it is better to search for sell deals from the resistance levels near the moving average, as the price has strongly deviated from the average values. Buy trades should be considered only on lower time frames from the support levels, if there is the buyer’s initiative after the price breakout the triangle upwards.

Alternative scenario: if the price breaks out through the 1.2565 resistance level and fixes above, the uptrend will likely resume.

USD/CAD
News feed for 2021.10.14:
  • – US Crude Oil Reserves (w/w) at 18:00 (GMT+3).

by JustForex


This article reflects a personal opinion and should not be interpreted as an investment advice, and/or offer, and/or a persistent request for carrying out financial transactions, and/or a guarantee, and/or a forecast of future events.

Chile raises rate 3rd time by more than expected

By CentralBankNews.info

Chile’s central bank raised its key interest rate for the third time this year, and by more than expected for the second time, saying it expects the policy rate to reach a neutral level sooner than forecast as it needs to prevent a “more persistent increase in inflation” to above its target over the next 2 years.
The Central Bank of Chile raised its monetary policy interest rate by 1.25 percentage points to 2.75 percent and has now raised it by a massive 2.25 percentage points in four months following earlier hikes in July and August.
As in August, the bank’s board was unanimous in its decision.
Although the size of today’s rate hike exceeded expectations, analysts had set their sights on a sharp rate hike following news inflation in September rose to a higher-than-expected 5.3 percent, the highest rate since November 2014 and up from 4.8 percent in August.
On top of higher prices for food, transportation, housing and utilities, Chilean lawmakers are debating new pension withdrawals that could pump as much as $20 billion into the economy.
      The central bank said the rise in inflation reflected upward pressures on both the demand and cost side along with the deprecation of the peso.
      “In this context, inflation expectations have risen in all horizons,” the bank said, adding expectations for this year now exceed 6 percent and two years ahead they are over 3.0 percent.
      Chile’s economy has bounced back swiftly from the COVID-19 pandemic and in the second quarter the economy grew 18.1 percent year-on-year.
      In September the central bank raised its forecast for growth this year to 10.5 percent to 11.5 percent from its earlier estimate of 8.5 percent to 9.5 percent.
       In its December monetary policy report the central bank said it would update its trajectory for the monetary policy rate to prevent the rise in inflation from topping its 3.0 percent target.
     The Central Bank of Chile issued the following press release:

“At its Monetary Policy Meeting, the Board of the Central Bank of Chile decided to raise the monetary policy interest rate (MPR) by 125 basis points, to 2.75%. The decision was adopted by the unanimous vote of its members.

 On the external front, the outlook for global activity has moderated at the margin, as a result of the constraints associated with new Covid-19 outbreaks in some economies and persistent bottlenecks around the world, which has held back growth in certain industries. This has occurred in a context of further rising global inflation. In recent days, there have been notorious increases in fuel prices, with oil rising above US$80 per barrel, that is, an increase of more than 15% since the latest Meeting. Copper has continued to trade at around $4.2 per pound. In this scenario, several central banks have adopted a less expansionary stance, as the Fed and the Bank of England have made changes in their communications and Norway, New Zealand and several emerging economies have raised their policy rates. The international financial markets show a reduced appetite for risk, considering both the aforementioned elements and the fear surrounding China’s real-estate sector. This has led to interest rate increases across the board, a depreciation of a significant number of currencies against the dollar, and mixed movements in the stock markets.

In Chile, the financial markets have deteriorated much more strongly and systematically, standing at the extremes of international movements. This is explained by idiosyncratic factors, especially the change in the inflation outlook and uncertainty surrounding political and legislative issues, most importantly new withdrawals of pension funds. In the fixed-income market, interest rates rose in every category, especially in the medium and long tranches. The 10-year nominal interest rate exceeded 6.5%, a record high in over a decade. This, since early September to date, the difference with its U.S. counterpart went from around 370 basis points (bp) to near 500pb. Over the same period, the exchange rate continued to rise, accumulating a depreciation of more than 5% relative to the dollar, while the IPSA fell by around 8% and the country risk (CDS) increased by some 25pb.

Regarding activity, the August Imacec rose 19.1% annually and 1.1% monthly in seasonally adjusted terms. Trade continues to lead as the most dynamic sector, while several lagging sectors —especially service activities— have been returning to their pre-pandemic levels. This result, together with high demand, have responded to the easing of sanitary restrictions. Investment-related items have shown a significant rebound, reflecting a recovery that has become more transversal, beyond the fact that the tradable component continues to be the most dynamic. In the labor market, employment has increased in the main categories, accompanied by a fall in the rate of inactivity and unemployment, which stood at 8.5% in the June-August quarter. Still, there remains a clear mismatch between labor supply and demand, mainly among the less skilled, which has also reflected in wage increases. In this context, private expectations for this year’s growth have risen further, up to 11% in the Economic Expectations Survey (EES) of October. For the years 2022 and 2023, the economic performance expectation is reduced considerably, to around 2% each. Business confidence (IMCE) is in optimistic territory, with increased hiring in the short term, although it also shows higher costs and inventory shortages. Among consumers, meanwhile, confidence shows a slight drop (IPEC), especially affected by the increase in inflation which, according to several qualitative indicators, ranks first as the economic issue of greatest concern for Chileans.

As for bank credit, consumer and commercial loans reduced their annual contraction rates in real terms, while the flow of mortgage loans has remained fairly stable. Interest rates posted new marginal increases in every portfolio. Meanwhile, the Bank Lending Survey of the third quarter shows stronger demand in most credit segments, while supply is more stable according to measured perceptions.

In September, the annual variation of the CPI rose to 5.3%, outweighing expectations, while its core part accumulated an annual increase of 4.2%, close to the forecast in the September Monetary Policy Report. The increase of recent months has affected every item in the CPI basket, reflecting inflationary pressures on both the demand and the cost side, as well as the sharp depreciation of the peso. In addition, in recent months the INE has been reinstating in its measurement the prices imputed during the pandemic. In this context, inflation expectations have risen in all horizons. In the immediate term, some measures exceed the forecasts in the September MP Report, going past 6% for the end of this year. Two years ahead, the median of the EES and of the Financial Traders Survey (FTS) has risen and remains above 3% annually.

The evolution of the macroeconomic scenario has increased the risks regarding the convergence of inflation to the 3% target within the policy horizon. Although core inflation has evolved in line with projections, the outlook for the coming months has been rising, in a context where inflation expectations two years ahead stand above the 3% target. The Board has decided to anticipate the withdrawal of the monetary stimulus, projecting that the policy rate will reach its neutral level sooner than foreseen in the September Report’s central scenario. The MPR trajectory will be assessed in the next Monetary Policy Report, taking consideration of the need to prevent a more persistent increase in inflation that drives it to depart from the 3% target in the two-year horizon.

Additionally, the Board agreed to suspend the reserve accumulation program initiated last January, by virtue of the recent evolution of the financial market and the level of international reserves already reached.

The minutes of this Monetary Policy Meeting will be released at 8:30 hours of Thursday 28 October 2021. The next Monetary Policy Meeting will be held on 14 December 2021, and the statement thereof will be published at 18:00 hours the same day.”

www.CentralBankNews.info

Market mood improves on recovery hopes; Gold eyes $1800

Lukman Otunuga

By Lukman Otunuga Senior Research Analyst, ForexTime

Markets in Asia were mostly higher on Thursday, tracking the positive overnight cues from Wall Street as investors evaluated the U.S inflation data and latest minutes from the September Fed meeting. The improving sentiment across Asian markets was also helped by optimism over the global economic recovery and prospects of higher interest rates to tame inflation. The greenback had it rough while gold enjoyed its best session in seven months, gaining almost 2% helped by falling Treasury yields. European markets have opened higher this morning with US futures also in the green.

Dollar humbled by inflation data 

The dollar weakened across the board yesterday in a ‘buy the rumour, sell the fact’ reaction following the hot U.S inflation report. Consumer prices in the United States increased 5.4% year-over-year in September after advancing 5.3% in August and 0.4% versus expectations of 0.3% on the month. The decline in Treasury yields dragged the greenback lower with the Dollar Index (DXY) tumbling towards the 94.00 level. While the firm inflation data reinforced taper expectations, it has also fuelled speculation around the Federal Reserve raising interest rates sooner than expected. This has  been reflected in Fed Funds futures which have pulled forward the first interest rate hike from late 2022 to almost a full 25 basis point hike by September. The prospects of higher interest rates down the line could limit the dollar’s losses.

Fed officials see tapering in Q4 

According to the minutes from September’s policy meeting, Federal Reserve officials agreed they should start tapering in mid-November or mid-December. In regard to inflation, most officials at the meeting expressed concerns over the associated risks due to supply disruptions and labour shortages. Overall, the minutes were hawkish and confirmed that tapering could start as early as next month.

Oil bulls remain in the building

Oil is continuing its upward trend, driven by the global energy crunch and supply restraints from the world’s top producers. The commodity found itself under pressure on Wednesday thanks to OPEC’s monthly report and the American Petroleum Institute reporting a larger-than-expected increase in stockpiles. OPEC cut its global demand outlook for 2021 from 5.96 million barrels per day (bpd) to 5.82 million bpd due to the Delta variant outbreaks in the summer. However, it left its forecast for 2022 unchanged at 4.15 million bpd.

All eyes will be on the Energy Information Agency (EIA) U.S crude oil inventory report and the International Energy Agency (IEA) monthly oil market report today. If they illustrate a similar outlook to OPEC, where the demand is projected to decline in 2021, this could impact upside gains.

Both WTI and Brent crude have appreciated over 60% since the start of 2021. With Brent trading around $83.88 as of writing, some analysts are targeting the psychological $100 level in 2021 which has not been seen since 2014.

Commodity spotlight – Gold 

Gold prices exploded higher on Wednesday afternoon, gaining almost 2% as the dollar and Treasury yields tumbled following the hot US inflation report. With gold highly sensitive to taper expectations, real yields and the dollar’s direction, the next few weeks could be wild for the precious metal.

In regard to the technical picture, the widely watched 200-day moving average is just below $1800. But a strong move above that level could open the doors towards the summer highs at $1834. Should $1800 prove to be reliable resistance, a decline back towards $1777 could be on the cards.

Disclaimer: The content in this article comprises personal opinions and should not be construed as containing personal and/or other investment advice and/or an offer of and/or solicitation for any transactions in financial instruments and/or a guarantee and/or prediction of future performance. ForexTime (FXTM), its affiliates, agents, directors, officers or employees do not guarantee the accuracy, validity, timeliness or completeness, of any information or data made available and assume no liability as to any loss arising from any investment based on the same.


Forex-Time-LogoArticle by ForexTime

ForexTime Ltd (FXTM) is an award winning international online forex broker regulated by CySEC 185/12 www.forextime.com

High inflation in the US may be delayed for several quarters

by JustForex

US stock indices ended yesterday’s trading without a single trend. The Dow Jones index has not changed much, while the S&P 500 and Nasdaq added 0.3% and 0.73%, respectively. According to the Fed meeting, in September, the Fed leaders discussed the plan of cutting the quantitative easing program (QE), holding the view that the reduction of asset purchases should begin by the end of this year and be completed by mid-2022. The reduction in asset purchases could begin in mid-November or mid-December. Fed officials also pointed to risks that inflation would take longer than expected, especially if labor and other resource shortages will be more constant.

The US Consumer Price Index increased to 5.4% (expected 5.3%), the largest annual gain since 2008. The core CPI, which excludes food and energy prices, remained at level of 4%. On the back of this news, the dollar index was losing ground yesterday.

Apple stock fell by almost 10% since the beginning of September and decreased by  2% in yesterday’s trading after the company released news on the limitation of production goals.

Former US President Donald Trump blasted the presidency of his successor, Joe Biden, in a message on Wednesday. “COVID is raging out of control, our supply chains are crashing with little product in our stores, we were humiliated in Afghanistan, our Border is a complete disaster, gas prices and inflation are zooming upward—how’s Biden doing? Do you miss me yet?” said Trump.

Famous companies reporting today are Taiwan Semiconductor, UnitedHealth, Bank of America, Wells Fargo&Co, Morgan Stanley, Citigroup, Domino’s Pizza Inc.

European stock indices traded mixed yesterday. German DAX and French CAC 40 closed with solid gains of 0.7% and 0.8%. At the same time Italian FTSE MIB and Spanish IBEX 35 indices decreased by 0.1% and 0.6%, respectively. The energy crisis, problems in the supply chain and inflationary pressures continue to pressure on the market. EU energy ministers will hold an emergency meeting on October 26 to address the energy problem. Deutsche Bank’s CEO urged the European Central Bank to review monetary policy in light of rising inflationary threats.

Nyrstar, one of the world’s largest zinc metal producers, is shutting down up to 50% of its production in Europe due to soaring energy costs. Zinc prices are skyrocketing.

Oil prices resumed their growth after a slight decline the day before. The market is still under pressure by the energy crisis in Europe and Asia, which contributes to increased demand for oil with a restrained increase in production by OPEC+ countries. The US EIA raised its 2021 Brent crude oil price forecast from $68.6 to $71.4 per barrel. The White House is in talks with US oil and gas producers about how companies can help lower oil prices.

The last time oil was above $80 per barrel (2014), the US and European oil and gas companies were trading at levels 1.5 to 2 times higher than they are now. The key difference this time is that trillions of investment dollars are now associated with environmental and social regulations that prohibit exposure to dirty energy.

Gold prices jumped 2% after US inflation data. But analysts are confident that the rise in gold and silver prices is temporary, as prices for these metals will fall rapidly when the QE program is cut.

Asia’s largest refiner, which is based in China, intends to cut fuel exports as it wants to keep more supplies for domestic consumption amid an energy crisis caused by coal shortages.

China’s inflation has remained roughly the same, but the gap between producer and consumer inflation widened in September to 10%, the highest level since 1993.

Main market quotes:

S&P 500 (F) 4,363.80 +13.15 (+0.30%)

Dow Jones 34,377.81 −0.53 (−0.002%)

DAX 15,249.38 +102.51 (+0.68%)

FTSE 100 7,141.82 +11.59 (+0.16%)

USD Index 94.03 −0.48 (−0.51%)

Important events for today:
  • – Australia Unemployment Rate (m/m) at 03:30 (GMT+3);
  • – China Consumer Price Index (m/m) at 04:30 (GMT+3);
  • – China Producer Price Index (m/m) at 04:30 (GMT+3);
  • – Japan Industrial Production (m/m) at 07:30 (GMT+3);
  • – US Producer Price Index (m/m) at 15:30 (GMT+3);
  • – US Initial Jobless Claims (w/w) at 15:30 (GMT+3);
  • – US FOMC Member Bostic’s Speech at 17:00 (GMT+3);
  • – US Natural Gas Storage (w/w) at 17:30 (GMT+3);
  • – US Crude Oil Reserves (w/w) at 18:00 (GMT+3);
  • – US FOMC Member Barkin’s Speech at 20:00 (GMT+3).

by JustForex


This article reflects a personal opinion and should not be interpreted as an investment advice, and/or offer, and/or a persistent request for carrying out financial transactions, and/or a guarantee, and/or a forecast of future events.

Introducing David Card, the 2021 Nobel Prize in Economics winner who made the minimum wage respectable

By John Hawkins, University of Canberra 

Every year Australia’s Fair Work Commission considers whether to raise the minimum wage. And every year business leaders warn doing it will cost jobs.

This year’s Nobel Prize in economics has been awarded to US-based economist David Card for his work with Alan Krueger in reversing this perception.

Before Card and Krueger “everyone knew” that imposing or increasing a minimum wage would cost jobs. Employers wouldn’t have the money to keep on as many staff.

Card and Krueger work turned that proposition into the Loch Ness Monster of economics – often discussed but never actually seen. It wasn’t just that economists weren’t looking hard enough to find it, it was that it wasn’t there.

In an influential article in 1994, later expanded into a book, Card and Krueger examined a “natural experiment”. In 1992 the US state of New Jersey increased its minimum wage to be the highest in the US. The neighbouring state of Pennsylvania did not.

Surveying fast food workers either side of the border

Fast food outlets employ many workers on the minimum wage.

Card and Krueger surveyed around 400 outlets on either side of the state border. They wanted to see whether there was any difference in the changes in the numbers of workers employed in the cities that were near each other but differed only in what they had done to the minimum wage.

They found “no indication” that the rise in the minimum wage cost jobs.

A 2021 study found support for minimum wages had spread to institutions as well-pedigreed as the International Monetary Fund and the OECD.

It described Card and Kreuger’s paper as “central to this change in view”.

Card and Kreuger’s work has been cited in judgements of Australia’s Fair Work Commission.

It means their work has helped determine the incomes of low wage workers in a country half a world away, a classic example of economist John Maynard Keynes’ dictum about the impact of academic scribblers.

“Madmen in authority, who hear voices in the air,” Keynes wrote, “are distilling their frenzy from some academic scribbler of a few years back”.

‘Natural experiments’

In another study casting doubt on received wisdom, Card examined the impact of immigration on the wages and employment of locals. He found it was tiny.

A sad aspect of this year’s Nobel is that Card could not share it with his co-author.

Alan Kreuger arguably made an even greater contribution to economics. His work ranged from the economics of inequality and rock music to terrorism.

Kreuger also served as chair of President Obama’s Council of Economic Advisers. Tragically he took his own life in 2019. Nobels are not awarded posthumously.

Instead the prize was shared with Joshua Angrist and Guido Imbens. Their Nobels were for “methodological contributions to the analysis of causal relationships”.

In many cases economists can’t do controlled experiments. Governments are reluctant to boost the minimum wages of just half of the workforce so that economists can see what happens.

Instead economists create “natural experiments” using things such as the differences between cities on either side of borders. Angrist and Imbens helped establish a framework for how to conduct them.

The award of this year’s Nobel to three US-based men did little to point to diversity in economics.

Male, middle-aged, American

A possible indicator of a future winner is that Susan Athey was this month elected 2022 President of the American Economics Association.

Her research interests include the economics of the internet and news media, machine learning, big data and cryptocurrencies.

This year’s winner David Card is the current president of the American Economics Association, as have been many other previous Nobel winners.

Athey was also the first woman to win the John Bates Clark Medal which is awarded to the American economist under the age of 40 judged to have made the most significant contribution to economic thought and knowledge.

Card is one of many John Bates Clark Medal winners to later win a Nobel.The Conversation

About the Author:

John Hawkins, Senior Lecturer, Canberra School of Politics, Economics and Society and NATSEM, University of Canberra

This article is republished from The Conversation under a Creative Commons license. Read the original article.


Mid-Week Technical Outlook: Gold Explodes Higher

Lukman Otunuga

By Lukman Otunuga Senior Research Analyst, ForexTime

If you are looking for some market action…just take a look at gold.


Gold prices went through the roof on Wednesday afternoon, gaining almost 2% as the dollar and Treasury yields tumbled following the US inflation report.


Consumer prices in the United States increased 5.4% year-over-year in September after advancing 5.3% on a year-on-year basis in August and 0.4% versus expectations for 0.3% on the month. Given how gold is seen as a hedge against inflation, prices could push higher in the near term – especially if Treasury yields continue to decline.


While the fundamentals remain a key component impacting gold prices, the technicals must not be overlooked with today’s sharp appreciation providing some fresh setups.

Same old story on monthly timeframe 

Zooming out on the monthly timeframe, gold remains in a wide range on the monthly charts with support at $1700 and resistance around $1915. Prices have oscillated within these regions since October 2020 with a massive directional catalyst needed for gold to resume or end its monthly uptrend.


Pressure building on weekly charts 

Some pressure seems to be building on the weekly timeframe with the range becoming tighter with each passing week. A breakout/down setup could be in the making with support at $1725 and resistance at $1834. The explosive jump in prices today may provide bulls with enough confidence to challenge the 50-week Simple Moving Average. If a weekly close above $1834 becomes reality, the next key point of interest can be found at $1916.5.


Bulls steal the show on daily 

Looking at the daily charts, prices have turned bullish. The solid break above the previous lower high around $1787 has placed bulls in a position of power. If the upside momentum holds, this could set the foundation for a move beyond $1800 with $1834 acting as the first key level of interest. Beyond here, bulls may eye the $1915-$1917 regions. Alternatively, a decline back below $1777 could suggest a selloff towards $1745.

Disclaimer: The content in this article comprises personal opinions and should not be construed as containing personal and/or other investment advice and/or an offer of and/or solicitation for any transactions in financial instruments and/or a guarantee and/or prediction of future performance. ForexTime (FXTM), its affiliates, agents, directors, officers or employees do not guarantee the accuracy, validity, timeliness or completeness, of any information or data made available and assume no liability as to any loss arising from any investment based on the same.


Forex-Time-LogoArticle by ForexTime

ForexTime Ltd (FXTM) is an award winning international online forex broker regulated by CySEC 185/12 www.forextime.com