AUDUSD is rising and ready to update its local highs.
The Australian Dollar is steadily growing against the USD. The current quote for the instrument is 0.7527.
The statistics published today showed that the Australian CPI was 0.8% q/q in the third quarter, the same as expected. On YoY, the indicator showed 3.1%, which is below market expectations.
It’s rather unusual: basically, the world is fighting inflation boosts and deflation can be seen only in some particular countries, where it’s some kind of chronic disease of local economies. As for Australia, a stable monetary policy and the state’s consistent work with the labour market really pay off.
At the same time, one shouldn’t disregard the possibility of the economic slump in China, which, despite all issues of the last 18 months, remains Australia’s key trade and economic partner. There are a lot of talks on the global market right now relating to a possible slowdown in the Chinese GDP and that’s may have a serious influence on the Australian economy later.
Nevertheless, right now the AUD rate is quite bullish despite the fact that the USD is also pretty strong. We can even say that the current bullish impulse in the Aussie may get stronger and the instrument is on the way to updating its highs.
Attention! Forecasts presented in this section only reflect the author’s private opinion and should not be considered as guidance for trading. RoboForex LP bears no responsibility for trading results based on trading recommendations described in these analytical reviews.
With most central banks in the world “normalizing” their policy, and some moving to raise rates somewhat dramatically, the ECB is in a unique position.
While there is a lot going on, and plenty of things for ECB members to talk about, there isn’t much for them to do. So, tomorrow’s ECB policy meeting could be a non-event, in terms of an immediate reaction in the markets.
That doesn’t mean that it isn’t important. In fact, analysts will be scrutinizing the views of the different members to get a better understanding of where things could be going. Specifically, if there is reason to reassess when the ECB might start adjusting its policy.
Current estimates are that the ECB will keep its asset purchase program going well into next year. Therefore, this isn’t a major concern yet.
What is normal, anyway?
Unlike the Fed or the BOE, the ECB was already in easing mode before the covid crisis hit.
Interest rates were already negative, and there was already an asset purchase program in place. This makes the ECB a lot more similar to the BOJ compared to other large central banks.
Returning to pre-covid “normal” for the ECB then implies no rate hikes and only a reduction in quantitative easing.
That doesn’t mean that a “taper” by the ECB wouldn’t have an impact on the markets. Nonetheless, traders are facing a different reality when it comes to monetary policy on the European continent.
What should we look out for
Although not having as many problems as the UK and the US, Europe hasn’t been immune to supply and logistics issues.
Prices are creeping higher, even if they are not threatening to change monetary policy yet. Still, they have become enough of an issue for at least ECB Chief Lagarde to comment on.
The consensus among ECB policy members seems to be that inflation will be “transitory” as always. But now authorities in the US are starting to recognize that inflation isn’t transitory.
That said, this might move the consensus among central bankers to acknowledge that price constraints will be with us for at least several months. That would be more in line with the reports from major corporations both in the US and in Europe as they expect to raise prices in the coming months.
What can the ECB do?
Economic growth in Europe has remained sluggish. And the ECB has struggled for a long time to get inflation up. Even during the recovery, economic growth has been lackluster.
Generally, this would leave the ECB with a lot of room to keep not just interest rates low, but maintain quantitative easing for a long time.
So, with the expectation that ECB members will have a lot to say, the market will be attentive to see if they say anything about inflation. Then the market could move up its expectations for when the emergency asset purchase program might end, and strengthen the euro.
Otherwise, unless Lagarde says something unexpected at the post-meeting presser, the euro could find itself sliding lower as we move towards the end of the year.
Orbex is a fully licensed broker that was established in 2011. Founded with a mission to serve its traders responsibly and provides traders with access to the world’s largest and most liquid financial markets. www.orbex.com
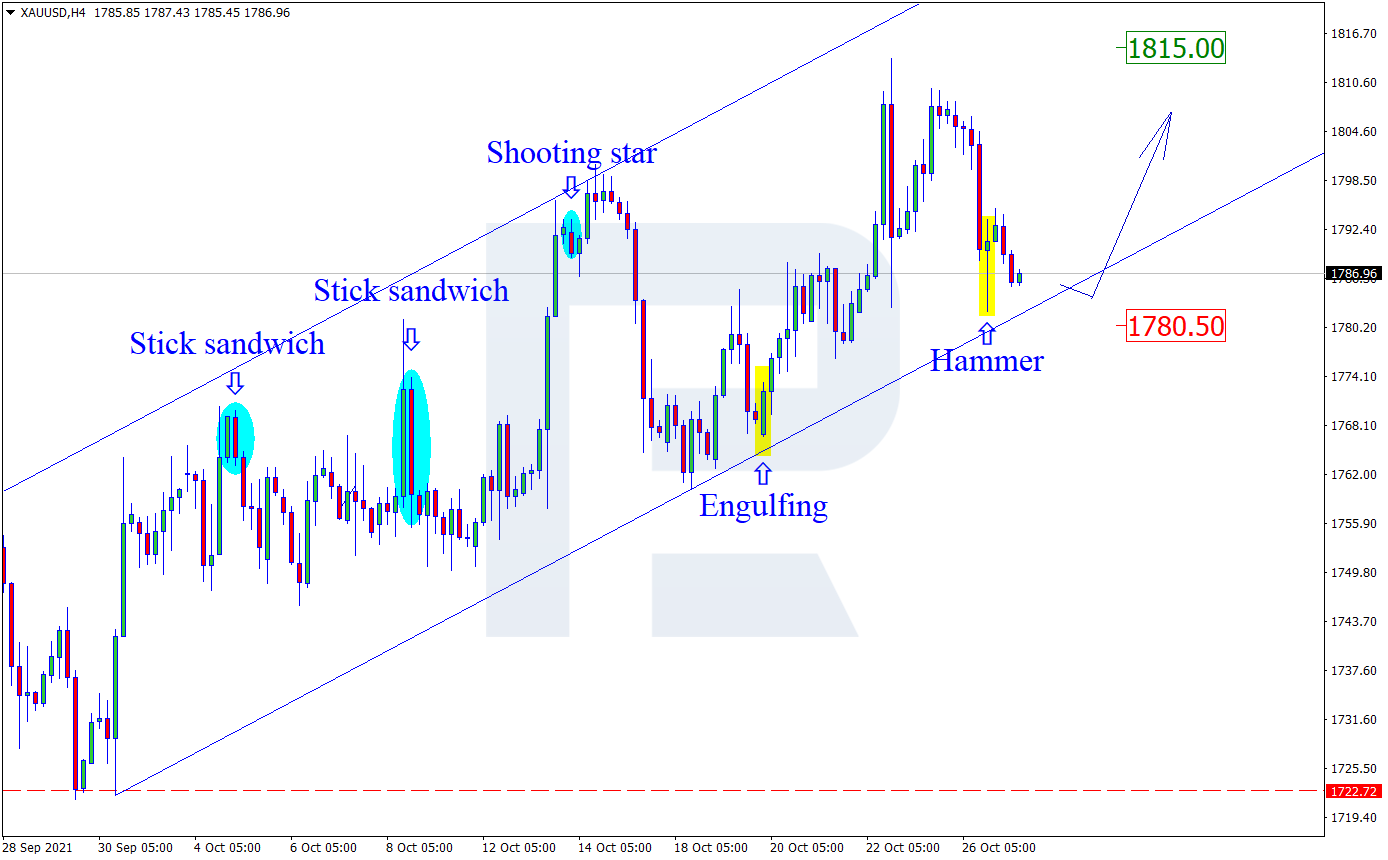
As we can see in the H4 chart, the asset is still correcting within the uptrends. After forming several reversal patterns, such as Hammer, not far from the support level, XAUUSD may reverse and form a new rising impulse. In this case, the upside target may be the resistance area at 1815.00. At the same time, an opposite scenario implies that the price may correct towards 1780.50 first and then resume trading upwards.
NZDUSD, “New Zealand vs US Dollar”
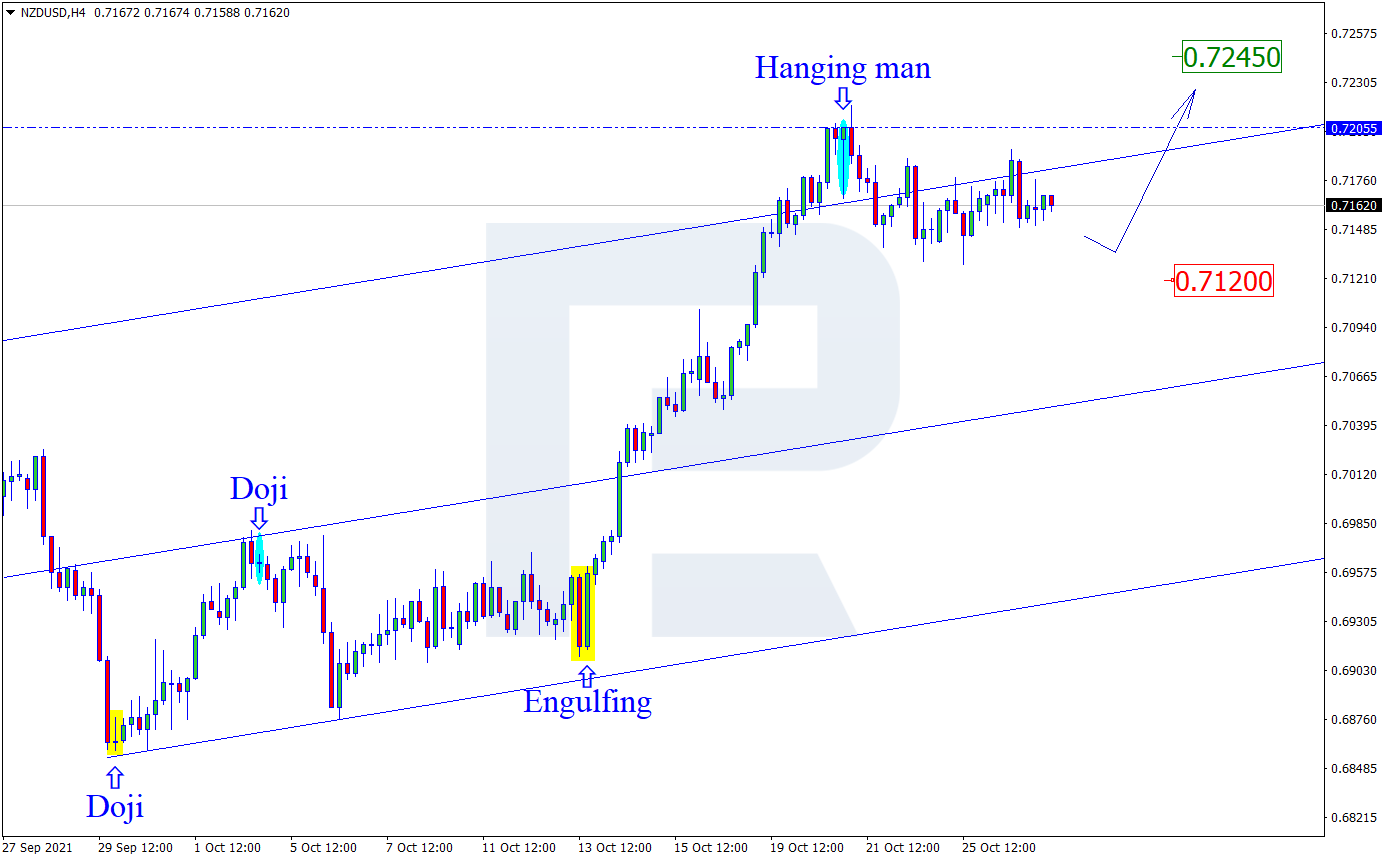
As we can see in the H4 chart, NZDUSD has formed several reversal patterns, such as Hanging Man, close to the resistance level. At the moment, the asset is reversing in the form of a new pullback. In this case, the correctional target may be the support area at 0.7120. After that, the asset may rebound from it and resume moving upwards. However, an alternative scenario implies that the price may grow to reach 0.7245 without any corrections towards the support area.
GBPUSD, “Great Britain Pound vs US Dollar”
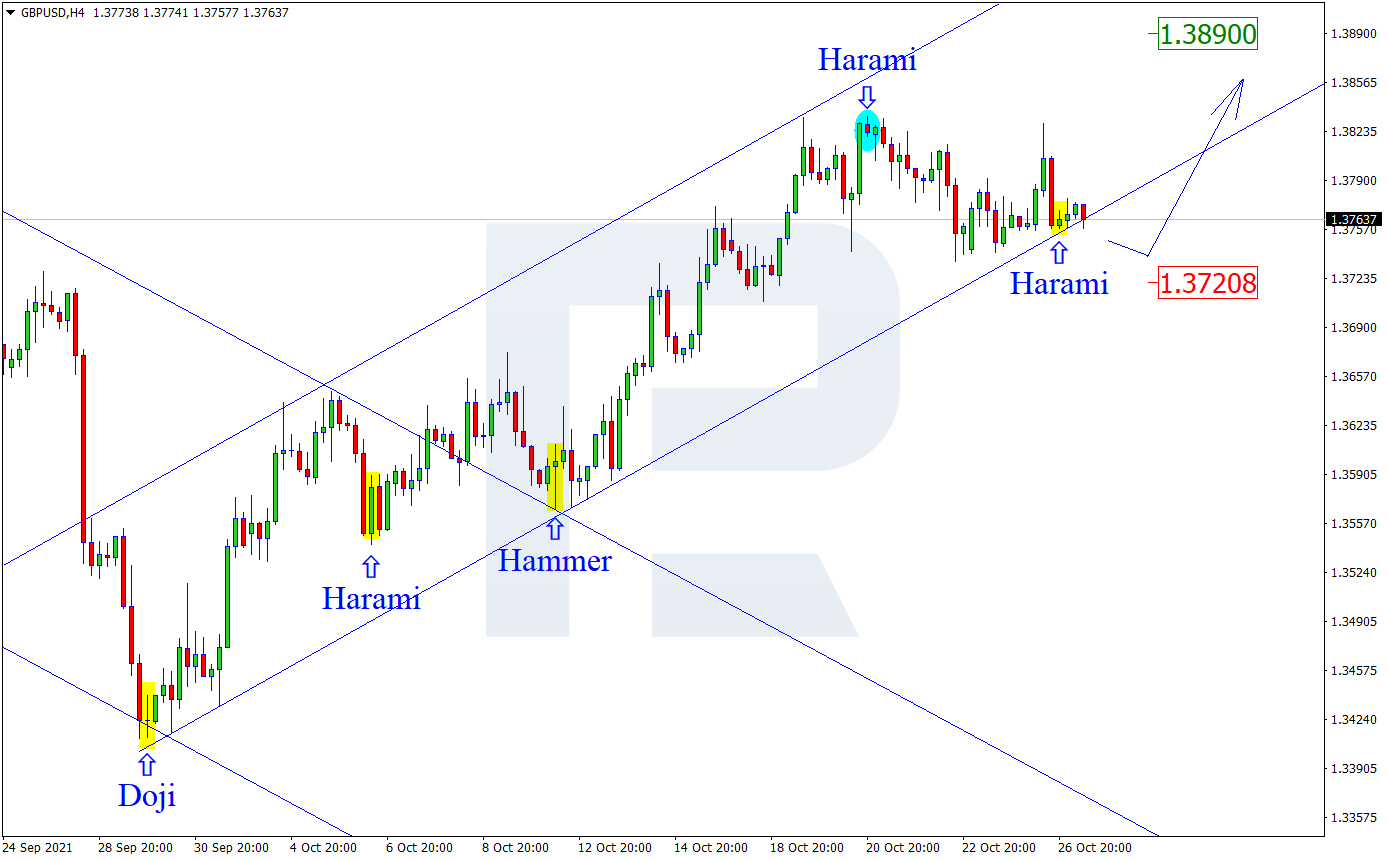
As we can see in the H4 chart, GBPUSD has formed several reversal patterns, such as Harami, not far from the support area. At the moment, the pair may reverse and resume growing. In this case, the upside target may be at 1.3890. After testing the resistance level, the market may break it and continue trading upwards. Still, there might be an alternative scenario, according to which the asset may correct towards 1.3720 before resuming the ascending tendency.
Attention! Forecasts presented in this section only reflect the author’s private opinion and should not be considered as guidance for trading. RoboForex LP bears no responsibility for trading results based on trading recommendations described in these analytical reviews.
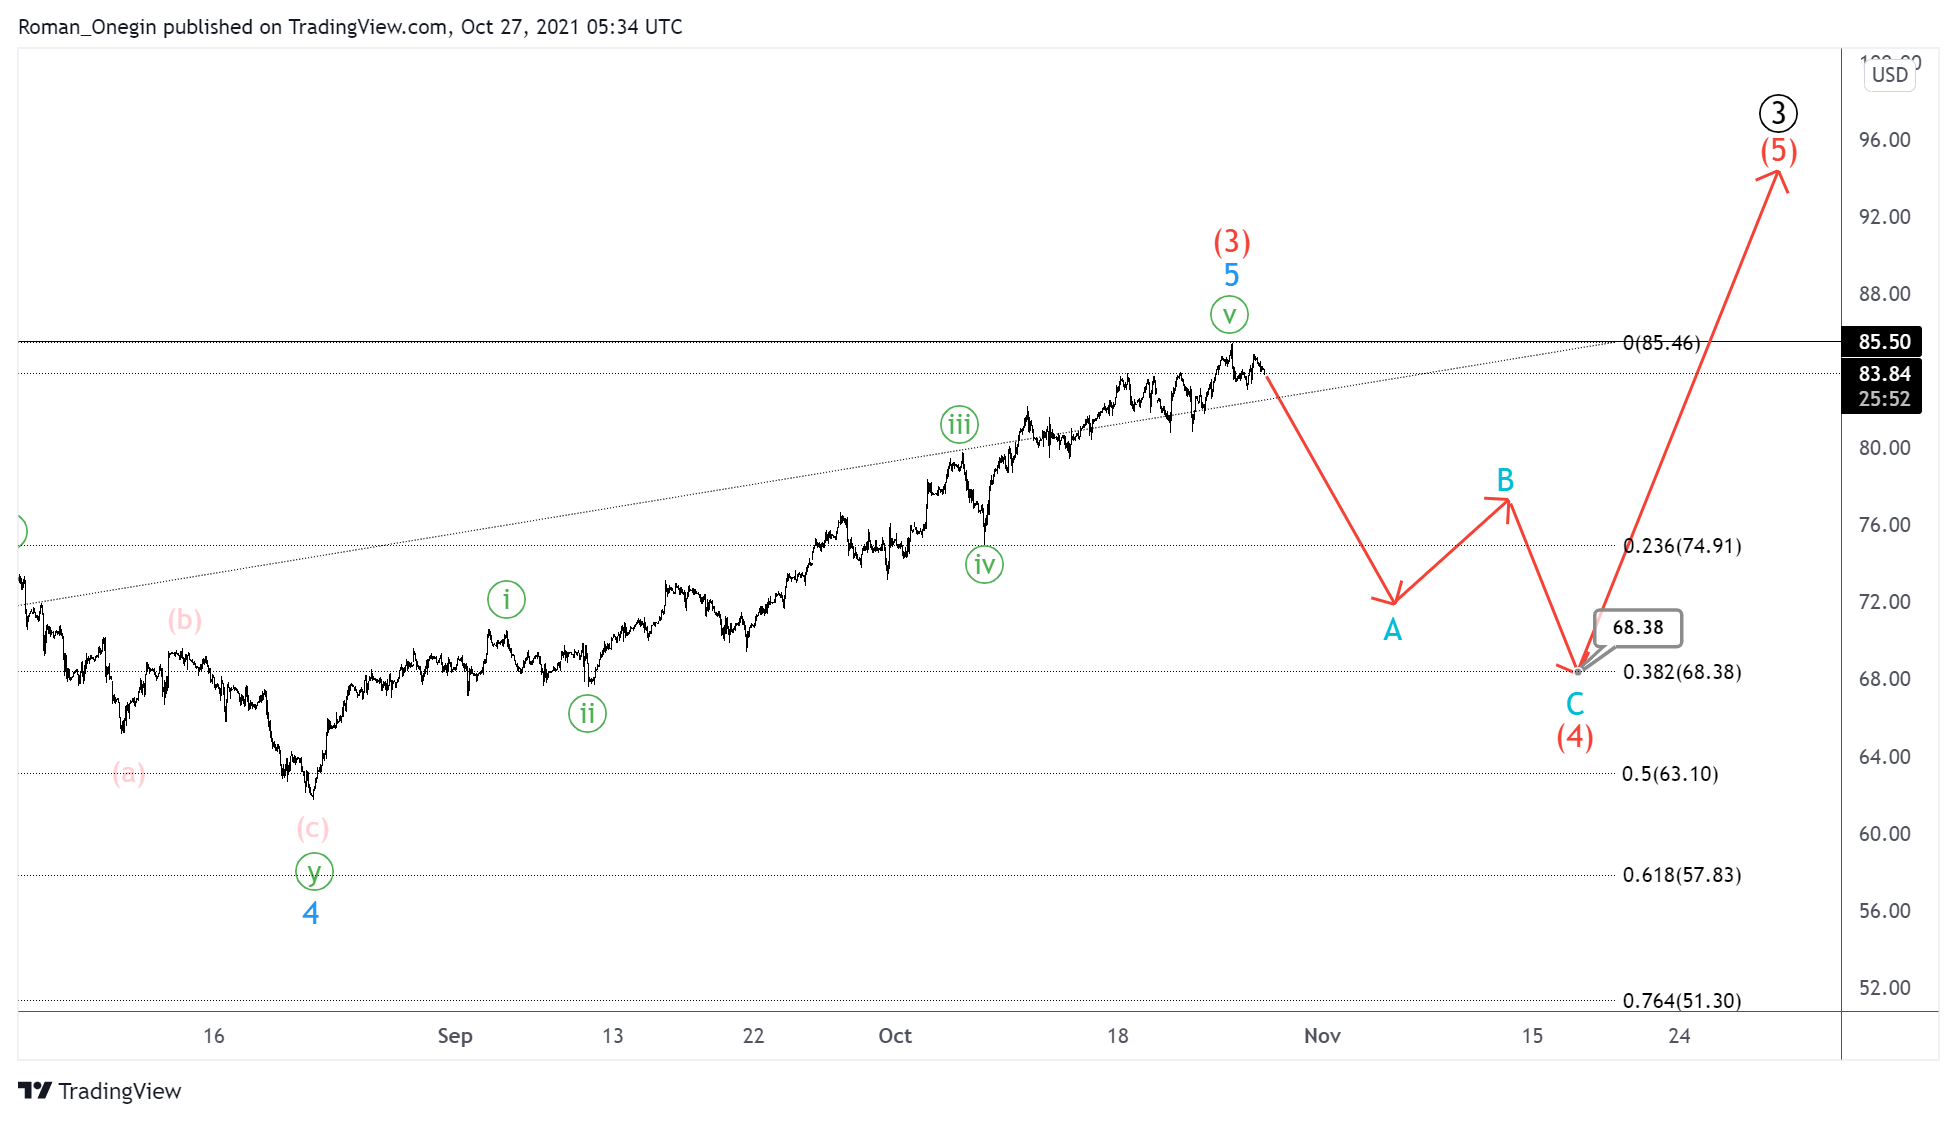
USOIL seems to be forming a global upward impulse, which includes the primary wave ③.
The current chart shows the final part of the primary third wave. This sees the end of correction wave (4) of the intermediate degree in the form of a double W-X-Y zigzag.
After the correction (4) ended, the market began to rise in the final intermediate wave (5). Then it took the form of a 5-wave impulse consisting of minor sub-waves 1-2-3-4-5, as shown on the chart.
In the near future, the price is likely to rise to the level of 97.44 in the minor sub-waves 3-4-5, where intermediate wave (5) will be at 100% of wave (3).
An alternative scenario eyes the intermediate correction wave (4), which is part of the primary third wave, and has not yet ended.
The impulse move in the intermediate wave (3) has ended.
Thus, we expect a corrective decline in the minor zigzag A-B-C to 68.38 soon. At that level, wave (4) will be at 38.2% of impulse wave (3).
Orbex is a fully licensed broker that was established in 2011. Founded with a mission to serve its traders responsibly and provides traders with access to the world’s largest and most liquid financial markets. www.orbex.com
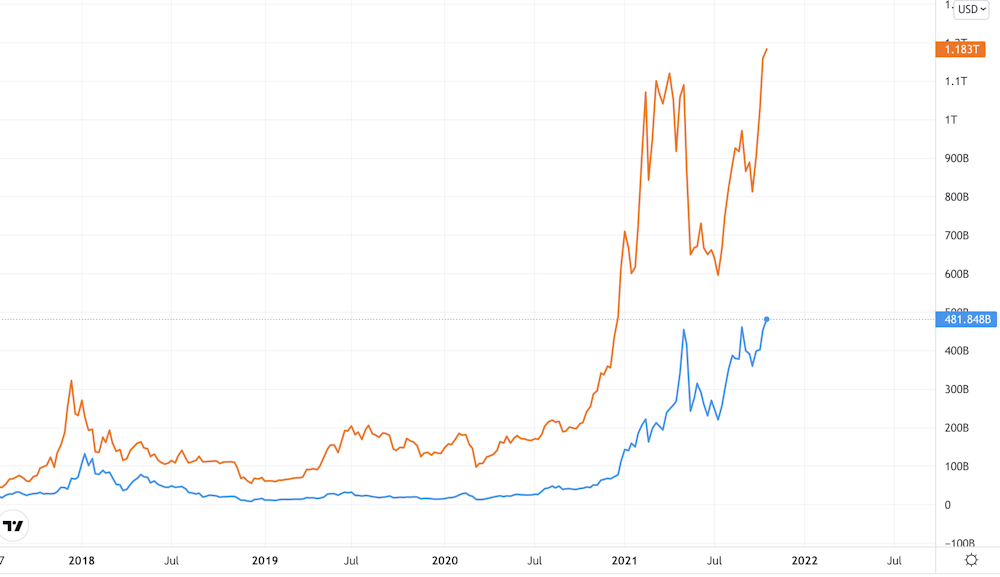
– The world’s second most valuable cryptocurrency, ether, has been touching all-time highs in price ahead of a major upgrade of its underlying platform, ethereum. Ether is currently worth in aggregate just shy of US$500 billion (£363 billion). That’s still slightly less than half that of the biggest cryptocurrency, bitcoin.
But could this upgrade, a vital step towards a much greener and faster version of the current system, put ethereum on the path to becoming the dominant platform on the internet and make ether number one?
First of all, it’s important to understand the difference between bitcoin and ethereum. Bitcoin is a system for allowing people to send value between one another without the need for banks. It is built on a technology known as blockchains, which are online ledgers whose transactions are checked and recorded by a decentralised network of computers known as validators.
These validators are incentivised for their work by receiving newly minted bitcoin as rewards, in what is known as “mining”. To make this more attractive, bitcoin is relatively scarce: only around 18 million coins are in existence and the protocol is such that there can never be more than 21 million.
Ether vs bitcoin by total value (market cap)
Key: bitcoin = orange, ether = blue. Trading View
Ether works in a similar way to bitcoin, but ethereum is different. It is a worldwide software platform with no host, on which developers are building thousands of blockchain-based applications.
At the heart of the platform is the idea of smart contracts, which are automated agreements that ensure that money and assets change hands when certain conditions have been fulfilled. All transactions on the platform ultimately use ether, and the success of the platform is why ether has been the second-largest cryptocurrency after bitcoin for the past few years. The fact that ether fuels the platform – even being referred to as gas fees – gives it a utility and an intrinsic value that bitcoin does not have.
Why ethereum 2.0
Ethereum has several major problems, however. The first is that gas fees have become very expensive in the last couple of years because the network has become so popular and is therefore very congested.
Validators prioritise users who are willing to pay the highest fees for their transactions. For example, the average transaction at the time of writing on crypto exchange Uniswap costs around US$44 in gas fees.
Bitcoin has comparable issues with congestion, which its developers are trying to solve by building applications like Lightning on top which boast faster transaction speeds.
The second problem for ethereum is that, as it has become more popular, the amount of computational power used by validators has rocketed. It’s the same problem that has brought a lot of negative publicity to bitcoin, because it uses a lot of electricity.
Bitcoin is currently using as much power as the whole of the Philippines, although its supporters argue that much of this is power that would otherwise be wasted – for example, oil rigs burning off natural gas because it’s not profitable to sell it. Proponents also point out that the network is shifting towards using much more renewable power over time.
At any rate, the eventual creation of an ethereum 2.0 will solve these problems by moving the platform’s system of validation from “proof of work” to “proof of stake”. Without getting into too many details, proof of work is a protocol in which validators all attempt to solve complex equations to prove that each proposed transaction is valid. With proof of stake, there’s no need for all validators to do this power-hungry work, because the system chooses one at random to confirm each transaction.
Many in the bitcoin community are against proof of stake because it gives the most power to the biggest validators, potentially allowing them to corrupt the system of validation if they can get control of more than half of the network. Ethereum supporters counter that proof of stake has checks and balances built in that would prevent this from happening.
Either way, ethereum 2.0 promises to reduce the platform’s power consumption by 99.9%, making it far more sustainable. It should also solve the problem with gas fees by raising the platform’s processing ability from 30 transactions a second to potentially 100,000, as well as making possible more sophisticated smart contracts than before.
How it’s going
The transition to ethereum 2.0 has been a slow one, riddled with technical issues that have dragged on for over two years. For the past few months, the new proof-of-stake blockchain has been running in a test format in parallel with the existing system, allowing the developers to prepare it for a merger in 2022.
The forthcoming upgrade is essentially a warm up for this merger. Known as Altair, it introduces numerous technical changes that are designed to keep validators honest and make the system more decentralised. Assuming this goes ahead as planned, all eyes will be on the merger, and then later another change known as “sharding” which will greatly increase the system’s processing capability.
Certainly the price of ether has been strong ahead of the Altair upgrade. The recent surge in bitcoin to all-time highs has been helping to lift the entire crypto market. But some of the price movement in ether probably reflects people betting that the upgrade will succeed, while the rest is from speculators switching from bitcoin, and new money moving into the space.
Ether vs the ‘eth killers’ by total value
SOL = solana (green), DOT = polkadot (yellow), ADA = cardano (orange). Trading View
In the run-up to the merger of ethereum’s two blockchains, it will be interesting to see how all this affects ether’s price in relation to the so-called “eth killers”. These are rival platforms like cardano and solana that have been very popular in recent months partly due to ethereum’s problems with fees.
But ultimately the question is what it will mean for bitcoin. Bitcoiners will continue to argue that their protocol is more decentralised than proof of stake, and they have the advantage of being the crypto brand that investors are most comfortable risking their money with.
The question is whether these advantages are outweighed by ethereum 2.0’s greener credentials and the fact that it can handle more transactions. Bitcoin is currently worth about double ether, but talk comes and goes about a “flippening” where ether overtakes it. Could it happen in 2022? With bitcoin’s hegemony at stake, it will be fascinating to find out.
A bullish MA cross on the daily chart indicates an acceleration in the upward movement. Pullbacks are likely to attract a ‘buy the dips’ crowd.
The pair has been consolidating its recent gains above 0.7450, a former major resistance that has turned into support. A close above 0.7545 may extend the rally to last July’s high at 0.7610.
On the downside, a deeper retracement would test the demand area between 0.7380 and the psychological level of 0.7400.
USDNOK maintains bearish trend
The Norwegian krone keeps the high ground supported by continued strength in oil prices.
Sentiment has remained downbeat after a break below the daily support at 8.4700. Rebounds have so far been checked by solid selling interest.
The current sideways action under 8.4100 could be another phase of distribution. Then the bears would be pushing towards June’s low at 8.2400, the last support before reaching this year’s low at 8.1500.
8.4800 near the 20-day moving average would be the second resistance in case of a bullish attempt.
UK 100 resumes rally
The FTSE 100 breaks higher as confidence grew after fresh highs on Wall Street. The rally above August’s high at 7220 is an indication of a strong commitment from the long side.
Breakout candles and a bullish MA cross confirm that the uptrend has resumed. The index is now on its way to the pre-pandemic level around 7550.
7350 would be an intermediate hurdle as an overbought RSI may trigger some profit-taking. 7220 has become fresh support if the bulls need to catch their breath.
Orbex is a fully licensed broker that was established in 2011. Founded with a mission to serve its traders responsibly and provides traders with access to the world’s largest and most liquid financial markets. www.orbex.com
– In part one of this article, we discussed how the recent decline in Zillow, Redfin, and Opendoor share prices could reflect a concern that the risks involved in holding large home inventories while attempting to “flip houses” could present for these Real Estate firms. The recent 50% price drop in the share price levels should send a fairly strong warning to investors that these “flipping” processes contain a moderate degree of underlying risk and extended costs in a super-heated, and potentially peaking Real Estate trend.
It has been reported that Zillow increased the purchase of homes for their Ibuyer program, from 86 homes in Q2:2020 to 808 homes in Q3:2020, to 3805 homes in Q2:2021. We’ll learn more about their Q3:2021 home buying efforts when Zillow announces earnings soon (source: Zillow)
It has also been reported that Zillow sold more than $1 billion in bonds to investors to fund this operation that includes using their Zestimate algorithm to buy homes quickly, renovate/flip them, and put them back on the market. The super-heated Real Estate market has driven these firms into speculative trading of houses in an open, and often hostile, market environment. Taking a bigger leap is Opendoor, which purchased 8,494 homes in Q2:2021. This is a massive inventory of homes that may require many months or years to renovate/sell.
Is This Trend A Buying Opportunity For Zillow, Redfin, and Opendoor – or a Warning?
Recent data from the National Association of Realtors (Source: National Association of Realtors) shows the median single-family home price in the US rose nearly 40% from the average 2018 price level. That means we’ve seen home prices skyrocket nearly 40% higher in less than three years. The Affordability Index for homes has fallen -19.43% – reaching near to the lowest level since 2018.
Interest rates rising as inflation trends continue to push the US Fed into action, the Affordability Index is almost certain to continue to fall as “flippers” are continually attempting to push home prices higher and higher. The mechanics of this process, buying and flipping, requires a strong demand for housing while price levels continue to allow for support increases. Once that dynamic breaks down, the risk of owning/flipping homes in an unfavorable market environment increases dramatically.
My research suggests the current price levels reflected in IYR, the Real Estate ETF, are already pushing into the Moderate/Extreme Topping range. This suggests that historical price relationships related to continued price advances in the Real Estate sector may be nearing a peak.
Considering the recent rise in Interest Rates as well as the incredible rise in median home prices over the past 3+ years, should the US Fed take any action to raise interest rates by even a small amount, 0.25% to 0.50%, the Housing Affordability Index could collapse to levels below 125 fairly quickly – pushing prices down as the cost of borrowing increases.
IYR Peaks Near $112 – Will Real Estate Attempt Another Move Higher?
This Daily IYR chart highlights the recent peak near $112 which was set up in early September 2021. Given the downward rotation in Zillow, Redfin, and Opendoor, I suspect this peak in IYR may be a very clear exhaustion peak in price after an incredible run for US Real Estate and the Real Estate Sector.
The current data is showing weaker affordability levels while prices have risen nearly 30% over the past three years. In my opinion, any increase in interest rates by the US Fed may push the delicate housing market over the edge. The US Federal Reserve wants to keep the US markets rallying like this as long as possible, but the eventual contraction phase in the markets is likely going to start when the US Federal Reserve starts raising interest rates to help fight inflation.
The data I have presented in this article suggests companies like Zillow, Redfin, Opendoor, and other’s that are “flipping” real estate right now are engaged in very risky behavior as affordability levels have reached multi-year lows (indicating very poor affordability levels) and as the US Fed is actively discussing raising interest rates soon. The idea of holding high-priced home inventory while attempting to renovate and flip these assets for higher sales prices over the next 6 to 12+ months seems fraught with risks.
In my opinion, the only thing that could change the dynamics of this fragile market environment is if interest rates decreased to support more affordability or if home prices drop by more than 15% to support greater affordability.
There is a shift taking place in the Real Estate market. The declining price levels in Zillow, Redfin, Opendoor, and IYR are suggesting that traders perceive greater risks associated with future profits/earnings related to the economic dynamics at play. Affordability, price levels, the US Federal Reserve, and consumer sentiment are all at play right now as we head into Christmas 2021.
The March 2020 COVID event created a boost in affordability as interest rates fell from over 4% to levels near 2.75%. This pushed home price affordability up to 187.8 (very affordable). Currently, that dynamic has ended and rising interest rates after a nearly 30% increase in home price levels make for a very fragile real estate market environment. We need to see how the US Fed reacts over the next few months and how consumers react to market dynamics throughout this Christmas season.
The warning signs are there if you look hard enough. But the US Federal Reserve wants this party to continue for as long as possible. I don’t see interest rates falling much further below 2.75% and the only answer then becomes a decrease in-home price levels. It will be interesting to see how this plays out.
Over the next 12 to 24+ months, I expect very large price swings in the US stock market and other asset classes across the globe. I believe the markets are starting to transition away from the continued central bank support rally phase and may start a revaluation phase as global traders attempt to identify the next big trends. Precious Metals will likely start to act as a proper hedge as caution and concern start to drive traders/investors into Metals.
Please take a minute to visit www.TheTechnicalTraders.com to learn about our Total ETF Portfolio (TEP) technology and it can help you identify and trade better sector setups. We’ve built this technology to help us identify the strongest and best trade setups in any market sector. Every day, we deliver these setups to our subscribers along with the TEP system trades. You owe it to yourself to see how simple it is to trade 30% to 40% of the time to generate incredible results.
In this week’s trader tip, Chris went over the Copper Minors which had a very strong run last year and starting to put in some increased volatility. Increased volatility means we are seeing bigger price actions, big rallies followed by big pulled backs.
Subscribers to any service at The Technical Traders: Please let us know via a member ticket what you would like to learn about and we will do our best to make sure this happens.
Non-subscribers: Please enjoy these micro-lessons as a way to further your education and understanding of how a technical trader…well…trades!
CLICK ON THE IMAGE BELOW TO WATCH THE VIDEO
TO EXPLORE THE DIFFERENT TRADING STRATEGIES CHRIS OFFERS, PLEASE VISIT US AT THE TECHNICAL TRADERS. YOU’VE GOT MORE TO GAIN THAN TO LOSE WHEN SEEKING INFORMATION!
One of the world’s largest independent financial advisory, asset management and fintech organizations has doubled its commitment on positioning assets under advisement into environmental, social and governance (ESG) investments.
At the beginning of the year, deVere Group, which operates in more than 100 countries globally, said it would aim to have $1bn in socially responsible investment vehicles within five years.
The game-changing financial powerhouse now says its target is “$2bn or more” within the same time frame.
deVere’s dramatic doubling of its pledge comes as world leaders, industry chiefs and experts head to Glasgow this weekend for the start of COP26, an event seen as a critical turning point in the struggle to avert the worst effects of climate change.
CEO and founder of deVere, Nigel Green, says: “Climate change – and the major, far-reaching fallout of it for economies and communities around the world – is the greatest risk multiplier. There’s no question that it is the defining issue of our time.
“In the 2020 annual risk report from the World Economic Forum (WEF), the top five risks in terms of probability were environmental, and the top four of five risks in terms of impact were both social and environmental in nature.
“Our climate is changing at a quicker rate than previously predicted. We’re already noticing the impacts of human-created global warming.”
He continues: “As a society, we have a small window of opportunity to slam on the brakes to save our planet.
“But this takes determination, honesty and resources. It requires unprecedented levels of investment, which is why deVere is now aiming to position $2bn into ESG investments within five years.”
The deVere CEO and founder says the new target is achievable as investors, keen to get ahead of the curve “as well as earn profits with purpose”, are receptive to the opportunities as the world scrabbles to mitigate the environmental, economic and social fallout of the current situation – “a situation which is likely to be a constant risk.”
In addition, the latest research “underscores that the majority of environmental, social and governance investments are continuing to outperform their non-sustainable counterparts and have lower volatility.”
As well as its $2bn commitment, deVere is one of 18 founding signatories of the UN-backed Net Zero initiative, the international alliance of powerhouse global finance companies that will help accelerate the transition to a net zero financial system.
Its membership means it is committed to “aligning all relevant products and services to achieve net zero greenhouse gases by 2050 and to set meaningful interim targets for 2025.”
The organization has also confirmed that it “aims to significantly speed-up its own meeting of these Science Based Targets to reduce operational emissions in line with limiting global temperature rises to 1.5 degrees Centigrade.”
UK Prime Minister, Boris Johnson, has said: “Uniting the world’s banks and financial institutions behind the global transition to net zero is crucial to unlocking the finance we need to get there – from backing pioneering firms and new technologies to building resilient economies around the world.
Mr Green concludes: “The clock is ticking and after decades of inaction our planet hasn’t got the luxury of time.
“We all need to be taking more action and at a quicker pace.”
About:
deVere Group is one of the world’s largest independent advisors of specialist global financial solutions to international, local mass affluent, and high-net-worth clients. It has a network of more than 70 offices across the world, over 80,000 clients and $12bn under advisement.
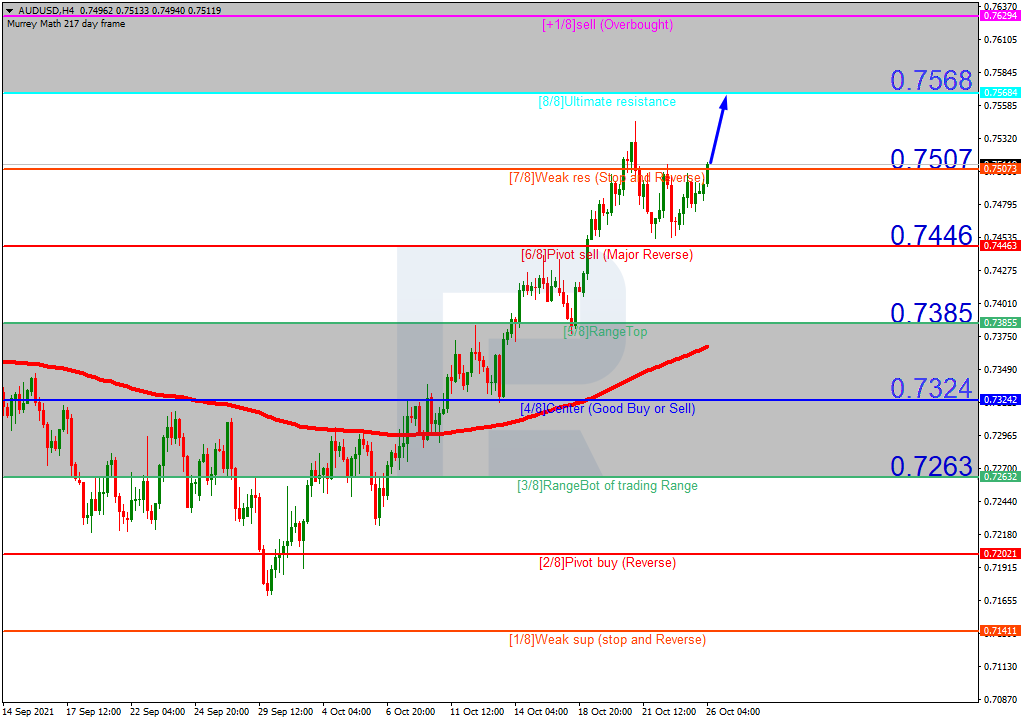
In the H4 chart, AUDUSD is trading above the 200-day Moving Average, thus indicating an ascending tendency. In this case, the price is expected to continue moving upwards to reach the resistance at 8/8. However, this scenario may no longer be valid if the price breaks 6/8 to the downside. After that, the instrument may reverse and fall towards the support at 5/8.
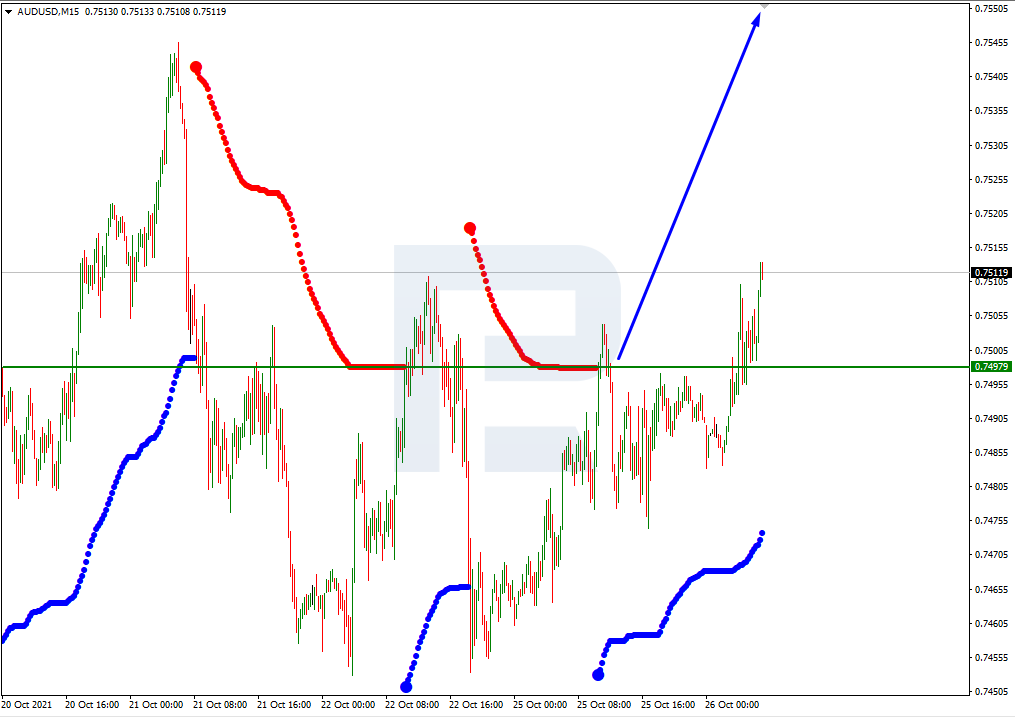
As we can see in the M15 chart, the pair has broken the upside line of the VoltyChannel indicator and, as a result, may continue trading upwards.
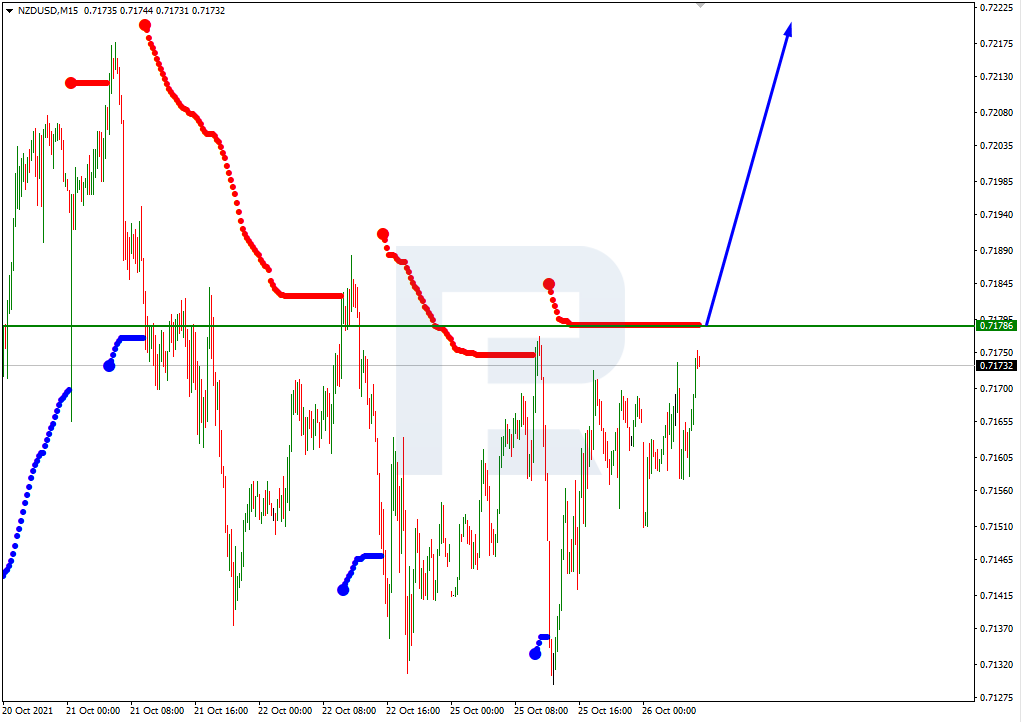
NZDUSD, “New Zealand Dollar vs US Dollar”
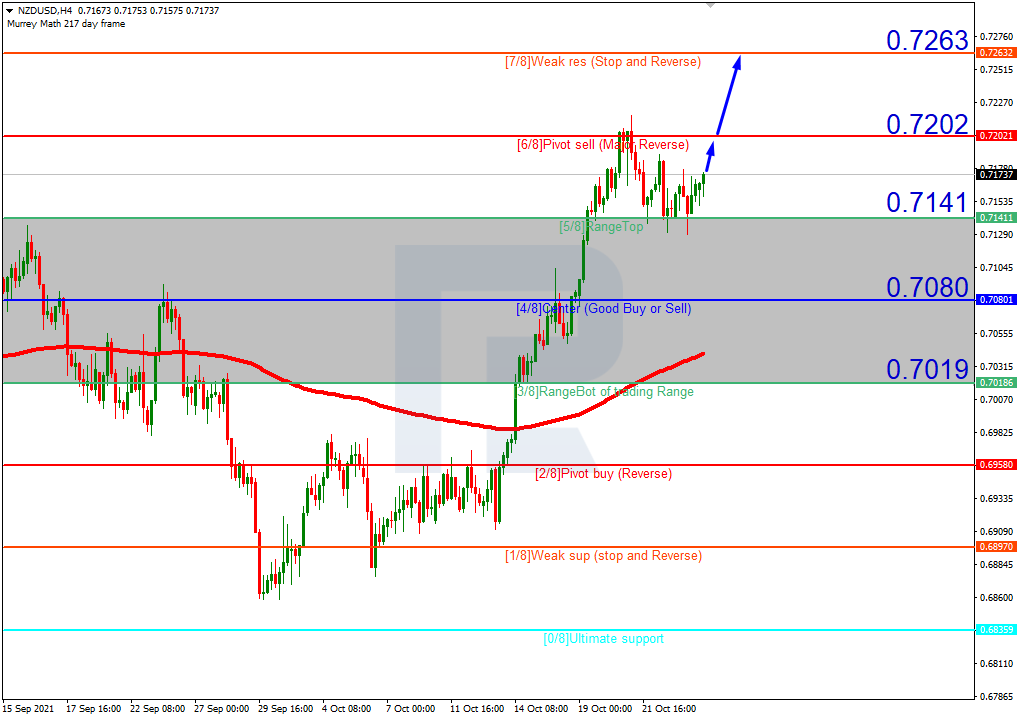
As we can see in the H4 chart, NZDUSD is trading above the 200-day Moving Average, thus indicating an ascending tendency. In this case, the price is expected to test 6/8, break it, and continue growing to reach the resistance at 7/8. However, this scenario may no longer be valid if the price breaks 5/8 to the downside. In this case, the instrument may correct towards the support at 4/8.
In the M15 chart, the pair may break the upside line of the VoltyChannel indicator and, as a result, continue its growth.
Attention! Forecasts presented in this section only reflect the author’s private opinion and should not be considered as guidance for trading. RoboForex LP bears no responsibility for trading results based on trading recommendations described in these analytical reviews.