Intraday Market Analysis – USD Gains Momentum Again

By Orbex

EURUSD struggles to rebound

EURUSD

The US dollar bounces across the board as the Fed may possibly raise interest rates on Wednesday. The pair found support near May 2020’s lows around 1.0800.

The RSI’s oversold condition on the daily chart prompted the bears to take some chips off the table, alleviating the pressure. 1.1110 is a fresh resistance and its breach could lift offers to 1.1270.

In fact, this could turn sentiment around in the short term. Failing that, a break below 1.0830 could trigger a new round of sell-off towards March 2020’s lows near 1.0650.

AUDUSD lacks support

AUDUSD

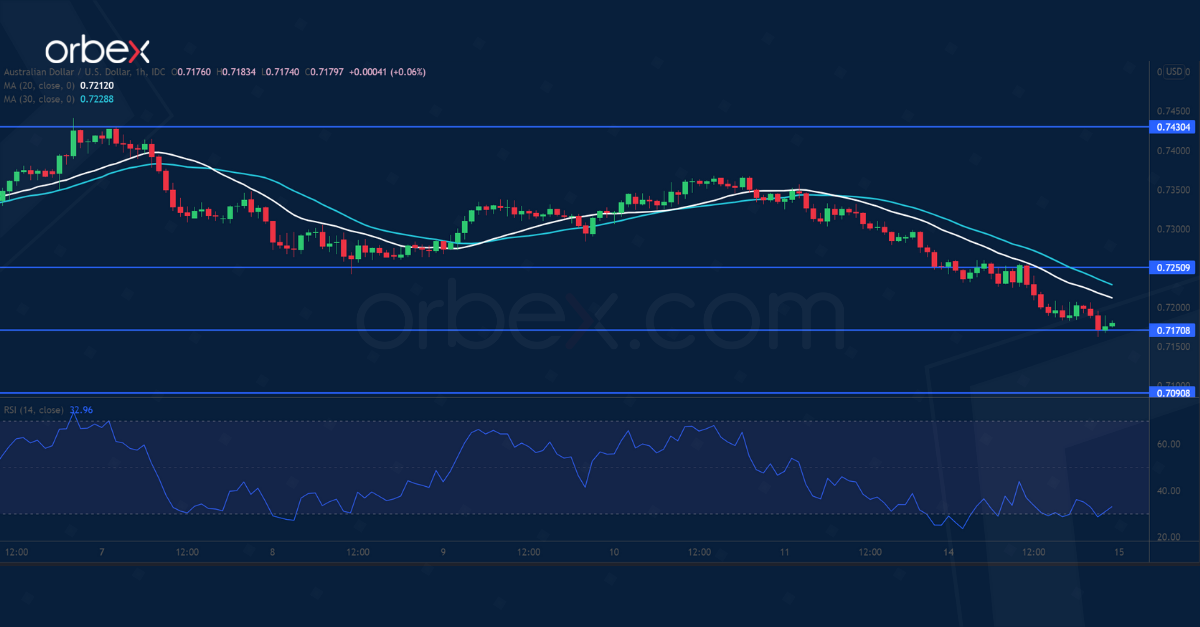
The Australian dollar slipped after dovish RBA minutes. The pair continues to pull back from its recent top at 0.7430.

A drop below the demand zone at 0.7250 further puts the bulls on the defensive. The former support has turned into a resistance level. 0.7170 at the origin of a previous breakout is key support.

An oversold RSI may raise buyers’ interest in this congestion area. A deeper correction could invalidate the recent rebound and send the Aussie to the daily support at 0.7090.

GER 40 attempts to rebound

DE40

The Dax 40 edges higher as Russia and Ukraine hold a fourth round of talks. The index bounced off the demand zone (12500) from the daily chart, a sign that price action could be stabilizing.

The supply zone around the psychological level of 14000 sits next to the 20-day moving average, making it an important hurdle. A tentative breakout may have prompted sellers to cover.

14900 would be the target if the rebound gains momentum. On the downside, 13300 is fresh support, and 12720 is the second line of defense.


Orbex-LogoArticle by Orbex

Orbex is a fully licensed broker that was established in 2011. Founded with a mission to serve its traders responsibly and provides traders with access to the world’s largest and most liquid financial markets. www.orbex.com

Japanese Candlesticks Analysis 15.03.2022 (EURUSD, USDJPY, EURGBP)

Article By RoboForex.com

EURUSD, “Euro vs US Dollar”

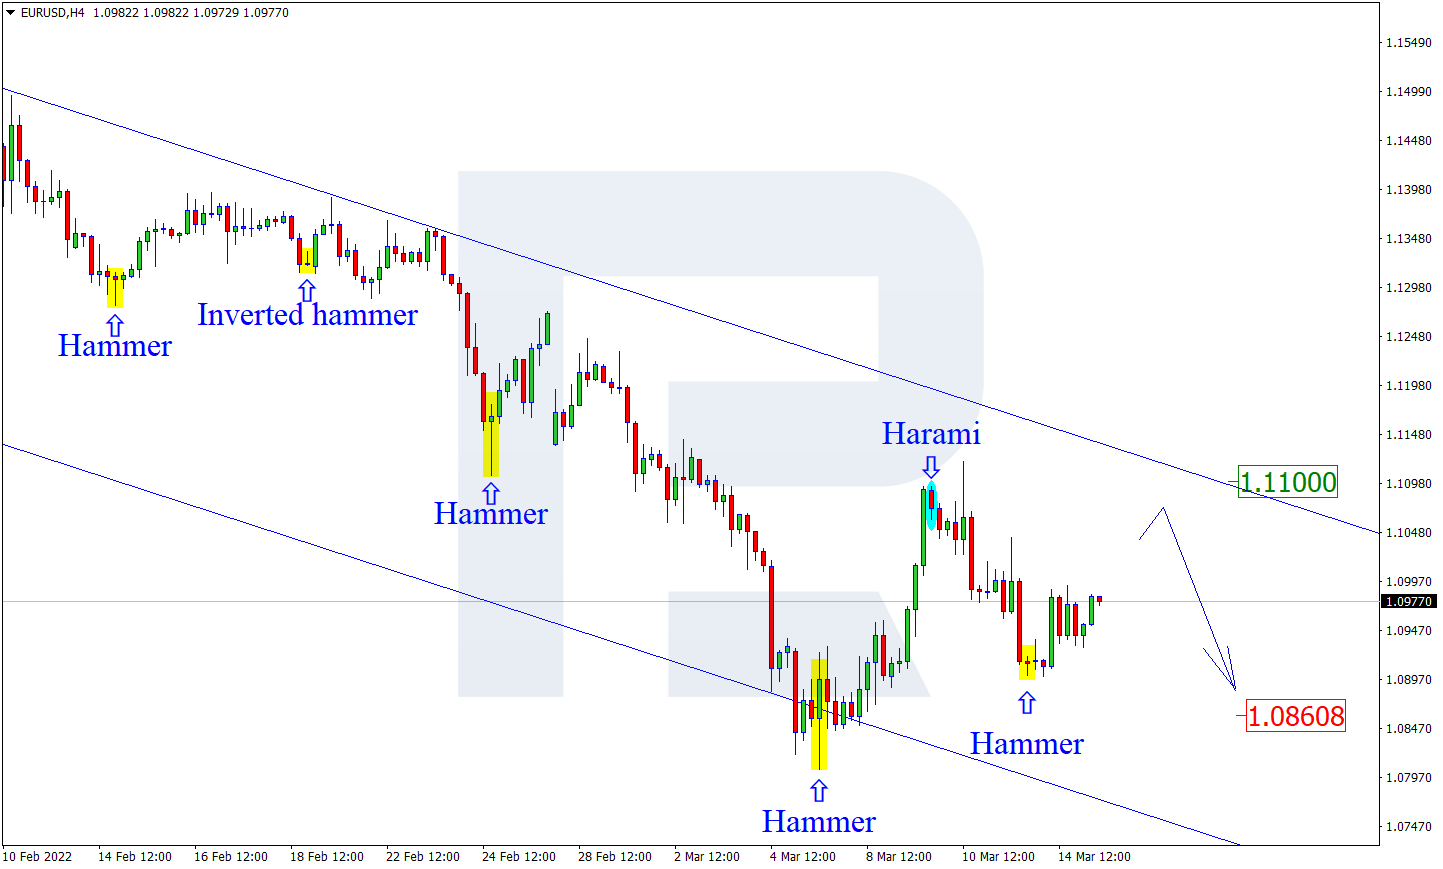
As we can see in the H4 chart, the asset has formed a Hammer reversal pattern close to the support level. At the moment, EURUSD is reversing and may form a new correctional impulse. In this case, the upside correctional target may be at 1.1100. However, an alternative scenario implies that the price may continue falling to reach 1.0860 without any corrections towards the resistance area.

EURUSD
Risk Warning: the result of previous trading operations do not guarantee the same results in the future

USDJPY, “US Dollar vs Japanese Yen”

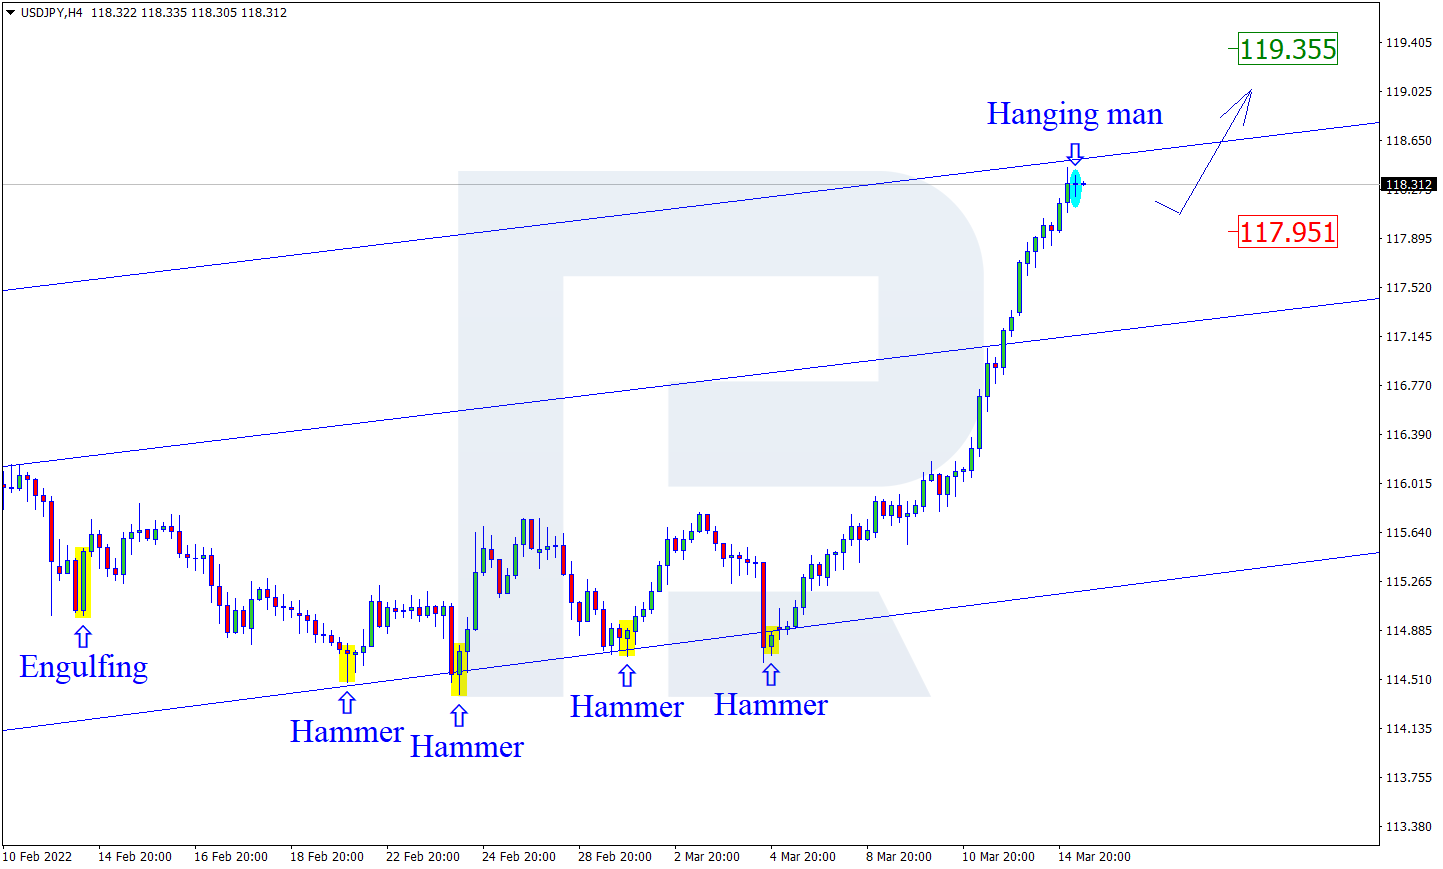
As we can see in the H4 chart, USDJPY has formed a Hanging Man reversal pattern not far from the resistance level. At the moment, the asset is reversing and may start a new pullback towards the support area. In this case, the downside correctional target may be at 117.95. At the same time, an opposite scenario implies that the price may grow to reach 119.35 and continue the uptrend without any corrections towards the support area.

USDJPY
Risk Warning: the result of previous trading operations do not guarantee the same results in the future

EURGBP, “Euro vs Great Britain Pound”

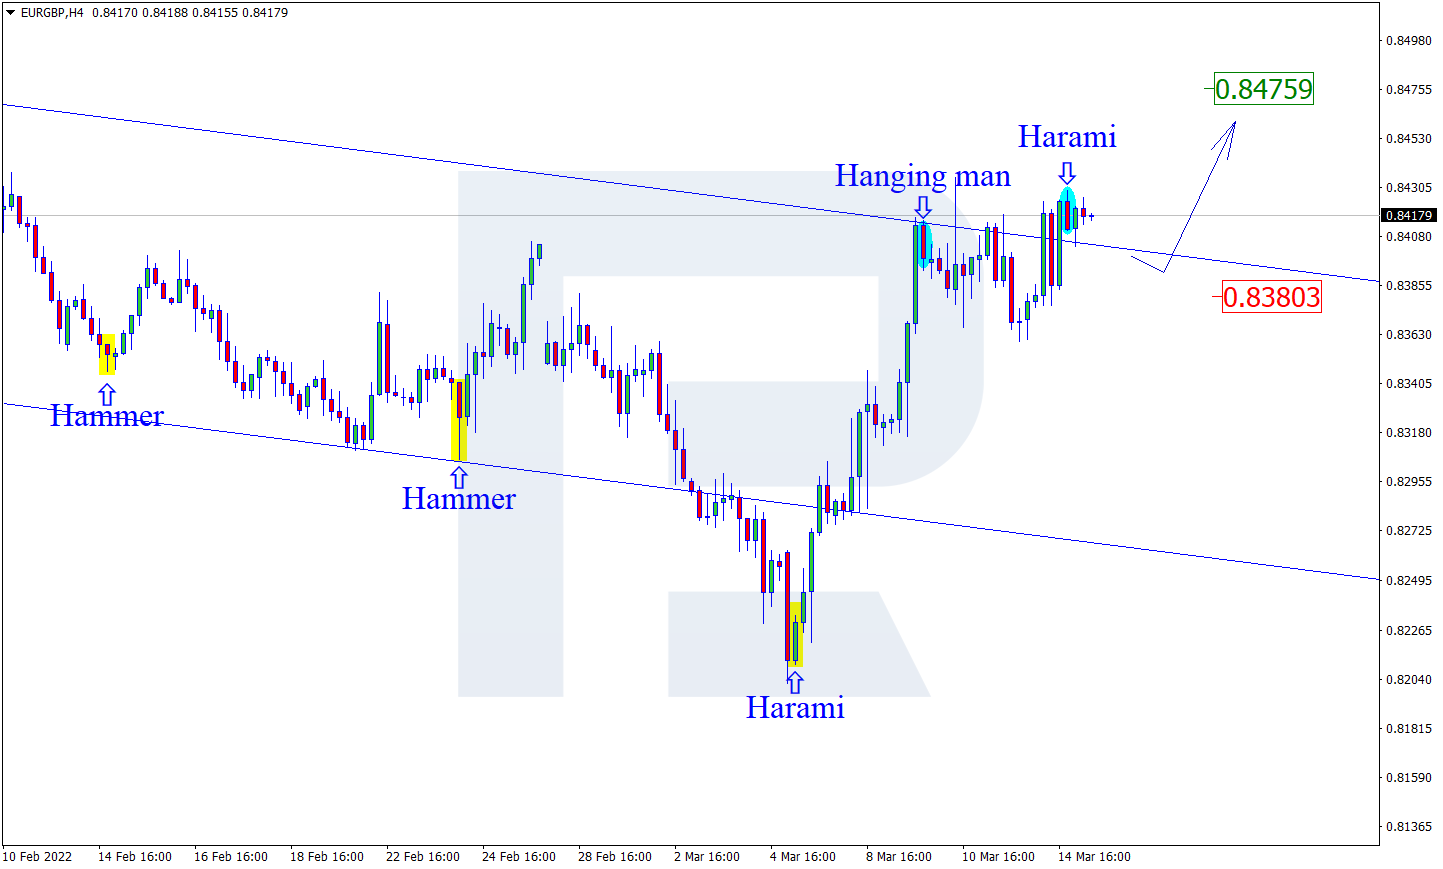
As we can see in the H4 chart, after forming a Harami reversal pattern near the resistance area, EURGBP is reversing and may start another descending wave. In this case, the downside target may be at 0.8380. Later, the market may test the support level, rebound from it, and resume the ascending tendency. Still, there might be an alternative scenario, according to which the asset may grow to reach 0.8475 without any corrections.

EURGBP

Article By RoboForex.com

Attention!
Forecasts presented in this section only reflect the author’s private opinion and should not be considered as guidance for trading. RoboForex LP bears no responsibility for trading results based on trading recommendations described in these analytical reviews.

Murrey Math Lines 15.03.2022 (AUDUSD, NZDUSD)

Article By RoboForex.com

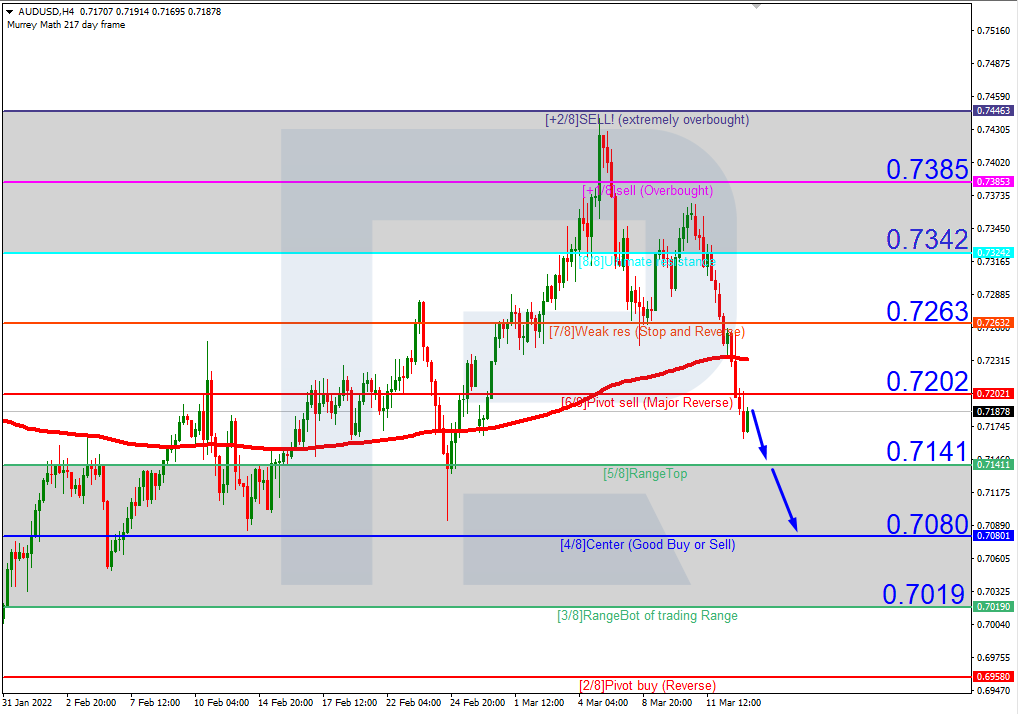
AUDUSD, “Australian Dollar vs US Dollar”

In the H4 chart, after breaking the 200-day Moving Average, AUDUSD is trading below it, thus indicating a possible descending tendency. In this case, the price is expected to test 5/8, break it, and then continue falling to reach the support at 4/8. However, this scenario may no longer be valid if the price breaks the 6/8 to the upside. After that, the instrument may reverse and grow towards the resistance at 7/8.

AUDUSDH4
Risk Warning: the result of previous trading operations do not guarantee the same results in the future

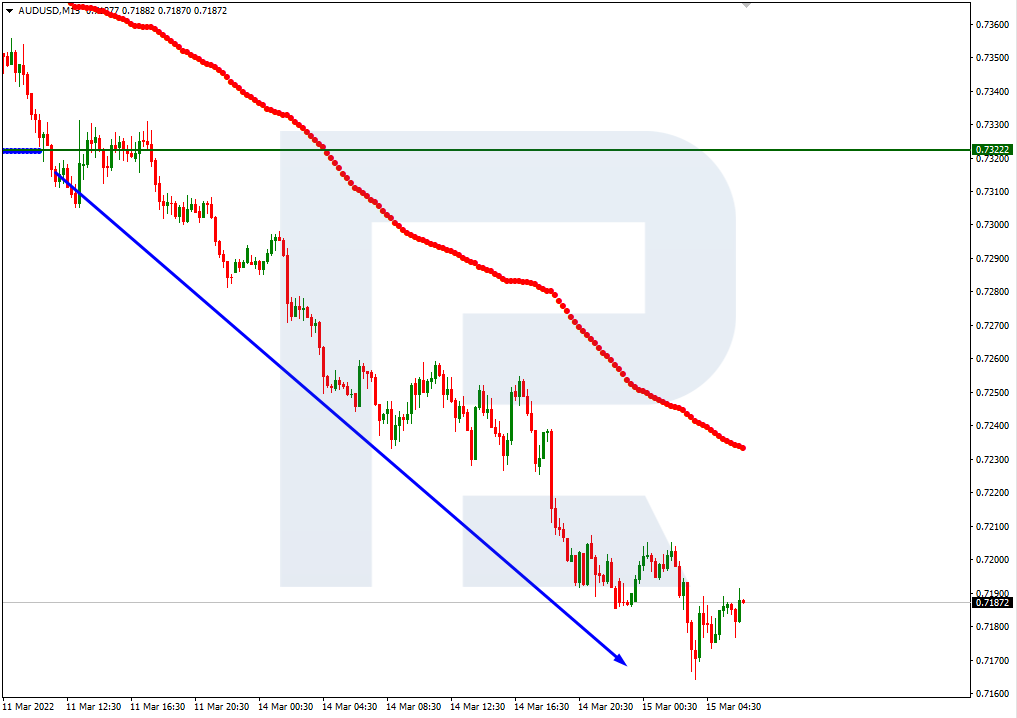
As we can see in the M15 chart, the pair has broken the downside line of the VoltyChannel indicator and, as a result, may continue trading downwards.

AUDUSD_M15
Risk Warning: the result of previous trading operations do not guarantee the same results in the future

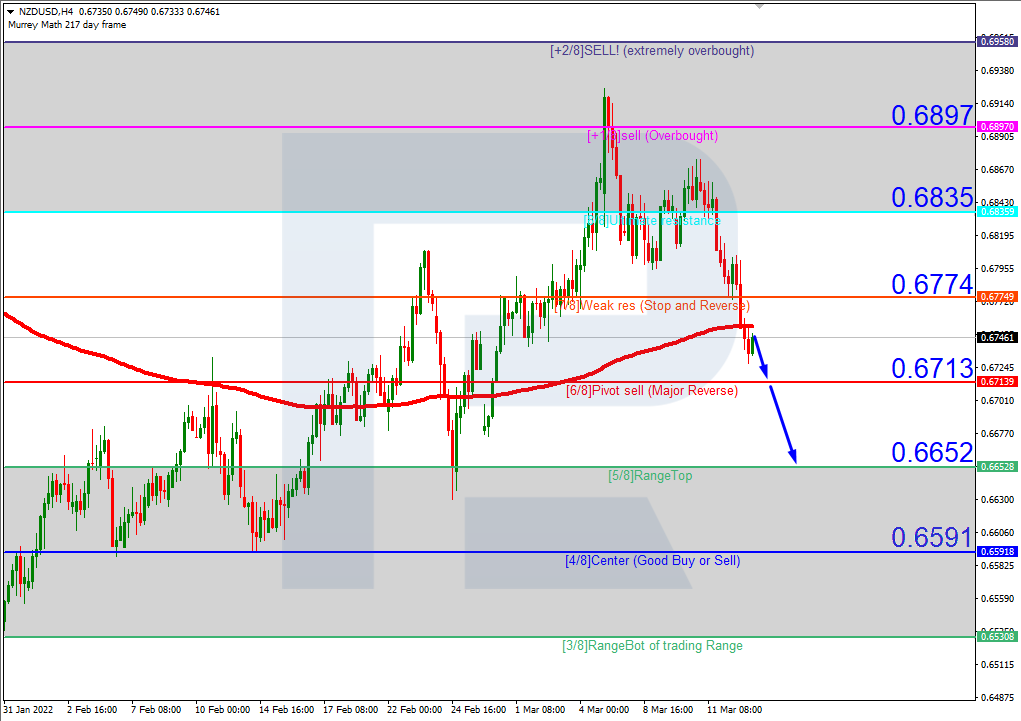
NZDUSD, “New Zealand Dollar vs US Dollar”

In the H4 chart of NZDUSD, the situation is similar. The asset has broken the 200-day Moving Average and is currently trading below it to indicate a descending tendency. In this case, the price is expected to break 5/8 and continue falling to reach the support at 4/8. However, this scenario may no longer be valid if the price breaks the resistance at 6/8 to the upside. After that, the instrument may reverse and grow towards 7/8.

NZDUSD_H4
Risk Warning: the result of previous trading operations do not guarantee the same results in the future

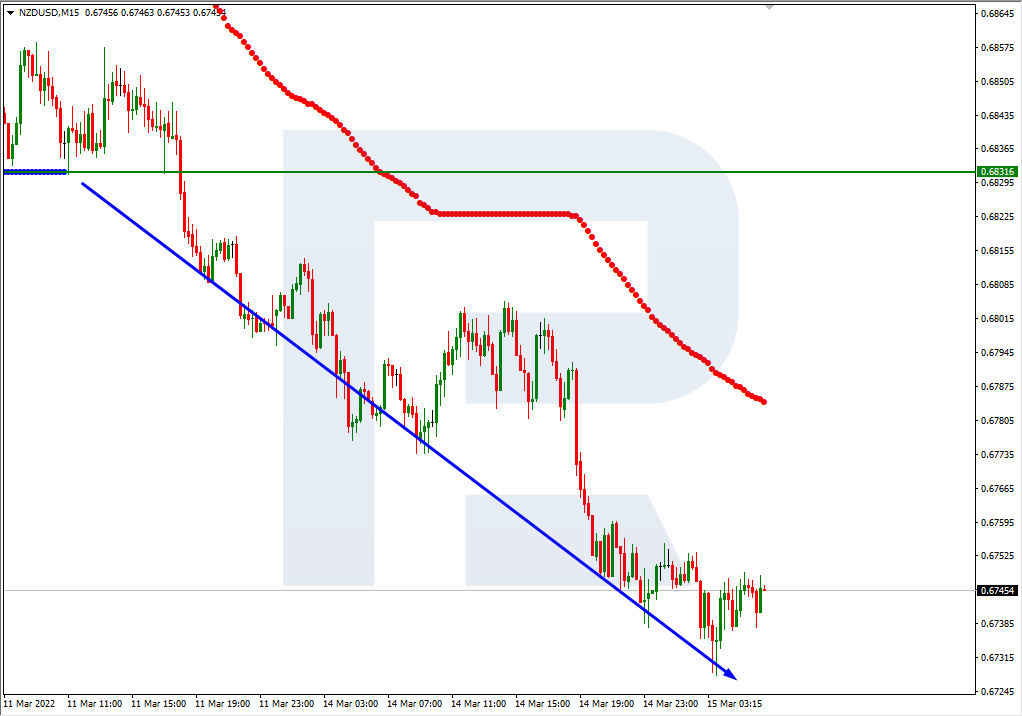
As we can see in the M15 chart, the pair has broken the downside line of the VoltyChannel indicator and, as a result, may continue its decline.

NZDUSD_M15

Article By RoboForex.com

Attention!
Forecasts presented in this section only reflect the author’s private opinion and should not be considered as guidance for trading. RoboForex LP bears no responsibility for trading results based on trading recommendations described in these analytical reviews.

The Analytical Overview of the Main Currency Pairs on 2022.03.15

by JustForex

The EUR/USD currency pair

Technical indicators of the currency pair:
  • Prev Open: 1.0919
  • Prev Close: 1.0941
  • % chg. over the last day: +0.20%

Geopolitical tensions in Eastern Europe are not declining. The European economy is approaching stagflation (a slowdown in economic growth with high inflation), and the US Federal Reserve will raise the interest rates tomorrow. All these factors will harm the European currency.

Trading recommendations
  • Support levels: 1.0948, 1.0916, 1.0887, 1.0823, 1.0633
  • Resistance levels: 1.1051, 1.1112, 1.1291

From the technical point of view, the trend on the EUR/USD currency pair on the hourly time frame is bearish. The price is now trading in the price corridor near the moving averages. The MACD indicator shows a slight buying pressure. Under such market conditions, it is best to look for sell trades on intraday time frames from the resistance level of 1.1051. Buy trades should be considered from the support level 1.0948 or 1.0916, but only with short targets.

Alternative scenario: if the price breaks out through the 1.1112 resistance level and fixes above, the mid-term uptrend will likely resume.

EUR/USD
News feed for 2022.03.15:
  • – German ZEW Economic Sentiment (m/m) at 12:00 (GMT+2);
  • – Eurozone ZEW Economic Sentiment (m/m) at 12:00 (GMT+2);
  • – Eurozone Industrial Production (m/m) at 12:00 (GMT+2);
  • – US Producer Price Index (m/m) at 14:30 (GMT+2);
  • – US NY Empire State Manufacturing Index (m/m) at 14:30 (GMT+2).

The GBP/USD currency pair

Technical indicators of the currency pair:
  • Prev Open: 1.3034
  • Prev Close: 1.3002
  • % chg. over the last day: -0.24%

UK labor market data showed a positive trend. The unemployment rate fell from 4.1% to 3.9%, jobless claims fell by 48,000, and average earnings increased. But the British pound is still declining despite rising interest rates as well as economic indicators. Currently, the pound is declining due to the narrowing spread between UK and US government bond yields. But the UK’s economic outlook is now much better than those of the Eurozone.

Trading recommendations
  • Support levels: 1.2989, 1.2863
  • Resistance levels: 1.3085, 1.3164, 1.3274

On the hourly time frame, the trend on the GBP/USD currency pair is bearish. Volatility is decreasing, buying pressure is increasing. The MACD indicator is in the negative zone, but there is a divergence towards long positions on higher time frames. Under such market conditions, it is better to look for buy deals from the support level 1.2989, but it is better with confirmation. For sell deals, it is better to consider the resistance level of 1.3085.

Alternative scenario: if the price breaks out through the 1.3164 resistance level and fixes above, the mid-term uptrend will likely resume.

GBP/USD
News feed for 2022.03.15:
  • – UK Average Earnings Index (m/m) at 09:00 (GMT+2);
  • – UK Claimant Count Change (m/m) at 09:00 (GMT+2);
  • – UK Unemployment Rate (m/m) at 09:00 (GMT+2).

The USD/JPY currency pair

Technical indicators of the currency pair:
  • Prev Open: 117.33
  • Prev Close: 118.17
  • % chg. over the last day: +0.71%

The Japanese yen continues to decline. This week, the US Federal Reserve and the Bank of Japan will hold monetary policy meetings. However, while the Federal Reserve will almost certainly raise interest rates, the Bank of Japan will remain dovish on monetary policy for an extended period due to low inflation and high energy prices. Such a situation favors the growth of USD/JPY quotes. Analysts at Bank of America raised their USD/JPY forecast to 123 by the third quarter.

Trading recommendations
  • Support levels: 117.34, 116.95, 116.32
  • Resistance levels: 118.32, 118.64

The medium-term trend on the USD/JPY currency pair is bullish. The MACD indicator is in the positive zone. There are signs of overbought and divergence, which means that a downward connection is close. In such market conditions, it is best to look for buy deals after a slight pullback, as the price has deviated strongly from the moving averages. A support level of 117.34 would be the best, but with additional confirmation. For sell deals, the resistance level of 118.32 can be considered.

Alternative scenario: if the price fixes below 116.32, the uptrend will likely be broken.

USD/JPY
There is no news feed for today.

The USD/CAD currency pair

Technical indicators of the currency pair:
  • Prev Open: 1.2726
  • Prev Close: 1.2818
  • % chg. over the last day: +0.72%

The Canadian dollar is a commodity currency, so it is highly dependent not only on the monetary policy of the Bank of Canada but also on the dynamics of oil prices and the dollar index. Oil prices fell to a 2-week low amid a new round of talks between Ukraine and Russia. Investors started fixing their positions as oil reached analysts’ targets of $125. With the dollar index rising, this led to an upward movement on the USD/CAD currency pair.

Trading recommendations
  • Support levels: 1.2764, 1.2733, 1.2653, 1.2555, 1.2517
  • Resistance levels: 1.2871, 1.2890

In terms of technical analysis, the USD/CAD currency pair trend is bullish. The MACD indicator is in the positive zone, with no signs of reversal. It is worth trading only with short targets because both oil and the dollar index are still fundamentally inclined to grow. Under such market conditions, it is better to look for buy trades on the lower time frames from the support level 1.2764, but it is better with additional confirmation. For sell deals, it is better to consider the resistance level of 1.2871.

Alternative scenario: if the price breaks through and consolidates below 1.2733, the downtrend will likely resume.

USD/CAD
There is no news feed for today.

by JustForex


This article reflects a personal opinion and should not be interpreted as an investment advice, and/or offer, and/or a persistent request for carrying out financial transactions, and/or a guarantee, and/or a forecast of future events.

Dollar index rises, while oil and gold fall ahead of Federal Reserve meeting

by JustForex

The US stock indices finished trading on Monday without a single trend. The Dow Jones (US30) was flat at the close, the S&P 500 (US500) decreased by 0.74%, and the NASDAQ Technology Index (US100) lost 2.04%.

Tomorrow will be the long-awaited March Federal Reserve meeting, at which the US Federal Reserve will raise interest rates. Most likely, the rate will be raised by 0.25%, but there is a slight possibility that due to the uncertainty caused by the war in Ukraine, the rate could be increased immediately by 0.5%. The Fed will also provide new macroeconomic forecasts along with the rate decision. Goldman Sachs Group lowered its forecast for the S&P 500 Index to 4,700 points from 4,900 points at the end of 2022 due to the conflict over Ukraine.

Unlike US indices, major European indices closed on the green territory on Monday. The German DAX (DE30) gained 1.38% on Friday, the French CAC 40 (FR40) added 1.75%, the Spanish IBEX 35 (ES35) increased by 1.13%, the British FTSE 100 (UK100) jumped by 0.53%. Investors hope that the Russian and Ukrainian delegations will come to a compromise and a ceasefire agreement. The UK labor market data showed positive dynamics. The unemployment rate declined from 4.1% to 3.9%, jobless claims fell by 48 thousand, and average earnings increased. The British economic outlook is now much better than that of the Eurozone. Today, the European Institute ZEW will publish economic forecasts for Germany and the Eurozone. Analysts expect to see a decline in numbers.

The European Union has introduced a new package of sanctions against Russia. The sanctions include a ban on new investments in the energy sector, according to the European Commission website. Exceptions are made for peaceful atom and energy transportation. Several goods such as steel products, luxury goods, premium cars, and jewelry are banned. The EU has banned rating agencies from providing any credit rating services related to Russia. The European Aviation Safety Agency (EASA) has suspended the certificates of Russian airlines.

Oil prices fell to a 2-week low amid a new round of negotiations between Ukraine and Russia, and as investors began to close their positions as oil hit analysts’ targets of $125. The United States warned China not to provide military or financial assistance to Russia. But India may accept Russia’s offer to buy crude oil and other commodities at a discount, which means India wants to keep its key trading partner.

Gold prices began to decline due to rising government bond yields ahead of the Federal Reserve’s interest rate decision. There are no fundamental growth factors for gold and silver now. The closer Russia and Ukraine are to a compromise, the faster gold will fall. The same applies to wheat and nickel prices.

Asia-Pacific stock indices traded without a single dynamic yesterday. Soaring inflation and uncertainty in the financial markets, aggravated by the beginning of Russia’s invasion of Ukraine, continue to worry many investors. Japan’s Nikkei 225 (JP225) gained 0.58% yesterday, Hong Kong’s Hang Seng (HK50) lost 4.97%, and Australia’s S&P/ASX 200 (AU200) increased by 1.21%. In Australia, the monetary policy minutes were published. The Australian Central Bank Board will not raise the monetary rate until actual inflation is steadily within the target range of 2% to 3%. The People’s Bank of China left its one-year medium-term credit line unchanged at 2.85%.

Main market quotes:

S&P 500 (F) (US500) 4,173.11 -31.20 (-0.74%)

Dow Jones (US30) 32,945.24 +1.05 (+0.0032%)

DAX (DE40) 13,929.11 +301.00 (+2.21%)

FTSE 100 (UK100) 7,193.47 +37.83 (+0.53%)

USD Index 99.09 -0.03 (-0.03%)

Important events for today:
  • – Australia RBA Meeting Minutes (m/m) at 02:30 (GMT+2);
  • – China Retail Sales (m/m) at 04:00 (GMT+2);
  • – China Industrial Production (m/m) at 04:00 (GMT+2);
  • – China Unemployment Rate (m/m) at 04:00 (GMT+2);
  • – UK Average Earnings Index (m/m) at 09:00 (GMT+2);
  • – UK Claimant Count Change (m/m) at 09:00 (GMT+2);
  • – UK Unemployment Rate (m/m) at 09:00 (GMT+2);
  • – German ZEW Economic Sentiment (m/m) at 12:00 (GMT+2);
  • – Eurozone ZEW Economic Sentiment (m/m) at 12:00 (GMT+2);
  • – Eurozone Industrial Production (m/m) at 12:00 (GMT+2);
  • – US Producer Price Index (m/m) at 14:30 (GMT+2);
  • – US NY Empire State Manufacturing Index (m/m) at 14:30 (GMT+2).

by JustForex


This article reflects a personal opinion and should not be interpreted as an investment advice, and/or offer, and/or a persistent request for carrying out financial transactions, and/or a guarantee, and/or a forecast of future events.

Market Sentiment Sours Amid Ongoing Geopolitical Risks

By Lukman Otunuga Senior Research Analyst, ForexTime

Asian stocks were painted red on Tuesday morning as continuing geopolitical risks and surging Covid-19 cases in China dealt another blow to risk appetite. In the currency space, the dollar got off to a shaky start despite the rise in Treasury yields while gold extended losses, sinking closer to $1900. Also falling are WTI oil prices which fell below $100 as China imposed lockdowns in key cities. European futures are pointing to a negative open as hopes fade over a ceasefire in Ukraine, with risk-off sentiment potentially trickling back to Wall Street which ended mostly lower Monday.

A sense of caution continues to shroud financial markets due to ongoing geopolitical tensions, rising Covid-19 cases in China, inflation fears, and looming U.S monetary policy tightening. Earlier this morning, data from China exceeded market expectations but this failed to shake off the jitters and overall gloom. This could be the theme this week as the current themes overshadow economic data. With investors likely to maintain a defensive stance towards riskier assets ahead of the Federal Reserve meeting on Wednesday, equity markets could be in store for further punishment. The S&P500 remains under pressure and has shed over 4.5% this month. A solid daily close below 4150 could signal further downside, especially if risk-off remains the name of the game.

All eyes on the Federal Reserve Meeting

The main risk event this week will be the monetary policy decision from the Federal Reserve on Wednesday. Markets widely expect the central bank to raise interest rates by 25-basis points as Federal Reserve Chair Jerome Powell recently signaled. It would be the first hike by the Fed since 2018.

Given how the conflict in Ukraine has left investors fearful over the global growth outlook, the policy path beyond March may be clouded by the fog of war. Much attention will be directed towards the economic projections (“dot plot”) and press conference for fresh clarity on future rate hikes. With US inflation hitting a new 40-year high at 7.9% in February, the Fed remains entangled in a fierce battle against rising prices. It will be interesting to hear Powell’s thoughts on recent events and how the Fed plans to navigate through this current storm.

The dollar may appreciate if the Fed adopts an aggressive approach towards higher interest rates despite ongoing geopolitical risks. Should the central bank strike a more cautious tone and economic forecasts are downgraded, this could result in dollar weakness.

Oil prices extend selloff

Oil benchmarks were under pressure this morning with WTI dipping below $100 as investors evaluated demand risks from China’s imposed lockdowns and the Ukraine-Russia ceasefire talks.

The global commodity is likely to remain sensitive to geopolitical risks and supply-side factors, especially as Russia’s oil imports are banned further. It may be wise to keep a close eye on the Energy Information Administration (EIA) report published on Wednesday. Another weekly drawdown in crude inventories could limit downside losses for oil.

Commodity spotlight – Gold

Gold stumbled into Tuesday’s session under renewed pressure as Treasury yields rose ahead of an expected rate hike by the Federal Reserve.

While heightened geopolitical risks and overall uncertainty have recently accelerated the flight to safety, the prospect of the Federal Reserve raising interest rates could result in further losses. Given how prices have dropped almost $70 since last Friday, the path of least resistance points south in the short term.

Ultimately, where gold concludes this week will be heavily influenced by the outcome of the Fed meeting, movements in bond markets, and ongoing geopolitical tensions.

Disclaimer: The content in this article comprises personal opinions and should not be construed as containing personal and/or other investment advice and/or an offer of and/or solicitation for any transactions in financial instruments and/or a guarantee and/or prediction of future performance. ForexTime (FXTM), its affiliates, agents, directors, officers or employees do not guarantee the accuracy, validity, timeliness or completeness, of any information or data made available and assume no liability as to any loss arising from any investment based on the same.


Forex-Time-LogoArticle by ForexTime

ForexTime Ltd (FXTM) is an award winning international online forex broker regulated by CySEC 185/12 www.forextime.com

Trade Of The Week: GBPUSD – Battle Of The Hawks

By Lukman Otunuga Senior Research Analyst, ForexTime 

If you are not afraid of volatility and want some action, then keep a close eye on the GBPUSD.

The week ahead promises to be eventful for the currency pair thanks to the Federal Reserve (Fed) and Bank of England (BoE) meetings.

Both central banks are aggressively hawkish and widely expected to raise interest rates this month to help tame inflation. However, the policy path beyond March may be clouded by the fog of war amid Russia’s invasion of Ukraine.

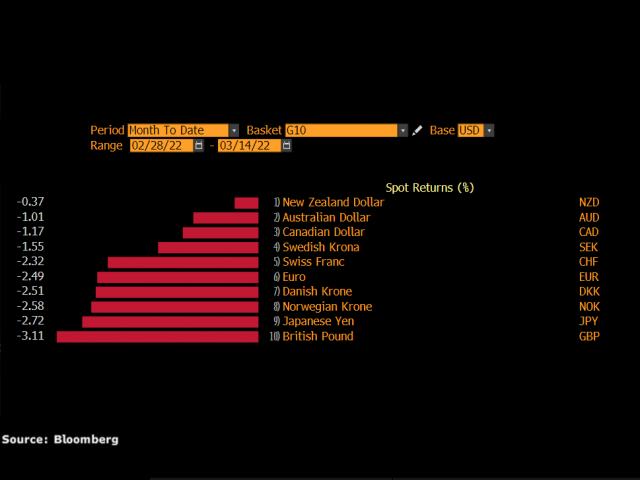
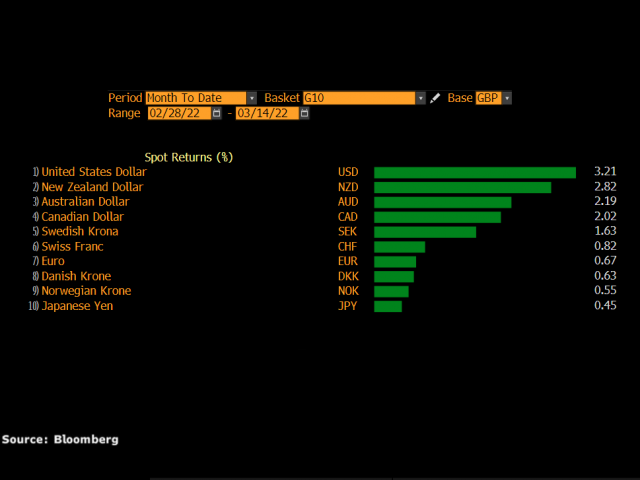
Before we discuss what to expect from the Fed and BoE, it is worth keeping in mind that the dollar has appreciated against every single G10 currency this month.

March has not been a kind month for the pound, which is down against all its major counterparts as of writing.

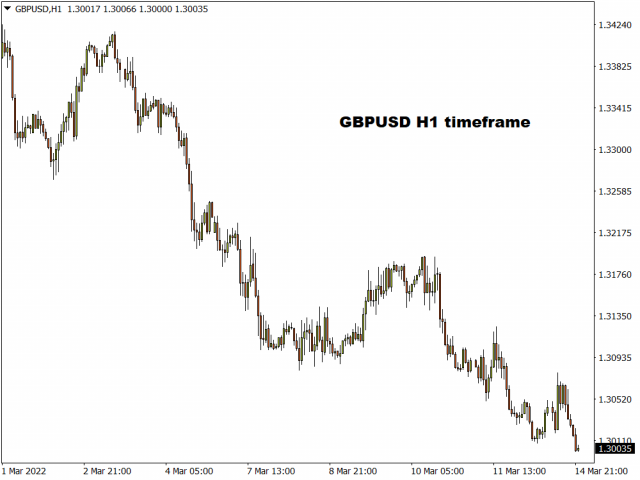
Given how our focus is on the Fed and BoE meeting, our trade of the week will be the GBPUSD which is down -3% in March.

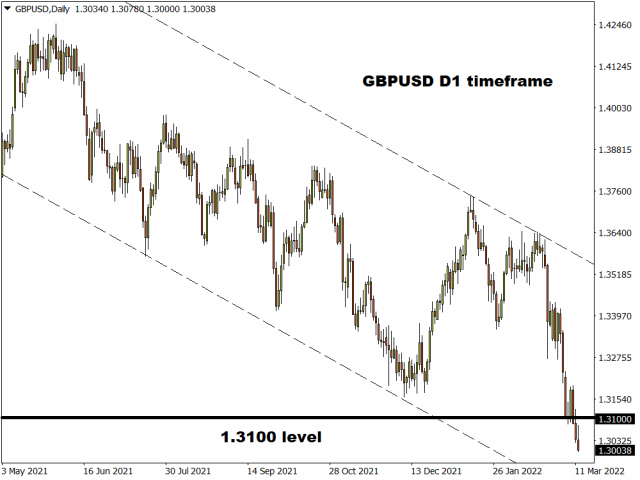
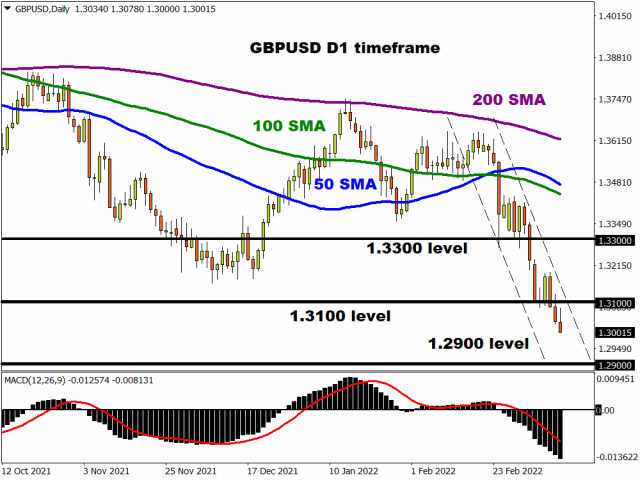
The GBPUSD is heavily bearish on the daily timeframe as there have been consistently lower lows and lower highs. With bears recently securing a solid close below 1.3100, further downside could be on the cards.

What to expect from the Fed meeting

If you are based in the United Kingdom or European timezone, the Federal Reserve policy decision and press conference will be on Wednesday evening.

Markets widely expect the central bank to raise interest rates by 25-bps as Federal Reserve Chair Jerome Powell recently signalled. However, investors will be paying very close attention to the economic projections and press conference for fresh clarity on future rate hikes.

The conflict in Ukraine has left investors fearful over the US economic growth outlook and rising inflationary pressures. Nevertheless, US inflation hit a new 40 year high at 7.9% in February thanks to strong demand and supply constraints. It will be interesting to hear Powell’s thoughts on the current developments and how the Fed will navigate through this current storm.

King dollar is likely to appreciate if the Fed adopts an aggressive approach towards higher interest rates despite the geopolitical risks. If the central bank strikes a cautious tone with the economic forecasts downgraded, this could result in a weaker greenback.

How about the BoE meeting?

The Bank of England interest rate decision and meeting minutes will be released at 12:00 pm UK time on Thursday.

Earlier we highlighted how the BoE was widely expected to raise interest rates in the face of rising inflation. Indeed, consumer prices increased at an annual rate of 5.5% in January 2022, its highest level in 30 years.

But the central bank is expected to adopt a cautious approach towards higher rates beyond March amid concerns about the economic impact of Russia’s invasion of Ukraine. With no press conference or updated economic forecasts this week, all eyes will be on the BoE meeting minutes for clues on future rate hikes.

GBPUSD bears winning tug of war

Now, this is where things get interesting. If both the Fed and BoE strike a hawkish tone, the USD and GBP are likely to strengthen against each other. This could result in volatility and choppiness until one loses the tug-of-war.

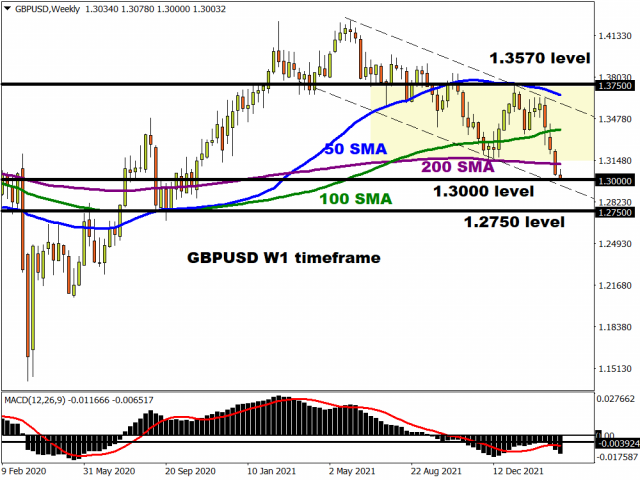
When looking at the GBPUSD, prices remain heavily bearish on the daily and weekly timeframe. But the question that comes to mind is whether a technical bounce could be on the horizon? The pending central bank policy meetings will certainly influence the GBPUSD’s medium to longer-term trajectory. Focusing on key technical levels, a solid daily close below 1.3000 may open the doors towards 1.2900 and 1.2750. Should 1.2750 prove to be reliable support, this could provide a foundation for bulls to re-enter the scene.

We see a similar story on the daily charts with prices respecting a bearish channel. The candlesticks are trading way below the 50, 100, 200-day Simple Moving Average while the MACD trades below zero. The first level of interest can be found at 1.2900. A move back above 1.3100 could trigger an incline towards 1.3300.

Disclaimer: The content in this article comprises personal opinions and should not be construed as containing personal and/or other investment advice and/or an offer of and/or solicitation for any transactions in financial instruments and/or a guarantee and/or prediction of future performance. ForexTime (FXTM), its affiliates, agents, directors, officers or employees do not guarantee the accuracy, validity, timeliness or completeness, of any information or data made available and assume no liability as to any loss arising from any investment based on the same.


Forex-Time-LogoArticle by ForexTime

ForexTime Ltd (FXTM) is an award winning international online forex broker regulated by CySEC 185/12 www.forextime.com

Bitcoin Jumps 9%: Is This Executive Order the Reason?

Here’s what our “wave model” suggested for Bitcoin before the rally

By Elliott Wave International

Bitcoin and other cryptocurrencies surged higher on March 9.

CNBC provided this explanation (March 9):

Bitcoin and other cryptocurrencies were higher on [March 9] after President Joe Biden announced his highly anticipated executive order on digital assets that appeared to take a supportive stance toward the industry.

The basic message of the executive order focuses on development of the crypto market as opposed to unrealistic regulations.

Around midday (March 9), Bitcoin was trading 9.5% higher at just north of $42,200. Litecoin was trading around 9% higher and Ethereum was posting a 7% advance.

It’s true that often — although, far from “always” — financial markets tend to have brief emotional responses to news, and cryptocurrencies are highly emotional markets in the first place. However, after temporary spikes (whether up or down), markets tend to return to their established trends.

Those trends are ascertained by looking at a financial market’s Elliott wave structure, which reflects the repetitive patterns of investor psychology.

In the case of Bitcoin, Elliott Wave International crypto analyst Tony Carrion said this in the March 4 Global Market Perspective, a monthly publication which covers 50-plus worldwide financial markets:

Focusing our attention on Bitcoin, our Intermediate wave model is bullish.

The point is: Bitcoin’s Elliott wave structure was already bullish, even before that executive order.

Keep in mind, that just one day before the March Global Market Perspective published, Bitcoin’s price rise was not a given.

As a March 3 Marketwatch headline said:

Most big cryptocurrencies post drops

Also on March 3, the Crypto Fear and Greed index showed a reading of 39, which indicated fear. In other words, many crypto observers were bearish. By March 8, that index slid to 21, indicating extreme fear.

Even so, Bitcoin’s price action was strongly positive on March 9.

As Elliott Wave International has noted many times, when sentiment reaches an extreme, prices often move in the opposite direction from what the majority expect.

Having said that, Bitcoin has been in a bullish pattern for quite some time and another Elliott Wave International observation is that when the government jumps aboard a financial trend, they usually do so late in the game.

As you might imagine, no analytical method can provide certainty about a market’s future price path. However, the Elliott wave model has proven itself time and again.

You can learn how the Elliott wave model can help you forecast financial markets by reading Frost & Prechter’s Wall Street classic, Elliott Wave Principle: Key to Market Behavior.

This quote is from the book:

After you have acquired an Elliott “touch,” it will be forever with you, just as a child who learns to ride a bicycle never forgets. Thereafter, catching a turn becomes a fairly common experience and not really too difficult. Furthermore, by giving you a feeling of confidence as to where you are in the progress of the market, a knowledge of Elliott can prepare you psychologically for the fluctuating nature of price movement and free you from sharing the widely practiced analytical error of forever projecting today’s trends linearly into the future. Most important, the Wave Principle often indicates in advance the relative magnitude of the next period of market progress or regress. Living in harmony with those trends can make the difference between success and failure in financial affairs.

You can read the entire online version of the book for free after you join Club EWI, the world’s largest Elliott wave educational community.

Joining Club EWI is free. Members enjoy complimentary access to a treasure trove of Elliott wave resources on investing and trading without any obligation.

Get started by following this link: Elliott Wave Principle: Key to Market Behavior — free and instant access.

This article was syndicated by Elliott Wave International and was originally published under the headline Bitcoin Jumps 9%: Is This Executive Order the Reason?. EWI is the world’s largest market forecasting firm. Its staff of full-time analysts led by Chartered Market Technician Robert Prechter provides 24-hour-a-day market analysis to institutional and private investors around the world.

How Worried Should Traders Be About A Russian Credit Default

By Orbex

What’s happening

On Wednesday, Russia is scheduled to make its first major payment on foreign debt since the start of the war.

Many analysts are suggesting that because of the sanctions, they won’t be technically able to meet their obligations. Failure to pay doesn’t mean that the country falls immediately into default because there is a 30-day grace period. This means that officially, and technically, Russia wouldn’t fall into default until next month.

However, should the country fail to make the first payment on time, it could cause worries for the bond markets.

Russia has relatively little foreign debt. This is partially due to a deliberate policy by the government to not rely on foreign borrowers, and take advantage of the cash flows generated by selling oil and gas. The pending payment is just $117M, so it’s more of a sign of things to come that could worry the market, beyond the actual amount of money.

Bad debt has a habit of spreading

In the past, a sovereign credit default has implied a systemic risk for emerging markets. Typically, there is interdependence in credit markets between developing countries as they often can’t access more reliable sources of funding. The credit default in one leads investors to be unsure about continuing to invest in others with similar profiles.

However, Russia isn’t in the same position, although it is facing the risk of credit default which could have some lasting implications. Russia has been working on building capital reserves and has relatively little foreign debt. In turn, this means that there is relatively little exposure to foreign assets, but some of that exposure is concentrated in certain areas.

How much are we talking about?

The Russian government has only about $40B in foreign debt, which in the grand scheme of things is insignificant.

Nonetheless, if the government can’t meet its payments, it calls into question the relatively less reliably private sector, much of which is subject to similar sanctions as the government. Private foreign debt amounts to $480B, and all of it is currently classified as “junk”.

Hedge funds have been investing in Russian debt over the years to take advantage of the high interest rates. Major banks have already started pulling out of Russia and writing down their assets. The most notable being Raiffeisen, with a strong presence in Eastern Europe.

Where things could be going

Banks are relatively transparent with their holdings.

Where things are a little murkier is with hedge funds. The largest foreign holder of Russian-exposed debt is Blackrock, which holds $18B in now junk Russian-based bonds. That’s a lot of money. But Blackrock also has $9.5T in assets. Therefore, as far as the firm is concerned, it’s not likely to pose a systemic risk.

Smaller, high-risk hedge funds could have larger exposures. And they could wait to disclose how much until after the end of the month.

However, as these firms have to write down the value in their portfolio for generally higher-risk investments, it could mean that there are fewer funds available to invest in emerging markets. Even if the firms themselves don’t fail, they could be a lot more shy to take on higher-risk assets, such as crypto and tech stocks over the coming months.

Trading the news requires access to extensive market research – and that’s what we do best. Open your Orbex account now.


Orbex-LogoArticle by Orbex

Orbex is a fully licensed broker that was established in 2011. Founded with a mission to serve its traders responsibly and provides traders with access to the world’s largest and most liquid financial markets. www.orbex.com

SPX500 Major Impulse To End Near 4824.14

By Orbex

SPX 500

The stock index SPX500, as a few weeks ago, formed a major impulse trend.

At the moment, the primary wave ③, which is part of the cycle impulse V, is under development. It is a bullish impulse marked by intermediate sub-waves (1)-(2)-(3)-(4)-(5).

In the near future, the price could rise to the level of 4824.14, marked by a minor impulse 3. At that level, the entire primary wave ③ could end.

After the completion of the bullish impulse, a decline within the primary wave ④ near 3629.53 is likely. At that level, the correction will be at 50% of the previous impulse.

SPX 500

In an alternative scenario, the construction of the impulse wave is fully complete. It reached the peak of 4817.52, and then the decline began.

Perhaps at the last section of the chart, the first half of the intermediate zigzag (A)-(B)-(C) is forming the primary correction ④.

Most likely, the index will fall in correction to the 3638.17 area, since at that level, wave ④ will be at 38.2% of impulse ③. The probability of achieving this coefficient is high.

Test your strategy on how SPX500 will fare with Orbex – Open your account now.


Orbex-LogoArticle by Orbex

Orbex is a fully licensed broker that was established in 2011. Founded with a mission to serve its traders responsibly and provides traders with access to the world’s largest and most liquid financial markets. www.orbex.com