The Gargantuan Task Of Replacing Russian Oil

By ValueWalk.com 

The economic sanctions against Russia continue, and so do the drastic changes that may be generated in the global economy. With the head of the European Commission, Ursula von der Leyen, reinstating the European Union’s urge to completely renounce Russian oil in the next six months —and before the end of the year, products derived from Russian crude oil— the global market is in the dark.

How would the global economy without Russian oil look like?

Sanctions Background

The European Commission’s announcement is full of complexities, not only because it would mean the most drastic economic sanction against Russia —it is estimated that 60% of Russian oil exports are for OECD countries in Europe— but also because several countries in the block are highly dependent on Russian oil to keep their industries running.

The new package of measures must be unanimously approved by the Member States in order to be executed, since questions such as where the crude oil will come from once the Russian supply ceases completely and what impact this will have on prices, must be taken into account.

According to an S&P Global report updated on May 10, “The conflict and its economic consequences have since displaced more than 2 million barrels per day from Russia. The EU’s oil sanctions are likely to reshape global energy flows as well as increase energy price pressures across the region.”

Critical Role

Stats from the International Energy Agency (IEA) in January this year show that Russian oil production reached 11.3 million barrels per day (mb/d), only behind Saudi Arabia and the U.S. —the largest producers on the planet.

However, the Russian industry has managed to establish itself as the largest exporter of refined oil to global markets and the second —after Saudi Arabia— in crude oil international sales.

Now, according to information from the IEA, 60% of Russian oil exports go to OECD countries in Europe —20% go to China— which includes countries like Germany or France.

IEA figures show that of the total German oil purchases, 30% comes from the Russian industry —the share reaches 80% in countries like Finland, for example.

Russia provides around 40% of the gas Europe consumes and accounts for 16% of the world’s supply. In addition, it is the third-largest oil producer in the world; before the war broke out in Ukraine, it is estimated that Russian exports of crude oil and refined products covered around 7.5% of world oil demand.

For the U.S., Russian oil accounted for about 3% of all crude shipments that reached that country last year, according to data from the US Energy Information Administration. Before the war in Ukraine, U.S. imports of Russian crude in 2022 were falling at the slowest annual pace since 2017, according to the intelligence firm Kpler.

Outlook

Replacing Russian oil is a tough, slow task, as not many nations can fill in and supply part of Russia’s quota, both on a global scale and from a market perspective.

First calculations by the International Energy Agency, OPEC, and private consulting companies point to countries such as Saudi Arabia, the United Arab Emirates, and Kuwait being capable of quickly answering the global demand for more oil amid the current crisis.

According to the most optimistic estimates, Iran and Venezuela could add over 1.5 million barrels per day, should geopolitical and logistical issues be overcome.

As for Iran, the nuclear agreement with Tehran would need reworking to lift restrictions on trade in Iranian crude. In the case of Venezuela, billions of dollars are needed, in addition to months to prep up the country’s oil infrastructure.

So, substituting Russian oil seems a gargantuan task in a period when prices could continue to rise. This would cause inflation to continue to rise in countries that have nothing to do with the war in Ukraine.

By ValueWalk.com

 

New ETFs You May Want To Own

By Ino.com

– New ETFs are popping up all the time. This is partially due to the ease of the process of opening a new product but largely because investors are looking for new ways to play different emerging trends and new technologies. Of course, it’s unlikely all the new ETF options will last the test of time; just look at how many ETFs close each year, but that doesn’t stop fund managers from opening new ones like it’s going out of style. I guess the thinking is, ‘throw as many things at the board and see what sticks.’

But from an investor’s point of view, it’s not costing you anything unless you invest in something that fails, and it gives us a lot more options to choose from. So with that in mind, let’s take a look at a few of the newer ETFs to hit the market; perhaps you may find one interesting enough to invest in or at least follow.

The first one that I would like to highlight is the iShares Emergent Food and AgTech Multisector ETF (IVEG). The fund will invest in companies that focus on agriculture technology, alternative proteins, nutritional innovation and safety, and sustainable food production and packaging. For the fund to hold a company, it must derive revenues from one of those themes; they also must expect to see profits from one of the themes increase by at least 5% during the coming 5-year period. The fund will have an expense ratio of 0.47%.

From 2010 to 2050, food demand is expected to increase by 56% worldwide. Furthermore, it is believed that 34% of global emissions are caused by food production. These two figures point toward some big changes in the food and agricultural industries in the coming decades. We may be early today, especially since this is not an industry that is known to change quickly, but it is hard to deny the fact that it is ripe for change in the coming years.

Another interesting one is the Invesco Electric Vehicle Metals Commodity Strategy No K-1 ETF (EVMT). This ETF focuses on gaining exposure to iron, copper, aluminum, nickel, and cobalt through a combination of futures contracts and commodity-linked ETFs. It will avoid being labeled as a commodity pool, which will allow it to have different tax status from other commodity-focused ETFs. The fund will have an expense ratio of 0.59% for the first roughly year and a half.

The demand boom we are seeing for EVs around the world is likely only going to grow in the coming years, and this is sort of a back door way to play the EV trade without trying to cherry pick which companies are going to make it and which ones will fade out. These materials will be required by all the companies trying to make EVs, and thus, these commodities will likely only move higher in price with time. The only question is, can they move high enough, quickly enough, so that the futures contracts don’t deteriorate and erode profits.

And finally, let’s take a look at the new AdvisorShares Drone Technology ETF (UAV). UAV focuses on companies that derive at least half their revenue or profits from the manufacturing of drones or the development of related technologies. It primarily focuses on US-based companies.

If you have been investing long enough, you remember when drones and this technology were all the hype a few years ago. This is the second drone-focused ETF; the first was launched in 2016 and failed. Part of this was fueled by Amazon.com Inc. (AMZN) announcing that they were trying to figure out ‘last mile delivery’ using drones. Other delivery services have also talked about trying to do this, but unfortunately, no one has figured it out enough to roll out a nationwide program. Unfortunately, it hasn’t happened yet for those working on it, but perhaps fortunate for those of us who may be interested in investing in this space prior to it really taking off, but after the initial pop and fade.

Drones are already being used for military applications, photography, e-sports, and just for enjoyment. Which is all good because the concept is sound, and the businesses in this industry are producing good products. But, the real money won’t flow in until drones can and are being used on a more commercial basis. So, investing in this industry today is risky but could offer big upside.

Matt Thalman
INO.com Contributor – ETFs
Follow me on Twitter @mthalman5513

Disclosure: This contributor did not hold a position in any investment mentioned above at the time this blog post was published. This article is the opinion of the contributor themselves. The above is a matter of opinion provided for general information purposes only and is not intended as investment advice. This contributor is not receiving compensation (other than from INO.com) for their opinion.

By Ino.com – See our Trader Blog, INO TV Free & Market Analysis Alerts

Source: New ETFs You May Want To Own

Electric eels inspired the first battery two centuries ago and now point a way to future battery technologies

By Timothy J. Jorgensen, Georgetown University 

As the world’s need for large amounts of portable energy grows at an ever-increasing pace, many innovators have sought to replace current battery technology with something better.

Italian physicist Alessandro Volta tapped into fundamental electrochemical principles when he invented the first battery in 1800. Essentially, the physical joining of two different materials, usually metals, generates a chemical reaction that results in the flow of electrons from one material to the other. That stream of electrons represents portable energy that can be harnessed to generate power.

The first materials people employed to make batteries were copper and zinc. Today’s best batteries – those that produce the highest electrical output in the smallest possible size – pair the metal lithium with one of several different metallic compounds. There have been steady improvements over the centuries, but modern batteries rely on the same strategy as that of Volta: pair together materials that can generate an electrochemical reaction and snatch the electrons that are produced.

But as I describe in my book “Spark: The Life of Electricity and the Electricity of Life,” even before humanmade batteries started generating electric current, electric fishes, such as the saltwater torpedo fish (Torpedo torpedo) of the Mediterranean and especially the various freshwater electric eel species of South America (order Gymnotiformes) were well known to produce electrical outputs of stunning proportions. In fact, electric fishes inspired Volta to conduct the original research that ultimately led to his battery, and today’s battery scientists still look to these electrifying animals for ideas.

Copying the eel’s electric organ

Prior to Volta’s battery, the only way for people to generate electricity was to rub various materials together, typically silk on glass, and to capture the resulting static electricity. This was neither an easy nor practical way to generate useful electrical power.

Volta knew electric fishes had an internal organ specifically devoted to generating electricity. He reasoned that if he could mimic its workings, he might be able to find a novel way to generate electricity.

The electric organ of a fish is composed of long stacks of cells that look very much like a roll of coins. So Volta cut out coinlike disks from sheets of various materials and started stacking them, in different sequences, to see if he could find any combination that would produce electricity. These stacking experiments kept yielding negative results until he tried pairing copper disks with zinc ones, while separating the stacked pairs with paper disks wetted with saltwater.

This sequence of copper-zinc-paper fortuitously produced electricity, and the electrical output was proportionate to the height of the stack. Volta thought he had uncovered the secret of how eels generate their electricity and that he had actually produced an artificial version of the electric organ of fish, so he initially called his discovery an “artificial electric organ.” But it was not.

What really makes eels electrifying

Scientists now know the electrochemical reactions between dissimilar materials that Volta discovered have nothing to do with the way an electric eel generates its electricity. Rather, the eel uses an approach similar to the way our nerve cells generate their electrical signals, but on a much grander scale.

Specialized cells within the eel’s electric organ pump ions across a semipermeable membrane barrier to produce an electrical charge difference between the inside versus the outside of the membrane. When microscopic gates in the membrane open, the rapid flow of ions from one side of the membrane to the other generates an electrical current. The eel is able to simultaneously open all of its membrane gates at will to generate a huge jolt of electricity, which it unleashes in a targeted fashion upon its prey.

Electric eels don’t shock their prey to death; they just electrically stun it before attacking. An eel can generate hundreds of volts of electricity (American household outlets are 110 volts), but the eel’s voltage does not push enough current (amperage), for a long enough time, to kill. Each electric pulse from an eel lasts only a couple thousandths of a second and delivers less than 1 amp. That’s just 5% of household amperage.

This is similar to how electric fences work, delivering very short pulses of high-voltage electricity, but with very low amperage. They thus shock but do not kill bears or other animal intruders that try to get through them. It is also similar to a modern Taser electroshock weapon, which works by quickly delivering an extremely high-voltage pulse (about 50,000 volts) carrying very low amperage (just a few milliamps).

Modern attempts to mimic the eel

Like Volta, some modern electrical scientists searching to transform battery technology find their inspiration in electric eels.

A team of scientists from the United States and Switzerland is currently working on a new type of battery inspired by eels. They envision that their soft and flexible battery might someday be useful for internally powering medical implants and soft robots. But the team admits they have a long way to go. “The electric organs in eels are incredibly sophisticated; they’re far better at generating power than we are,” lamented Michael Mayer, a team member from the University of Fribourg. So, the eel research continues.

In 2019, the Nobel Prize in Chemistry was awarded to the three scientists who developed the lithium-ion battery. In conferring the award, the Royal Swedish Academy of Sciences asserted that the awardees’ work had “laid the foundation of a wireless, fossil fuel-free society.”

The “wireless” part is definitely true, since lithium-ion batteries now power virtually all handheld wireless devices. We’ll have to wait and see about the “fossil fuel-free society” claim, because today’s lithium-ion batteries are recharged with electricity often generated by burning fossil fuels. No mention was made of the contributions of electric eels.

Later that same year, though, scientists from the Smithsonian Institution announced their discovery of a new South American species of electric eel; this one is notably the strongest known bioelectricity generator on Earth. Researchers recorded the electrical discharge of a single eel at 860 volts, well above that of the previous record-holding eel species, Electrophorus electricus, that clocked in at 650 volts, and 200-fold higher that the top voltage of a single lithium-ion battery (4.2 volts).

Just as we humans try to congratulate ourselves on the greatness of our latest portable energy source, the electric eels continue to humble us with theirs.The Conversation

About the Author:

Timothy J. Jorgensen, Director of the Health Physics and Radiation Protection Graduate Program and Professor of Radiation Medicine, Georgetown University

This article is republished from The Conversation under a Creative Commons license. Read the original article.


Mid-Week Technical Outlook: Movers & Shakers

By ForexTime

– Global sentiment brightened on Wednesday with equities rebounding after a rally in technology companies helped reverse most of the losses on Wall Street overnight.

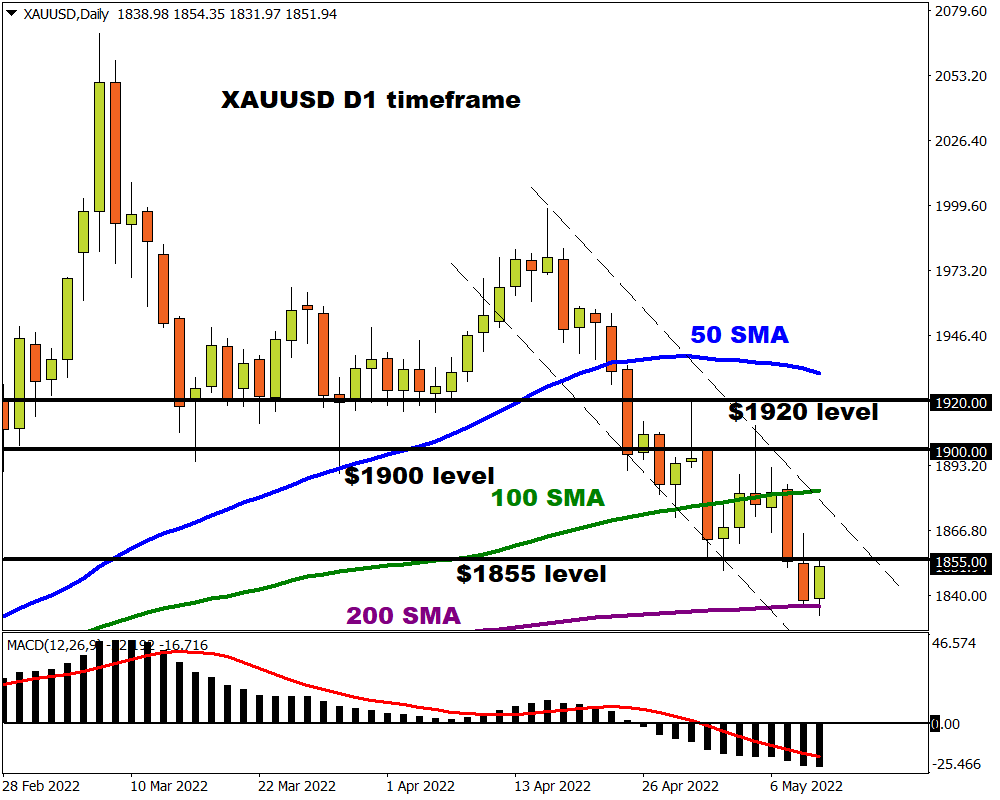
We already knew this would be an explosively volatile week for financial markets thanks to speeches from numerous Fed officials, ongoing geopolitical risks, and anticipation ahead of the US inflation report. Since Monday, there have been some significant movements with the dollar rallying to levels not seen in 20 years! Oil prices closed over 6% lower on Monday while gold secured a daily close under the $1855 support! There was some action in the FX space, with commodity currencies like the Australian Dollar and New Zealand dollar depreciating across the board.

With just less than one hour until the latest US CPI report is published, here and some technical setups we have our eyes on.

Dollar Index hovers near 20 year high

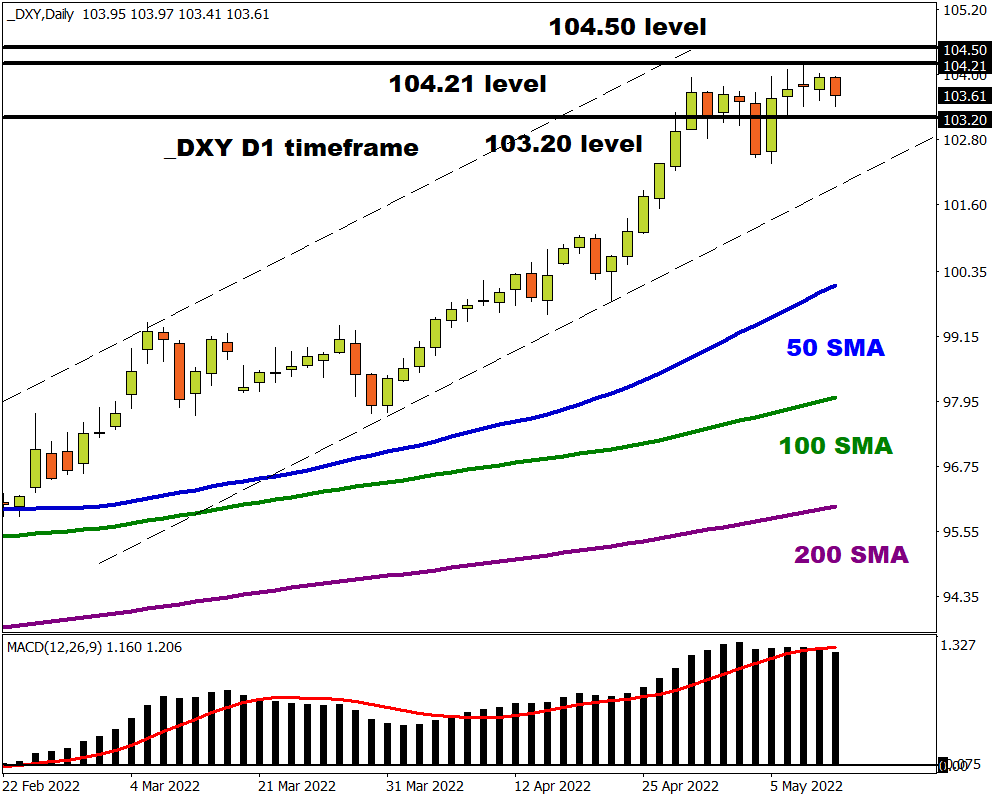
King Dollar marched into the week on a high note, reaching levels not seen in 20 years on Monday as U.S Treasury yields climbed on Fed rate hike expectations. Although prices have slightly retreated, the risk-off sentiment stemming from geopolitical risks should keep the DXY buoyed. Dollar volatility could remain a key theme, especially if the pending US CPI report exceeds expectations. Bulls may shift into higher gear on hawkish comments from Fed officials.

Looking at the technical picture, a strong daily close above 104.00 could open a path towards 104.50 and beyond. Sustained weakness below 104.21 could encourage a decline back towards 103.20.

Equally weighted USD bullish 

The subtitle says it all.

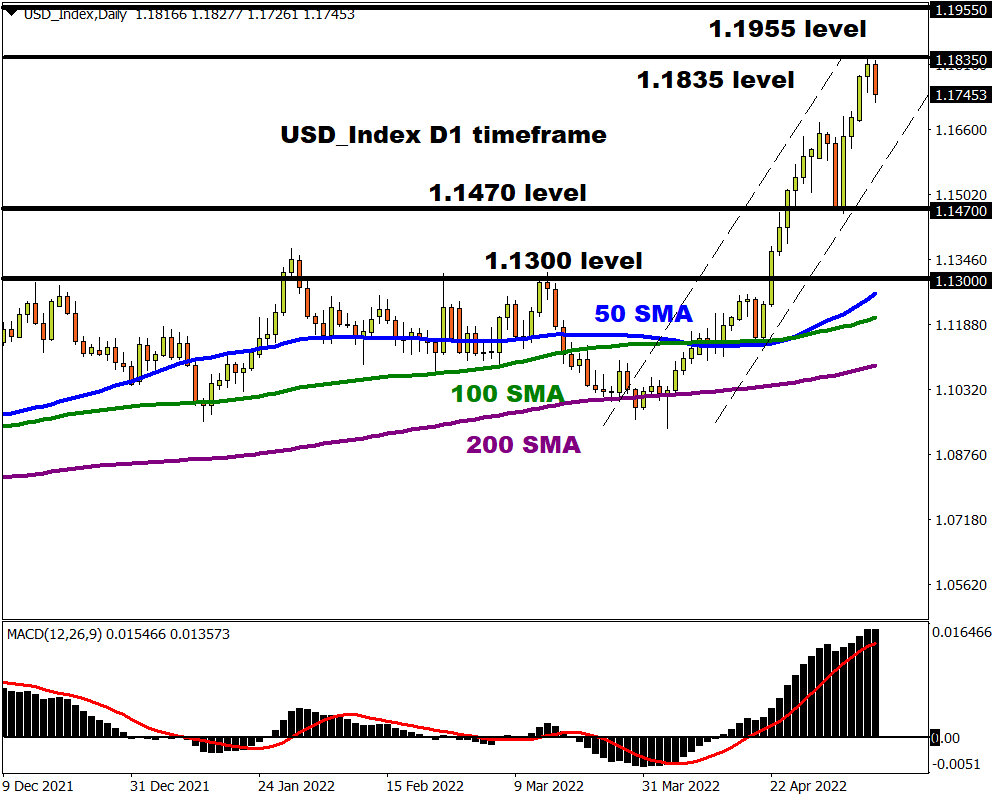
Prices are heavily bullish on the daily charts. There have been consistently higher highs and higher lows while prices are trading above the 50,100 and 200-day Simple Moving Average. A strong daily close above 1.1835 could encourage a move towards 1.1955. If bulls run out of steam below 1.1835, this could result in a technical throwback that sees prices trade back towards 1.1660 – 1.1600 before bulls return to the scene.

If prices sink back towards 1.1470, the equally-weighted USD index may decline back towards 1. 1300.

EURUSD on standby…

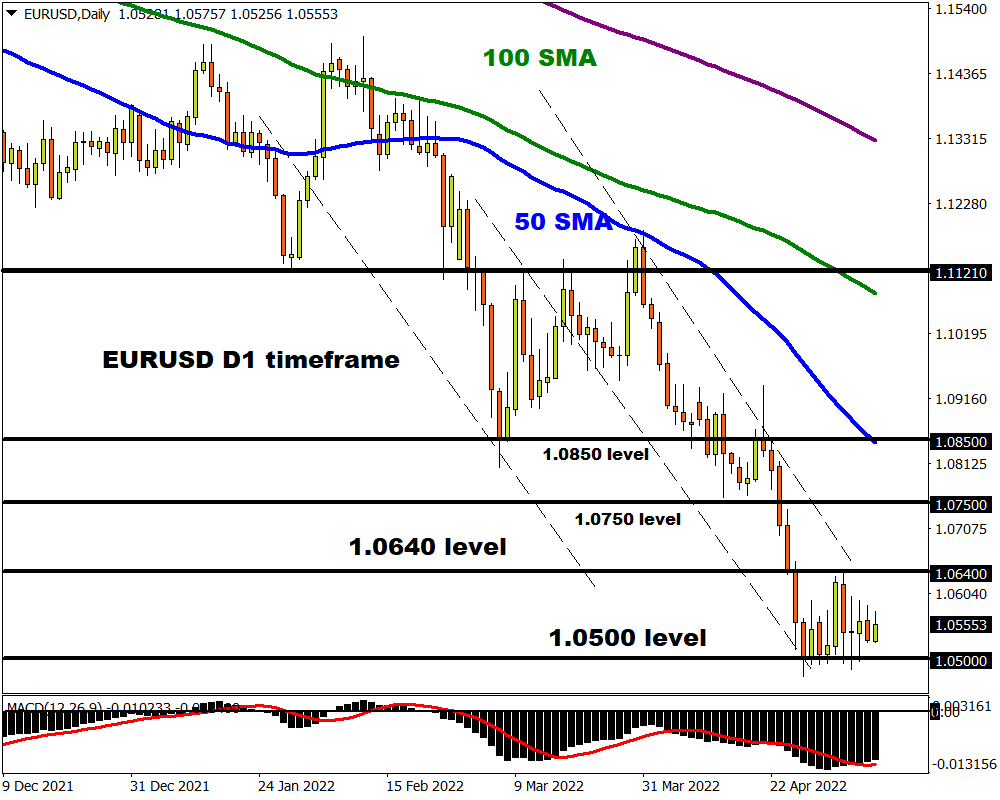
Where the EURUSD concludes this week may be heavily influenced by the US inflation data. The key levels of interest can be found at 1.0640 and 1.0500. A strong dollar could drag the currency pair well below 1.0500, opening the doors towards 1.0350. Should 1.0500 prove to be reliable support, this could trigger a rebound back to 1.0640.

Bonus: Gold glitters ahead of CPI data 

A softer dollar has injected gold bugs with renewed confidence ahead of the US inflation. Prices have staged a rebound from the daily 200-day Simple Moving Average but are still below the $1855 support level. Regardless of the recent rebound, the precious metal may face headwinds in the form of rising treasury yields and expectations over the Fed maintaining an aggressive approach towards monetary policy. On the technical front, prices are bearish on the daily charts with support found at $1855. It will be interesting to see whether bulls can defend this level of bear’s drag prices even lower. Whatever the outcome, volatility is certainly on the cards.


Forex-Time-LogoArticle by ForexTime

ForexTime Ltd (FXTM) is an award winning international online forex broker regulated by CySEC 185/12 www.forextime.com

Japanese Candlesticks Analysis 11.05.2022 (XAUUSD, NZDUSD, GBPUSD)

Article By RoboForex.com

XAUUSD, “Gold vs US Dollar”

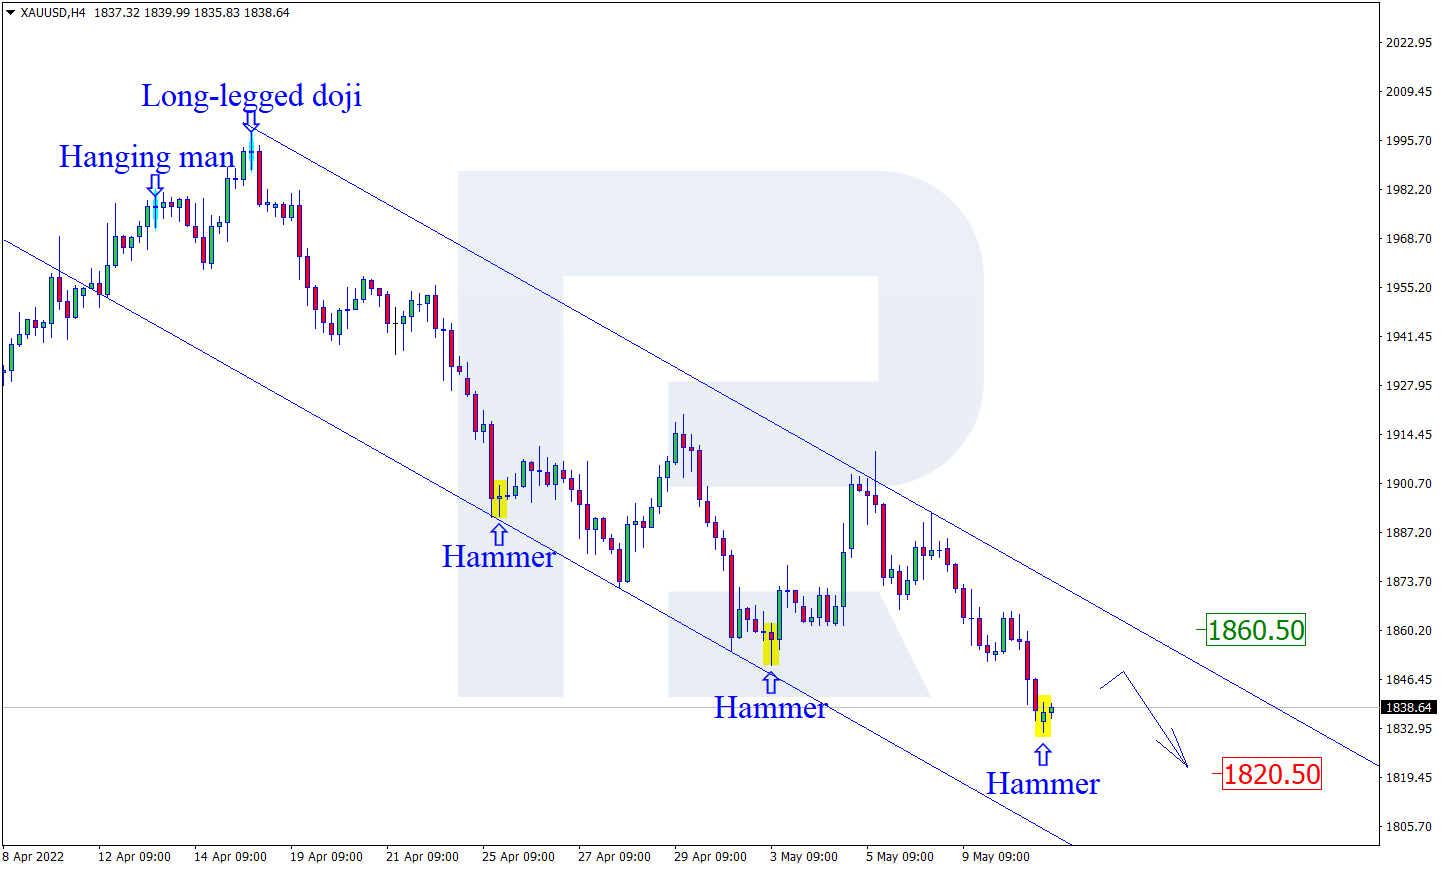
As we can see in the H4 chart, XAUUSD has formed a Hammer reversal pattern not far from the support area. At the moment, the asset is reversing in the form of another ascending impulse. In this case, the upside target may be the resistance level at 1860.50. At the same time, an opposite scenario implies that the price may fall to reach 1820.50 and continue the descending tendency without any pullbacks.

XAUUSD
Risk Warning: the result of previous trading operations do not guarantee the same results in the future

NZDUSD, “New Zealand vs US Dollar”

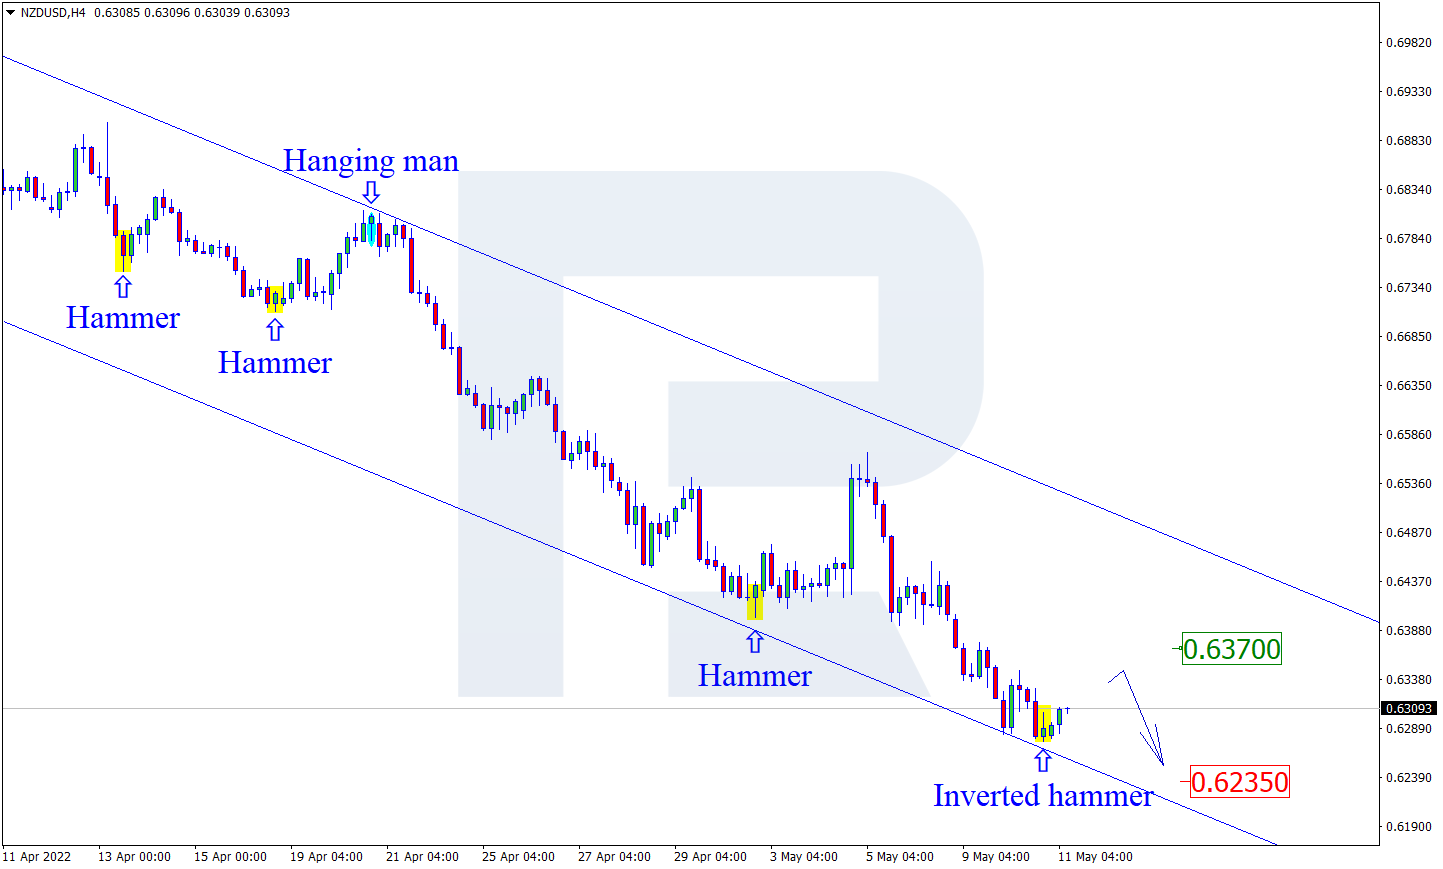
As we can see in the H4 chart, NZDUSD has formed an Inverted Hammer reversal pattern close to the support area. At the moment, the asset is reversing in the form of a new rising impulse. In this case, the upside target may be at 0.6370. After that, the asset may rebound from the resistance level and resume moving downwards. However, an alternative scenario implies that the price may fall to reach 0.6235 without any corrections.

NZDUSD
Risk Warning: the result of previous trading operations do not guarantee the same results in the future

GBPUSD, “Great Britain Pound vs US Dollar”

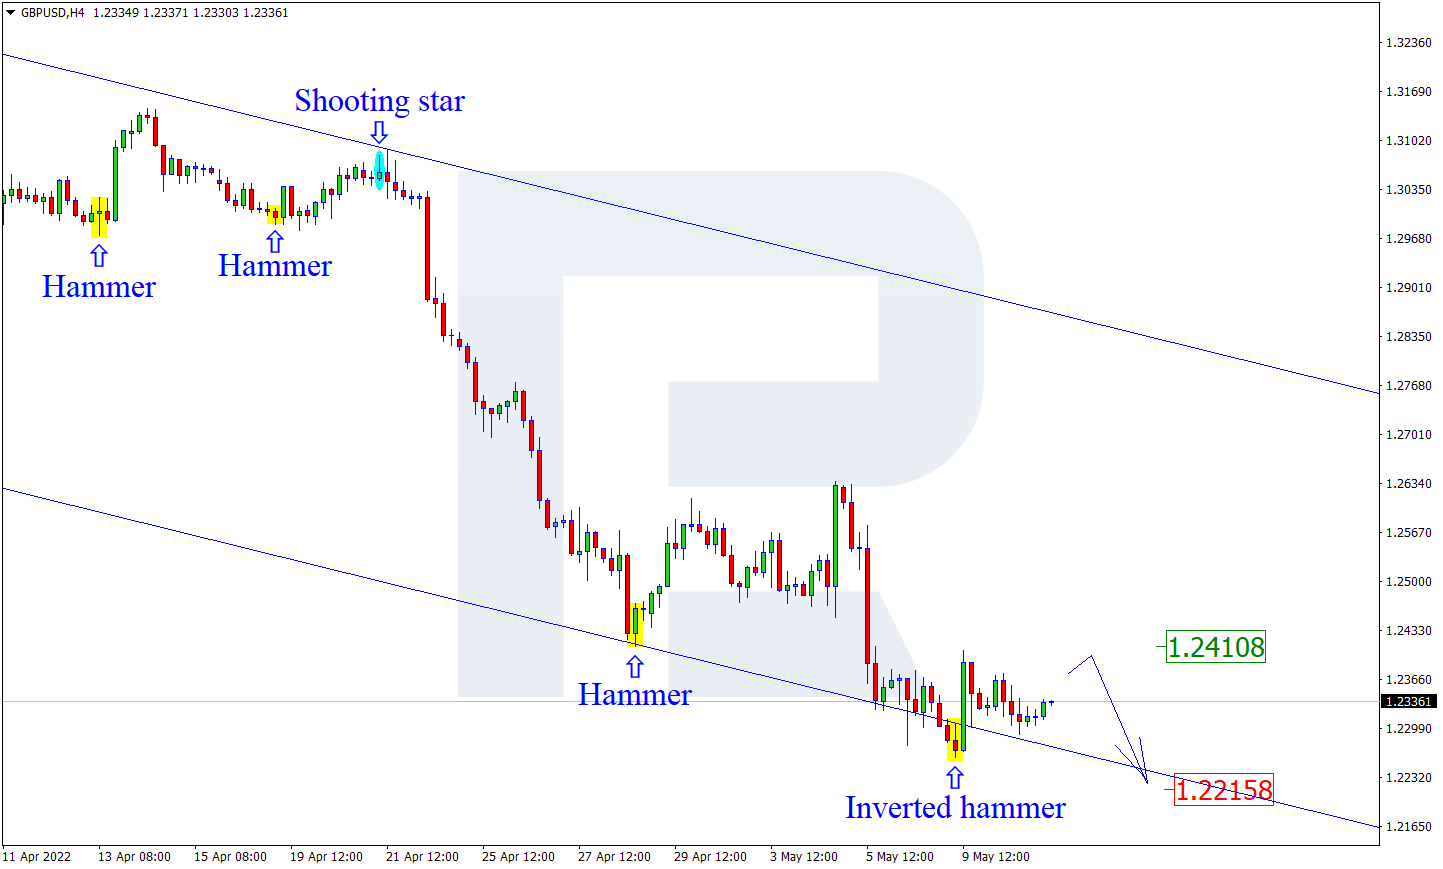
As we can see in the H4 chart, GBPUSD has formed an Inverted Hammer reversal pattern near the support level. At the moment, the pair is reversing and may form a new correctional impulse. In this case, the upside target correctional may be at 1.2410. After testing the resistance area, the market may rebound from it and resume trading downwards. Still, there might be an alternative scenario, according to which the asset may fall to reach 1.2215 without any pullbacks.

GBPUSD

Article By RoboForex.com

Attention!
Forecasts presented in this section only reflect the author’s private opinion and should not be considered as guidance for trading. RoboForex LP bears no responsibility for trading results based on trading recommendations described in these analytical reviews.

Ichimoku Cloud Analysis 11.05.2022 (GBPUSD, USDJPY, XAUUSD)

Article By RoboForex.com

GBPUSD, “Great Britain Pound vs US Dollar”

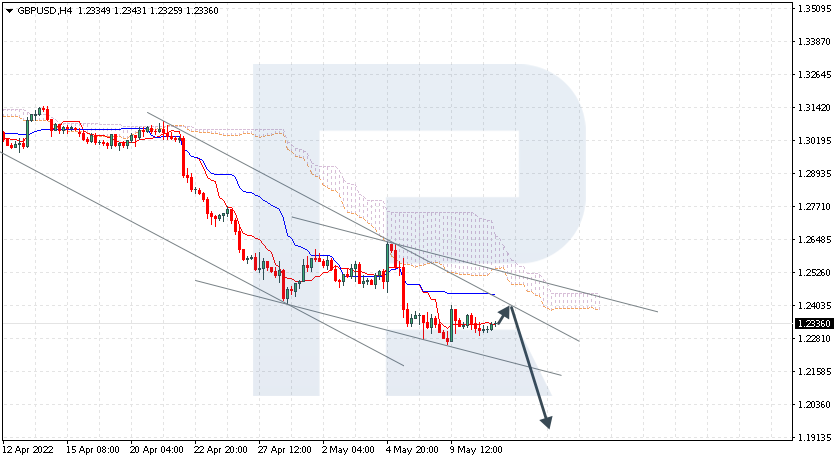
GBPUSD is rebounding from the resistance level. The instrument is currently moving below Ichimoku Cloud, thus indicating a descending tendency. The markets could indicate that the price may re-test Tenkan-Sen and Kijun-Sen at 1.2385 and then resume moving downwards to reach 1.1965 Another signal in favour of a further downtrend will be a rebound from the descending channel’s upside border. However, the bearish scenario may no longer be valid if the price breaks the cloud’s upside border and fixes above 1.2545. In this case, the pair may continue growing towards 1.2635. To confirm further decline, the asset must break the bearish channel’s downside border and fix below 1.2145.

GBPUSD
Risk Warning: the result of previous trading operations do not guarantee the same results in the future

USDJPY, “US Dollar vs Japanese Yen”

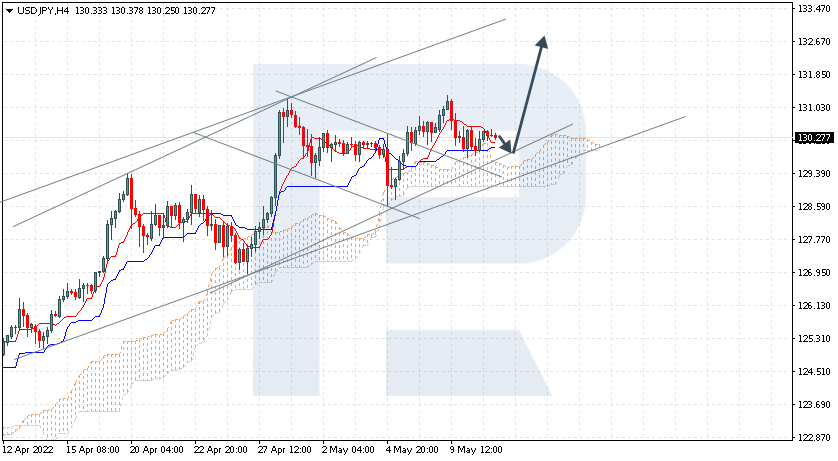
USDJPY is correcting within the bullish channel. The instrument is currently moving above Ichimoku Cloud, thus indicating an ascending tendency. The markets could indicate that the price may test Tenkan-Sen and Kijun-Sen at 130.05 and then resume moving upwards to reach 132.65. Another signal in favour of a further uptrend will be a rebound from the rising channel’s downside border. However, the bullish scenario may no longer be valid if the price breaks the cloud’s downside border and fixes below 128.45. In this case, the pair may continue falling towards 127.55.

USDJPY
Risk Warning: the result of previous trading operations do not guarantee the same results in the future

XAUUSD, “Gold vs US Dollar”

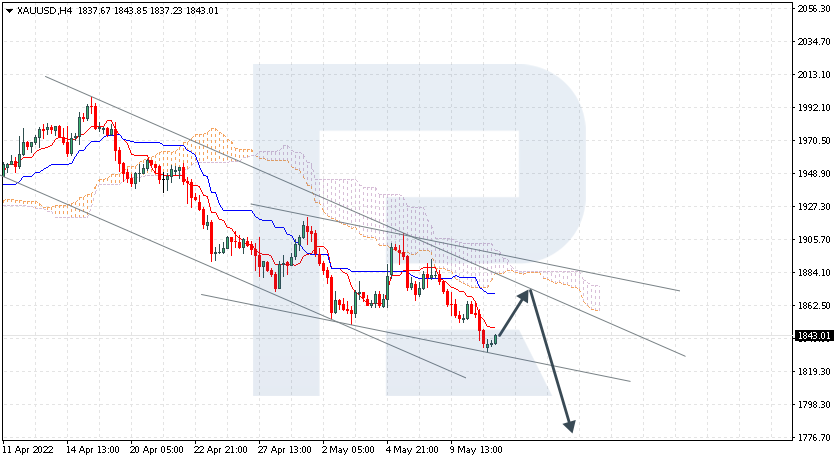
XAUUSD is rebounding from the bearish channel’s downside border. The instrument is currently moving below Ichimoku Cloud, thus indicating a descending tendency. The markets could indicate that the price may test Tenkan-Sen and Kijun-Sen at 1865.00 and then resume moving downwards to reach 1775.00. Another signal in favour of a further downtrend will be a rebound from the descending channel’s upside border. However, the bearish scenario may no longer be valid if the price breaks the cloud’s upside border and fixes above 1905.00. In this case, the pair may continue growing towards 1945.00.

XAUUSD

Article By RoboForex.com

Attention!
Forecasts presented in this section only reflect the author’s private opinion and should not be considered as guidance for trading. RoboForex LP bears no responsibility for trading results based on trading recommendations described in these analytical reviews.

The Analytical Overview of the Main Currency Pairs on 2022.05.11

by JustForex

The EUR/USD currency pair

Technical indicators of the currency pair:
  • Prev Open: 1.0553
  • Prev Close: 1.0529
  • % chg. over the last day: -0.23%

Today, investors and traders will closely monitor the April US Consumer Price Index for any signs that inflation may begin to cool off. Analysts expect annual inflation to fall to 8.1% (current level – 8.5%). Investors’ attention will also be focused on the inflation level in Germany, where analysts expect to see prices rise by 0.8%.

Trading recommendations
  • Support levels: 1.0535, 1.0453
  • Resistance levels: 1.0588, 1.0646, 1.0723, 1.0766, 1.0799, 1.0869, 1.0955

From the technical point of view, the trend on the EUR/USD currency pair on the hourly time frame is still bearish. The price forms a wide price corridor, the MACD indicator has become inactive, and volatility is reduced in anticipation of inflation data. Such narrowing of liquidity usually leads to sharp impulse movements. Under such market conditions, traders can look for sell deals from the resistance level of 1.0646, but only after the additional confirmation. Buy trades can be considered on intraday timeframes from the support level of 1.0453, but only with short targets and confirmation.

Alternative scenario: if the price breaks out through the 1.0723 resistance level and fixes above, the uptrend will likely resume.

EUR/USD
News feed for 2022.05.11:
  • – US FOMC Member Bostic Speaks at 02:00 (GMT+3);
  • – German Consumer Price Index (m/m) at 09:00 (GMT+3);
  • – Eurozone ECB President Lagarde Speaks at 11:00 (GMT+3);
  • – US Consumer Price Index (m/m) at 15:30 (GMT+3).

The GBP/USD currency pair

Technical indicators of the currency pair:
  • Prev Open: 1.2329
  • Prev Close: 1.2315
  • % chg. over the last day: -0.11%

The British pound has lost ground against the euro, where the ECB has not yet raised interest rates. This means that the Bank of England is losing control, as the Bank of England has already raised interest rates three times, while the ECB will raise rates only in the second half of the year. Bank of England spokesman Michael Saunders said yesterday that UK inflation is expected to peak at 9% annually. Analysts believe that the Bank of England failed in its forecasting and completely misinterpreted the causes of high inflation.

Trading recommendations
  • Support levels: 1.2276, 1.2127
  • Resistance levels: 1.2450, 1.2519, 1.2602, 1.2695, 1.2792, 1.2981, 1.3010, 1.3114

On the hourly time frame, the GBP/USD currency pair trend is still bearish. The price forms a wide price corridor, the MACD indicator has become inactive, and trading activity has decreased. Such liquidity narrowing, as a rule, leads to sharp impulse movements. Under such market conditions, sell trades should be looked for from the resistance level of 1.2450 or 1.2519 intraday. For buy deals, traders may consider the level of 1.2127 if the price continues to decrease after the inflation data.

Alternative scenario: if the price breaks down through the 1.2695 resistance level and fixes above, the mid-term uptrend will likely be resumed.

GBP/USD
There is no news feed for today.

The USD/JPY currency pair

Technical indicators of the currency pair:
  • Prev Open: 130.24
  • Prev Close: 130.43
  • % chg. over the last day: +0.15%

The Bank of Japan’s prolonged stimulus program has been increasingly criticized for fueling an unwanted yen drop. Investors are paying attention to the widening gap between ultra-low interest rates in Japan and rising rates in other major economies. The Bank of Japan’s ultra-soft policy allows the government to support huge spending despite Japan’s growing national debt. But the country’s inflation rate is already approaching the 2% target, so analysts believe that the soft monetary policy is close to ending.

Trading recommendations
  • Support levels: 129.42, 128.55, 127.29, 126.91, 126.00, 125.57
  • Resistance levels: 130.99

The medium-term trend on the USD/JPY currency pair is still bullish. The price is forming a wide price corridor, and the MACD indicator has become inactive. With a high probability, the situation will not change before the inflation data. Under such market conditions, it is best to look for buy deals, expecting the continuation of the uptrend. First of all, it is worth considering the support level of 129.42. A resistance level of 130.99 may be considered for sell deals, but only with additional confirmation and short targets.

Alternative scenario: If the price fixes below 128.55, the uptrend will likely be broken.

USD/JPY
There is no news feed for today.

The USD/CAD currency pair

Technical indicators of the currency pair:
  • Prev Open: 1.3012
  • Prev Close: 1.3028
  • % chg. over the last day: +0.12%

The Canadian dollar is a commodity currency and is highly dependent not only on the monetary policy of the Bank of Canada but also on the dynamics of the dollar index and oil prices. Oil prices continue to fall as tighter quarantine measures in Shanghai continue to raise demand concerns. This is negatively affecting the Canadian dollar.

Trading recommendations
  • Support levels: 1.2992, 1.2838, 1.2908, 1.2774, 1.2692, 1.2644, 1.2607, 1.2521
  • Resistance levels: 1.3044

The USD/CAD currency pair is bullish in terms of technical analysis. The price has reached the daily resistance level. The MACD indicator is in the positive zone, but the divergence of higher time frames is increasing. Trade is worth it only with short targets because, fundamentally, both the dollar index and the Canadian dollar are inclined to grow. Under such market conditions, it is better to look for buy trades on the lower timeframes from the support level of 1.2992, but only with additional confirmation. For sell deals, it is better to consider the resistance level of 1.3044, but it is also better with confirmation and short targets.

Alternative scenario: if the price breaks through and consolidates below 1.2693, the downtrend will likely be resumed.

USD/CAD
News feed for 2022.05.11:
  • – US Crude Oil Reserves (w/w) at 17:30 (GMT+3).

by JustForex


This article reflects a personal opinion and should not be interpreted as an investment advice, and/or offer, and/or a persistent request for carrying out financial transactions, and/or a guarantee, and/or a forecast of future events.

Investors expect a decline in US consumer inflation

by JustForex

Yesterday, the US indices traded cautiously and had no unified dynamics. By the close of the stock market, the Dow Jones index (US30) decreased by 0.26%, the S&P 500 index (US500) added 0.25%, and the NASDAQ Technology Index (US100) jumped 0.98%.

According to hedge fund strategists, investors are looking for signs of a potential peak in inflationary pressures, and if today’s data shows a decline in consumer prices, stock indices will show a strong rally. On the other hand, if the inflation data are worse than expected or there is a new acceleration of inflation, the stock market may see a strong sell-off.

The US Congress plans to allocate another $40 billion to Ukraine. The proposal for additional funding related to COVID-19, which some Democrats wanted to combine with emergency funding for Ukraine, will now be considered separately. On April 28, Biden asked Congress for $33 billion to support Ukraine, including more than $20 billion in military aid. The proposal was a dramatic escalation of US funding for the war with Russia.

Yesterday, US President Joe Biden said that the COVID-19 pandemic, combined with supply chain problems and Russia’s war with Ukraine, were to blame for the spike in inflation. The US government rushed trillions of COVID-19 bailouts and infrastructure spending into the economy.

Major European indices traded higher yesterday. Germany’s DAX (DE30) gained 1.15%, France’s CAC 40 (FR40) jumped by 0.51%, Spain’s IBEX 35 (ES35) closed at opening levels, and Britain’s FTSE 100 (UK100) increased by 0.37%. Germany’s inflation rate jumped to 7.4% year on year, the highest level since 1981. Over the last month, consumer prices added 0.8%. The acceleration of inflation includes rising energy prices following Russia’s invasion of Ukraine. Additional factors include delivery bottlenecks due to supply chain disruptions caused by the Covid-19 pandemic and notable price increases in the preceding stages of the economic process. ECB spokesman Madis Muller said today that the ECB’s current policy is inadequate at the current level of inflation. He added that the bond-buying program should end in early July or earlier, and the interest rate should be raised to positive levels this summer.

Oil prices continue to fall as tough quarantine measures in Shanghai continue to raise demand concerns. US President Joe Biden stressed yesterday that as the inflation surge had driven up annual consumer prices by more than 8%, the US is releasing oil from its strategic oil reserves and pressuring companies to return record-high profits to consumers in the form of lower prices.

Asian markets traded lower yesterday. Japan’s Nikkei 225 (JP225) decreased by 0.58%, Hong Kong’s Hang Seng (HK50) was down 1.84%, and Australia’s S&P/ASX 200 (AU200) fell by 0.98%. As the world’s second-largest economy remains under strict quarantine restrictions due to Covid-19, China’s growth prospects remain a challenge for global trade. China’s consumer price index increased to 2.1% y/y. Price growth for the month was 0.6%. In contrast, factory inflation declined from 8.3% to 8.0% y/y. The slowdown in PPI (factory inflation) was due to government measures to stabilize commodity prices and increase supply. On Tuesday, China’s state planner called for stabilization of energy prices and acceleration of oil and gas exploration and development. Beijing has planned daily coal production at 12.6 million tons this year and gives priority to energy security due to geopolitical uncertainty caused by Russia’s invasion of Ukraine.

Main market quotes:

S&P 500 (F) (US500) 4,001.05 +9.81 (+0.25%)

Dow Jones (US30) 32,160.74 -84.96 (-0.26%)

DAX (DE40) 13,534.74 +154.07 (+1.15%)

FTSE 100 (UK100) 7,243.22 +26.64 (+0.37%)

USD Index 103.91 +0.26 (+0.25%)

Important events for today:
  • – US FOMC Member Bostic Speaks at 02:00 (GMT+3);
  • – China Consumer Price Index (m/m) at 04:30 (GMT+3);
  • – China Producer Price Index (m/m) at 04:30 (GMT+3);
  • – German Consumer Price Index (m/m) at 09:00 (GMT+3);
  • – Eurozone ECB President Lagarde Speaks at 11:00 (GMT+3);
  • – US Consumer Price Index (m/m) at 15:30 (GMT+3);
  • – US Crude Oil Reserves (w/w) at 17:30 (GMT+3).

by JustForex


This article reflects a personal opinion and should not be interpreted as an investment advice, and/or offer, and/or a persistent request for carrying out financial transactions, and/or a guarantee, and/or a forecast of future events.

USOIL Ending Diagonal to Complete Intermediate Impulse

By Orbex

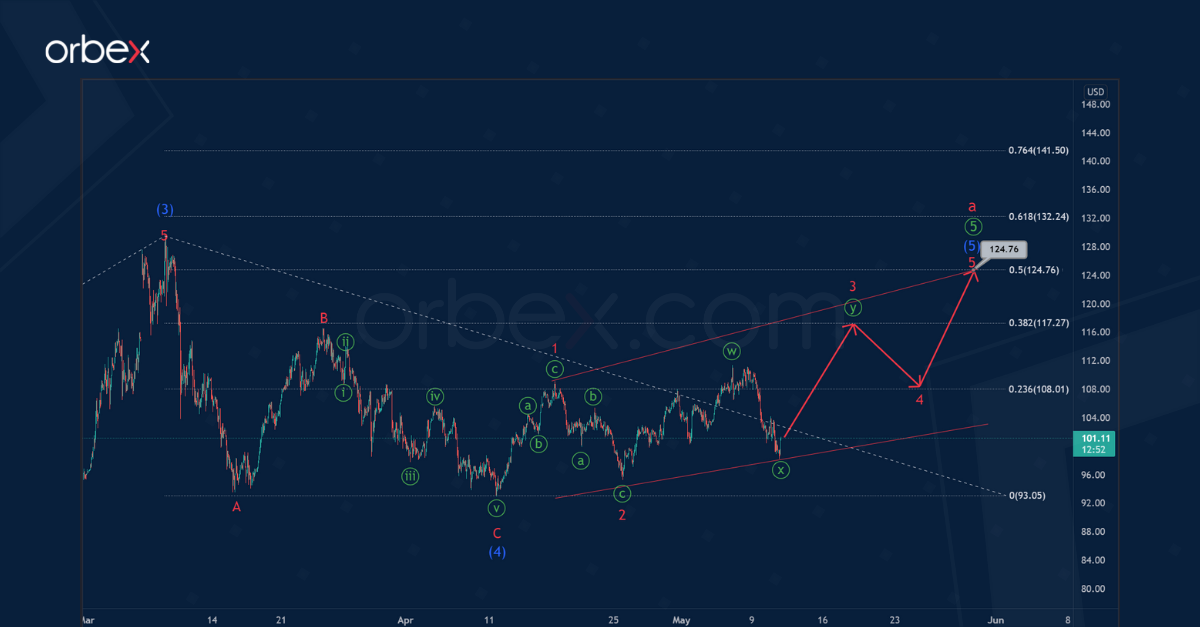
USOIL shows the development of the final part of the global impulse wave of the cycle degree. The final primary wave ⑤ takes the form of an intermediate impulse.

In early April, an intermediate correction wave (4) ended in the form of a minor zigzag. Prices then began to rise in the intermediate wave (5). We see that sub-waves 1 and 2 have a corrective structure. Thus, the entire wave (5) can take the form of an ending diagonal 1-2-3-4-5, as shown in the chart.

The end of this construction is possible near 124.76. At that level, wave (5) will be at the 50% Fibonacci extension of impulse (3). If this level is broken, prices could rise even higher to 132.24. At that level, wave (5) will be at 61.8% of impulse (3).

Let’s consider an alternative scenario in which the construction of the intermediate correction (4) has not completed yet. Perhaps it will have a horizontal triple three W-X-Y-X-Z pattern.

The minor sub-waves W-X-Y-X look completed. A downward movement is now likely in the actionary sub-wave Z. This could take the form of a minute simple zigzag ⓐ-ⓑ-ⓒ.

Oil prices could fall to 90.39. At that level, intermediate correction (4) will be at 61.8% of impulse (3).

After the end of the sideways movement, the market is likely to grow above the maximum of 129.56.

Test your strategy on how oil will fare with Orbex – Open your account now. 


Orbex-LogoArticle by Orbex

Orbex is a fully licensed broker that was established in 2011. Founded with a mission to serve its traders responsibly and provides traders with access to the world’s largest and most liquid financial markets. www.orbex.com


Five things that economists know, but sound wrong to most other people

By Renaud Foucart, Lancaster University 

Economists have shaped the modern world in many ways. Governments make policy choices in response to the data that we produce about things like GDP and inflation. Social media companies use our insights about human behaviour to create features that encourage people to use their platforms. And we’re at the heart of everything from incentivising renewables developers to build more wind farms to regulating the behaviour of tech giants like Google or Facebook.

Yet this is only one side of the story. A curious thing about our profession is that when we academic economists largely agree with each other on something important, the rest of the world often completely ignores our conclusions. Are these findings too counter-intuitive, too impractical, or something else? Here are five examples so that you can decide for yourself:

1. A lowest price guarantee means you will end up paying too much

Retailers make these kinds of price pledges all the time: if you find this item cheaper somewhere else, we will match the price. I see it everywhere from grocery stores to furniture shops to pharmacies. Yet while such a guarantee seems at first sight to benefit consumers, decades of evidence – from tyre retailers to grocery stores – shows that they are mostly a subtle way for retailers to collude on maintaining high prices.

When a retailer offers a low price, it mainly does it to attract consumers by being cheaper than its competitors. But by committing to a price match, each time your competitor offers a discount to your price, your customers know they can come to you and benefit from the same price. The competitor therefore has nothing to gain from offering a discount and prices remain high. Interestingly, it’s illegal for competitors to collude with one another to fix prices – yet price-matching effectively does exactly that, and it’s legal everywhere.

2. Housing subsidies given to tenants often benefit landlords

One of the first principles a student of economics learns is that people receiving a subsidy are not necessarily the ones who benefit from it. For example, in a study in France back in 2006, property owners were found to be pocketing more than three-quarters of housing subsidies being given to tenants.

The reason was that the subsidies motivated families to move into larger houses, and for students in those families to become independent earlier. Since the number of houses on the market remained fairly constant, the main effect of this extra demand was to increase rental prices both for larger homes and for student accommodation – thus transferring taxpayer money to those who needed it the least.

Compare this with a study of the effects of cuts to housing benefits in the UK in 2011-12. Households renting larger houses – in a reverse of what happened in France – demanded smaller ones, and this drove prices down and hurt landlords the most. On the other hand, the poorest households already lived in rental accommodation that was too small for their needs so could not realistically move to something smaller. For this reason, they had no choice but to absorb the benefits cut themselves.

In both the French and UK examples, instead of housing subsidies, the government should have simply given the renters money and let them decide what to do with it. That way, people would have chosen the most suitable accommodation and spent anything left over on other things, such as better food, education or healthcare.

3. Cost of living concerns are never a valid reason to avoid taxing pollution

Gas and fuel prices have soared following the Russian invasion of Ukraine. Motorists are having to pay much more to fill their tanks, while many households are struggling with their power bills.

To fight this crisis, European countries such as France have been offering fuel rebates to consumers. This helps people, but it is also great news for energy suppliers. In many cases the supplier is Russia, so it feeds directly into Vladimir Putin’s military budget and does nothing to help carbon emissions.

Most economists would instead place new tariffs on Russian oil to price in the cost of financing the war and induce businesses and consumers to switch to other energy sources whenever possible. The revenues raised by the tariffs can then be used to help people directly, be it by lowering other taxes or by financing social security.

In the UK, we are doing the exact opposite to this. Consumers are having to pay more national insurance while fuel duties are being cut.

4. Politicians are often more credible when they delegate

To convince people to trust you to do something, one solution is to take out of your hands the possibility of changing your mind later. This is why central banks are independent of governments: so that investors believe they are not playing with interest rates for electoral gains.

In most matters, however, governments are reluctant to delegate decision-making to independent institutions. In France, for instance, several governments spent billions of euros between 2009 and 2017 on the infrastructure needed to implement a tax on trucking, only to back down entirely in the run-up to the presidential election. Had the implementation of the tax been delegated to an independent agency, the fiasco would never have happened.

In another example, the UK recently launched the shared prosperity fund to replace EU-allocated funds to its poorest regions. The new system is much more centralised than before and it is hard to know how much previous funding will be matched. Centralised regional development funds can also be prone to favouritism and political patronage, which in the UK would reduce the credibility of the government in its plans to “level up” the country.

5. Investors consistently beating the market are probably doing something illegal

There is no magic formula to predict short-term changes in the value of a financial asset. Sure, some investments return more money than others, and financial bubbles certainly exist, but anyone asking you to trust them to make more money than the market in the long run is either lying or knows something the rest of the world does not.

If it’s the latter, we call it insider trading. This is illegal, although it still happens. During the 2008 financial crisis, for instance, politically connected investors who knew where the government would intervene made much more money than others did. Stories about financial geniuses may be much more appealing than these kinds of realities, but that doesn’t mean they are true.The Conversation

About the Author:

Renaud Foucart, Senior Lecturer in Economics, Lancaster University Management School, Lancaster University

This article is republished from The Conversation under a Creative Commons license. Read the original article.