By JustForex
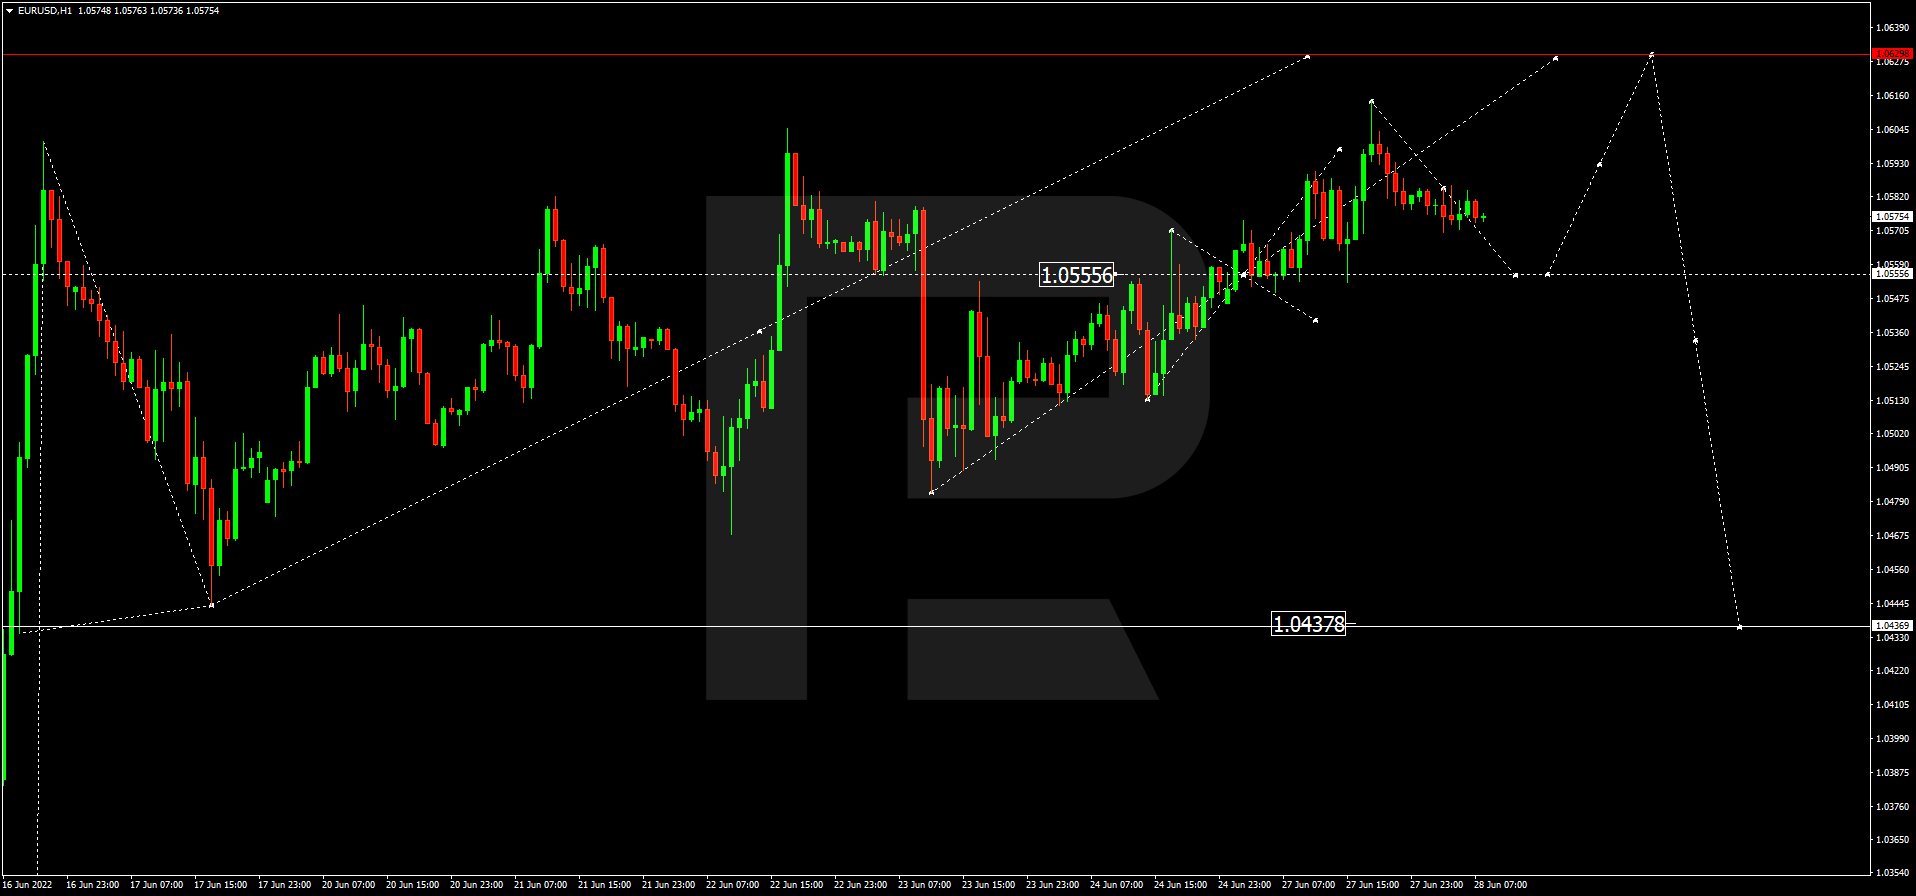
The EUR/USD currency pair
- Prev Open: 1.0582
- Prev Close: 1.0520
- % chg. over the last day: -0.59%
ECB head Christine Lagarde said nothing new in her speech at the Central Banks Forum. The net asset purchases will be completed on July 1. The ECB intends to raise interest rates in July for the first time in 11 years. The ECB will continue on the path of normalization and go as far as necessary to ensure inflation stabilizes at 2% in the medium term. Inflation in the Eurozone is projected to remain high for some time.
- Support levels: 1.0498, 1.0573, 1.0408, 1.0379
- Resistance levels: 1.0564, 1.0611, 1.0680, 1.0723
From the technical point of view, the trend on the EUR/USD currency pair on the hourly time frame is bearish. The price still forms a wide corridor, the MACD indicator has become negative, and new sellers’ initiative has appeared. Under such market conditions, sell deals can be considered from the resistance level of 1.0564, but only after the additional confirmation. Buy trades are best to look for on intraday time frames from the support level of 1.0498 or the lower border of the flat, but only with confirmation and short targets.
Alternative scenario: if the price breaks out through the 1.0611 resistance level and fixes above, the uptrend will likely resume.

- – Eurozone Spanish Consumer Price Index (m/m) at 10:00 (GMT+3);
- – US FOMC Member Mester Speaks (m/m) at 13:30 (GMT+3);
- – Eurozone German Consumer Price Index (m/m) at 15:00 (GMT+3);
- – US GDP (q/q) at 15:30 (GMT+3);
- – US Fed Chair Powell Speaks (m/m) at 16:00 (GMT+3);
- – Eurozone ECB President Lagarde Speaks (m/m) at 16:00 (GMT+3);
- – US FOMC Bullard Speaks (m/m) at 20:05 (GMT+3).
The GBP/USD currency pair
- Prev Open: 1.2264
- Prev Close: 1.2183
- % chg. over the last day: -0.66%
The Bank of England predicts that the UK economy will be negative in 2023, and KPMG predicts that the UK could fall into recession next year due to lower inflation. The Office for National Statistics reports that the average annual growth rate for the UK economy from 1998 to 2007 was 2.7%. From 2010 to 2019, it was 2%. The growth rate is projected to average up to 1.8% from 2023 to 2026. After the UK voted to leave the EU, there was a huge drop in investment, significantly affecting the pandemic recovery factor.
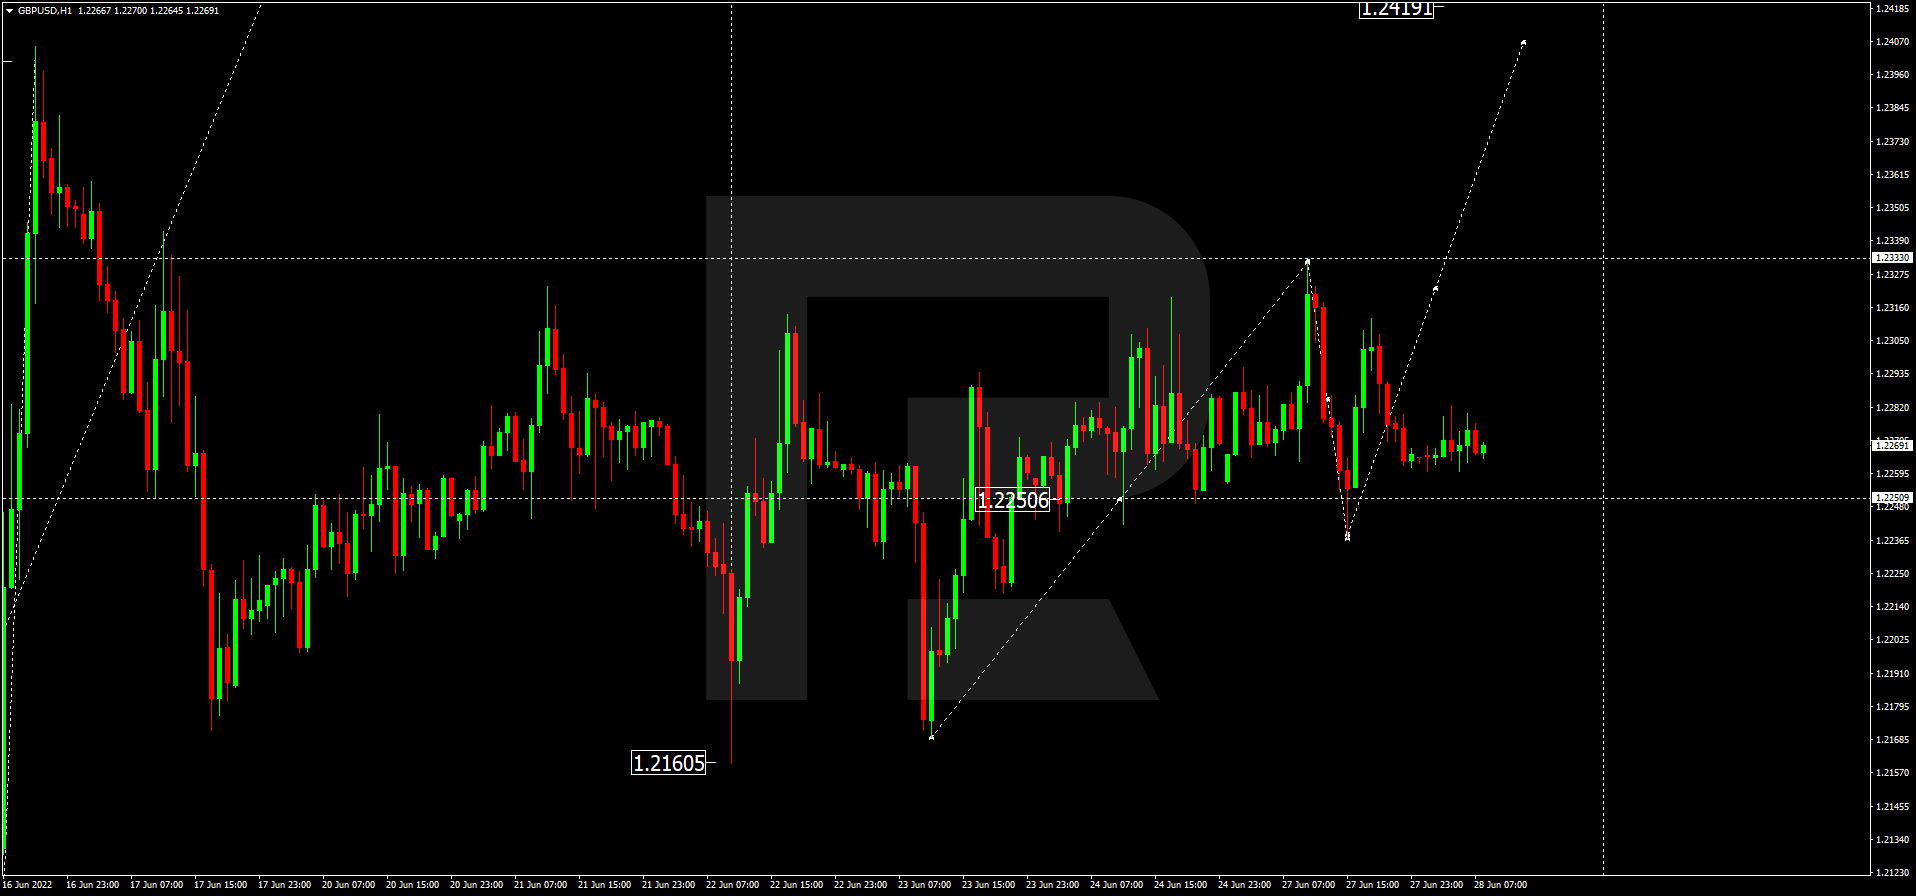
- Support levels: 1.2171, 1.2093, 1.1974
- Resistance levels: 1.2238, 1.2324, 1.2422, 1.2470, 1.2523, 1.2629
From the technical point of view, the trend on the GBP/USD currency pair on the hourly time frame is bearish. The situation is very similar to the euro. The price forms a wide corridor, while the MACD indicator does not show any activity, and there is a slight sellers’ pressure. Under such market conditions, sell deals can be considered from the resistance level of 1.2238 or the upper border of the flat at 1.2324, but only after the additional confirmation. Buy trades are best to look for on intraday time frames from the support level of 1.2171, but only with confirmation and short targets.
Alternative scenario: if the price breaks out through the 1.2422 resistance level and fixes above, the uptrend will likely resume.

- – UK BoE Gov Bailey Speaks (m/m) at 16:00 (GMT+3).
The USD/JPY currency pair
- Prev Open: 135.43
- Prev Close: 136.16
- % chg. over the last day: +0.54%
The fundamental picture of the currency pair USD/JPY remains the same. The divergent policies of the central banks have already caused the yen to fall to 20-year highs against the dollar. And since no changes are expected soon, analysts expect the growth of USD/JPY quotes to continue. The only thing that can reverse the uptrend is a currency intervention by the Bank of Japan. There are already talks about it.
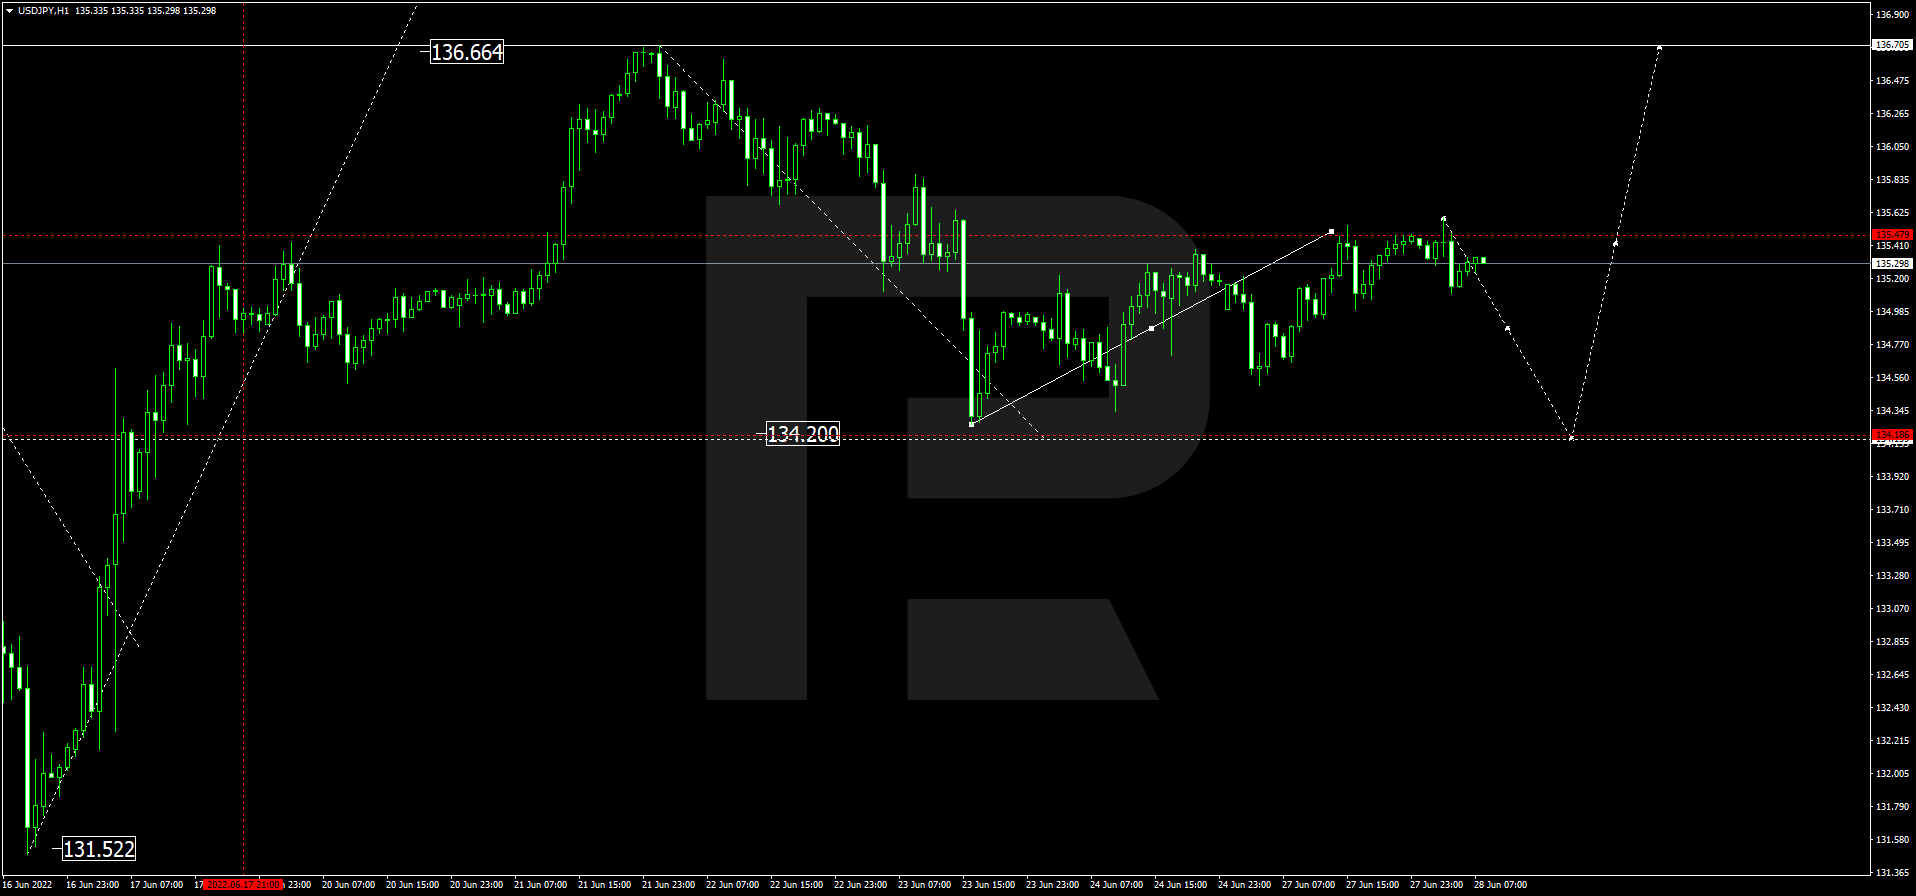
- Support levels: 135.41, 134.84, 133.35, 131.67, 131.00, 130.12, 129.48, 128.76
- Resistance levels: 136.66
The medium-term trend on the USD/JPY currency pair is bullish. There is a new initiative from the buyers. The MACD indicator has become positive. Under such market conditions, buy trades can be considered from the support level of 135.41, but with confirmation. A resistance level of 136.66 is good for sell deals, but only with additional confirmation and short targets.
Alternative scenario: if the price fixes below 133.35, the downtrend will likely resume.

- – Japan Retail Sales (m/m) at 02:50 (GMT+3).
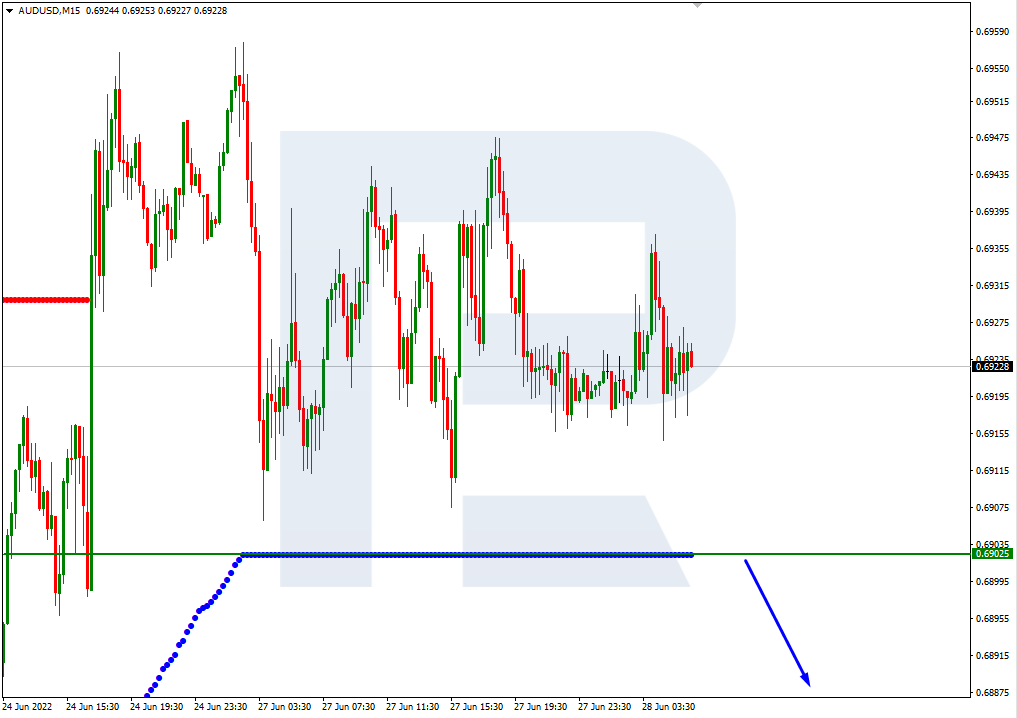
The USD/CAD currency pair
- Prev Open: 1.2873
- Prev Close: 1.2876
- % chg. over the last day: +0.02%
The Canadian dollar is a commodity currency, so it depends not only on the USD Index dynamics but also on the oil quotes. Both the dollar index and oil quotes increased yesterday. As a result, the price of USD/CAD started to form a corridor. It should be noted that both the Bank of Canada and the US Fed are on the way to raising the interest rates while oil prices remain high. All this suggests that no medium-term trends should be expected on the USD/CAD currency pair, as market conditions favor the strengthening of both the dollar index and the Canadian dollar.
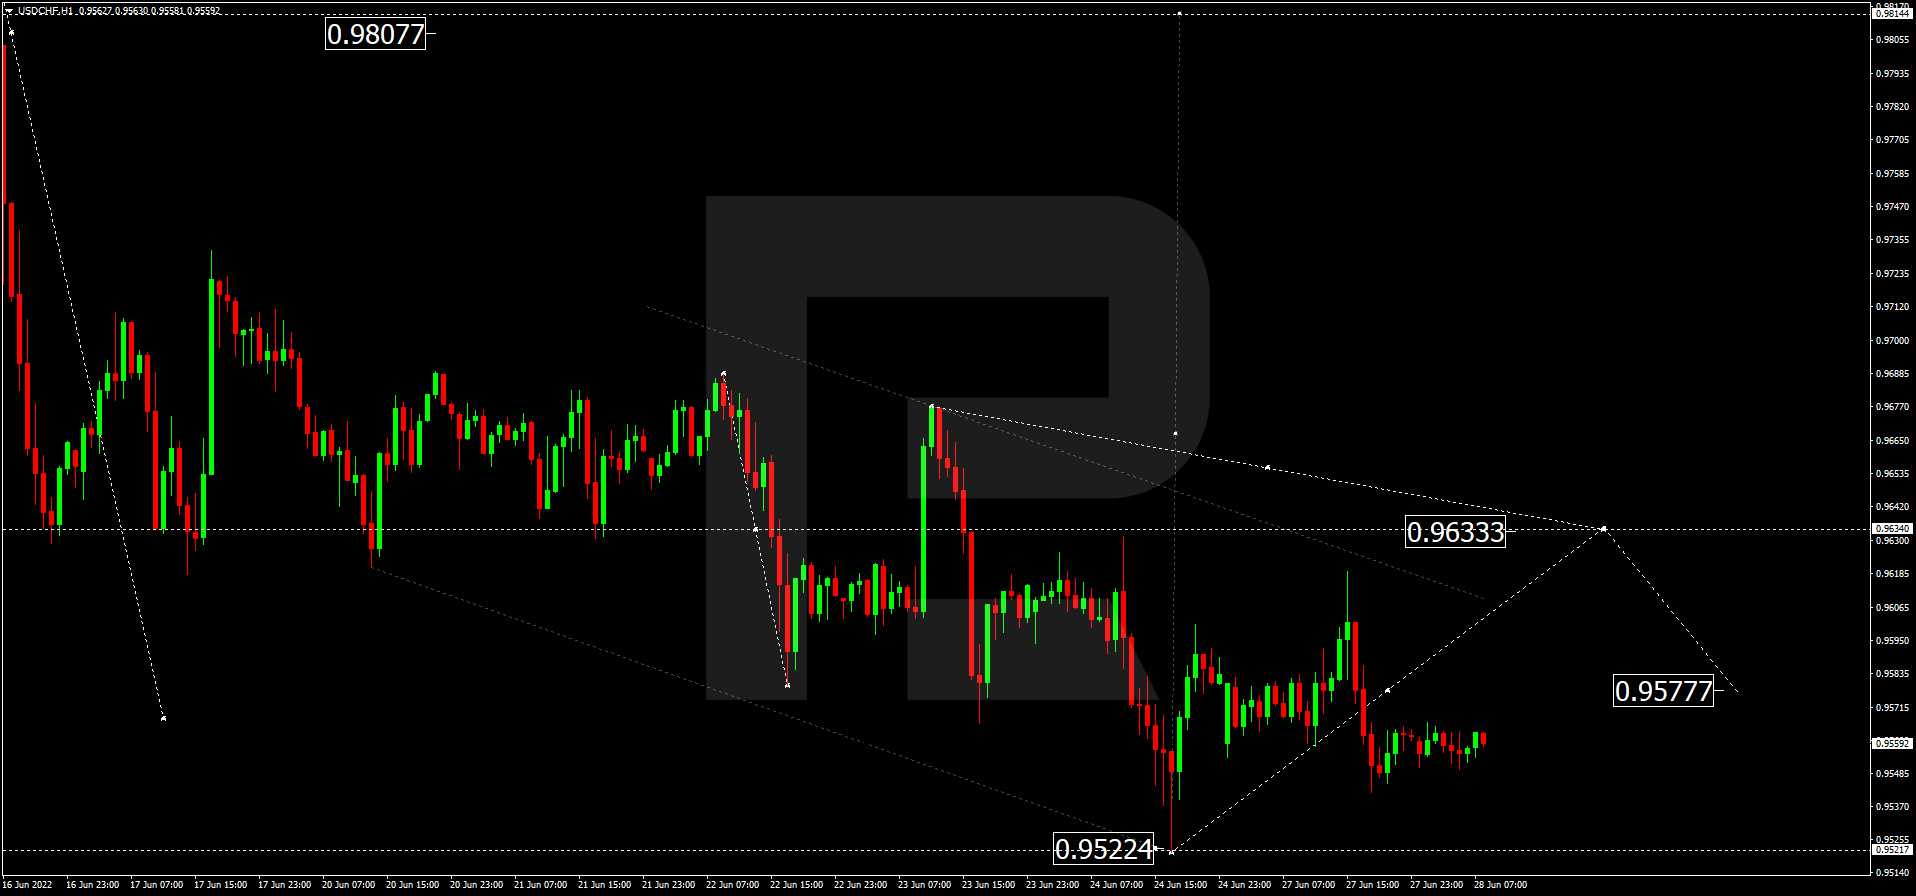
- Support levels: 1.2818, 1.2709, 1.2618, 1.2578, 1.2510
- Resistance levels: 1.2887, 1.2956, 1.3068
In terms of technical analysis, the trend on the USD/CAD currency pair is bullish. But the MACD indicator became negative, and the price is trading below the moving averages. Yesterday the price reached the priority change level, but the buyers could protect their positions. Under such market conditions, it is better to look for buy deals in the lower time frames from the support level of 1.2818, but with confirmation. For sell deals, it is better to consider the resistance level of 1.2956, but it is also better with confirmation and short targets.
Alternative scenario: if the price breaks through and consolidates below the 1.2818 support level, the downtrend will likely resume.

By JustForex
This article reflects a personal opinion and should not be interpreted as an investment advice, and/or offer, and/or a persistent request for carrying out financial transactions, and/or a guarantee, and/or a forecast of future events.