Russia’s oil is in long-term decline – and the war has only added to the problem

By Carole Nakhle, University of Surrey 

Immediately after Russia’s invasion of Ukraine, world oil prices jumped above US$100 per barrel, hitting US$130 for Brent crude on March 8. The prevailing fear was that substantial Russian supplies would be lost to the world market either through western sanctions or a voluntary decision by Moscow in retaliation to western support for Ukraine. This was especially worrying when the world was already struggling to secure enough additional oil to meet rapidly growing demand as the COVID restrictions began to ease.

The International Energy Agency (IEA), for example, predicted that “from April, three million barrels per day of Russian oil output could be shut in” – that’s about a third of the total. It feared that this could produce “the biggest supply crisis in decades”.

World oil prices (US$)
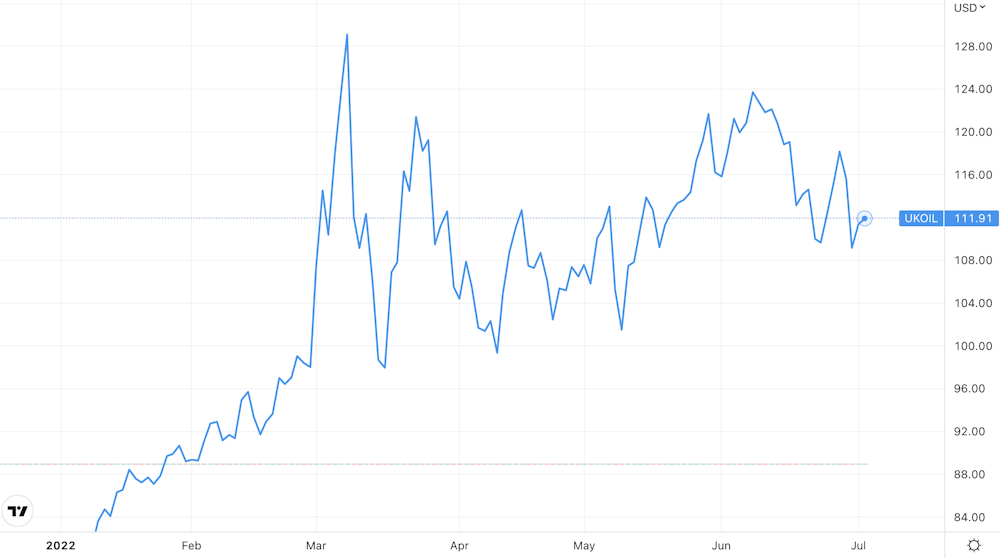
Brent crude chart
Brent crude prices, which are the leading global benchmark for world oil.
Trading View

Yet such forecasts turned out to be much too pessimistic. After more than four months of war, Russian oil and gas production is at close to the same level as when the war started. So why is this, and what can we expect in future?

Russia the energy power

Russia is “incredibly unimportant in the global economy except for oil and gas”, as the Harvard economist and former Obama adviser Jason Furman once said. It is only the 11th largest economy overall, despite being the third largest oil producer after the US and Saudi Arabia and second largest oil exporter after Saudi. It also sits on the largest proven gas reserves in the world, is the second largest producer after the US and the largest exporter.

In particular, Russia is the largest energy supplier to the EU, accounting for 27% of oil imports and 41% of gas. Second-placed Norway accounts for 7% and 16% respectively.

These simple facts explain why Russia matters for oil and gas markets, and why it was not easy for the EU to ban its imports as soon as the war started. Several other countries did impose restrictions: Canada became the first country to ban Russian crude oil imports, and then the US followed suit, banning all Russian oil, liquefied natural gas and coal from April.
The UK announced that it would phase out Russian oil imports by the end of the year. Many private buyers, primarily based in the west, also stopped buying for fear of reputational damage and getting caught in the sanctions minefield.

Yet despite all these restrictions, oil prices fell from their March highs (even though the war seems to have placed a floor of US$100 per barrel). This is partly due to the gloomier global economic outlook caused by raging inflation and rising interest rates, which is likely to reduce demand for oil. At the same time, however, the countries that rushed to ban Russian oil are not among its biggest consumers, which are China, Germany and the Netherlands.

Asian buyers also welcomed the “opportunity” to buy Russian crude oil at discounted prices: the main product, known as Urals, used to sell at around US$1 per barrel below Brent, but the gap is currently over US$30.

The IEA duly scaled back its forecasts. In its April report it expected Russian oil supply that month “to fall by 1.5 mb/d [million barrels per day]”, adding that around 3 mb/d would be off the world market from May. But in its May report, the agency estimated that Russian oil production declined by nearly 1 mb/d in April and that “losses could expand to around 3 mb/d during the second half of the year”. According to Russian sources, the country’s oil output rose 5% to 10.7 mb/d in June compared to around 11 million in January/February.

What next

After months of negotiations, the EU announced on June 3 an import ban on all Russian seaborne crude oil and petroleum products – effective in six months for crude oil and eight months for petroleum. Both Germany and Poland have also committed to halting pipeline imports, so 90% of Russian oil exports to the EU or 2.5 mb/d are going to be lost.

Again, however, a significant proportion will be captured by other buyers. In May, for instance, China’s oil imports from Russia reached a record of 2 mb/d, and Russia overtook Saudi Arabia as China’s largest supplier. India has also boosted its purchases of Russian oil since the war started. China and India are the world’s two largest net oil importers, and China is the second largest oil consumer after the US.

In total, the US Energy Information Administration (EIA) assumes that about 80% of the crude oil subject to the EU import ban will find alternative buyers, mainly in Asia. As long as sanctions are not imposed by all the major oil importers, Russian oil will continue to find buyers.

This explains the considerable variation in estimates of how much Russian oil will be lost to the world market, particularly in the short-term – from as little as 0.25 mb/d by Opec to 3 mb/d by Goldman Sachs.

In the longer term, however, assuming the western boycott is maintained and even tightened, the loss will become more notable. Even before the war, the Russian government’s own forecasts expected its oil and gas production to be undermined both by depleting reserves and the effects of the technological and economic sanctions imposed by the west after the 2014 Crimea invasion. Even its most optimistic scenario predicted a short-term modest increase in oil production and then plateauing from 2024 to 2035. In the more conservative scenario, oil production was expected to decline.

Since the war began, many western oil companies, which typically bring capital and technology, have exited Russia. In a country with complex reservoirs, ageing fields and a hostile climate, the lack of investment and access to technology will accelerate the long-term decline.

The global market will ultimately accommodate such an outcome, as other supplies become available and demand responds to prices, but Russia will have to live with a shrinking market share and diminished influence on global oil markets. This will make it much harder for Moscow to finance future wars. It also means that the Russians are going to have to diversify their economy at a time when a substantial slice of the world will no longer do business with them.The Conversation

About the Author:

Carole Nakhle, Energy Economist, University of Surrey

This article is republished from The Conversation under a Creative Commons license. Read the original article.

 

EURUSD Crumbles To 20-Year Low

By ForexTime

Euro bears went on a rampage today, dragging the EURUSD to levels not seen in 20 years as traders cut bets on European Central Bank (ECB) rate hikes!

The heavy sell-off was triggered by soft economic data from France which not only darkened the already gloomy outlook but fanned fears of a recession in Europe. With ongoing geopolitical tensions obstructing the ECB’s ability to aggressively raise rates like the Fed, the widening interest rate differentials could fuel the EURUSD selloff.

According to Bloomberg, there is now a 60% chance of the parity dream becoming reality by the end of 2022. The last time the EURUSD was parity was back in the first trading week of December 2002.

Before we take a dive into the technicals, it is worth keeping in mind that the euro has depreciated against most G10 currencies today. With the fundamentals swinging in favour of bears, euro weakness could become a key theme this quarter. Although the EURUSD remains our focus, the latest selloff could present fresh opportunities across other euro crosses.

EURUSD breaches critical support…

The EURUSD has cut through the 1.0350 support like a hot knife through butter.

Prices are heavily bearish on the daily charts as there have been consistently lower lows and lower highs. Bears have a lot of freedom below 1.0350 due to the absence of any key support levels. The next level of interest can be found at 1.0200 and 1.0000. If prices are able to push back above 1.0350, then the EURUSD could retest 1.0480.

EURJPY approaches 50-day SMA

After failing to conquer the 144.00 resistance level, the EURJPY could be experiencing a bearish reversal with the breakdown under 141.50 signalling further downside. A weaker euro could drag the EURJPY towards the 138.00 support level. Should bears secure a strong daily close under this point, the next level can be found around 134.50.

EURGBP choppy as ever…

There was some action on the EURGBP as prices spiked below the 0.8580 support level before pulling back higher. This currency pair remains a battleground for bulls and bears. Although the overall trend point north, resistance can be found around 0.8680. A daily close below 0.8580 may encourage a selloff towards 0.8500 and 0.8440.

EURAUD wobbles above support

The EURAUD could be gearing up for a breakdown below the 1.5150 support.

It’s been trapped within a range over the last 2 weeks with the pressure growing by the day. Yesterday’s bearish candle suggests that a selloff could be around the corner with 1.5150 acting as the gatekeeper. A breakdown below this level may open the doors towards 1.4900 and 1.4770. Should 1.5150 prove to be reliable support, a move back to 1.5300 could be on the cards.


Forex-Time-LogoArticle by ForexTime

ForexTime Ltd (FXTM) is an award winning international online forex broker regulated by CySEC 185/12 www.forextime.com

Misguided geopolitics is derailing decades of globalization

By Dan Steinbock

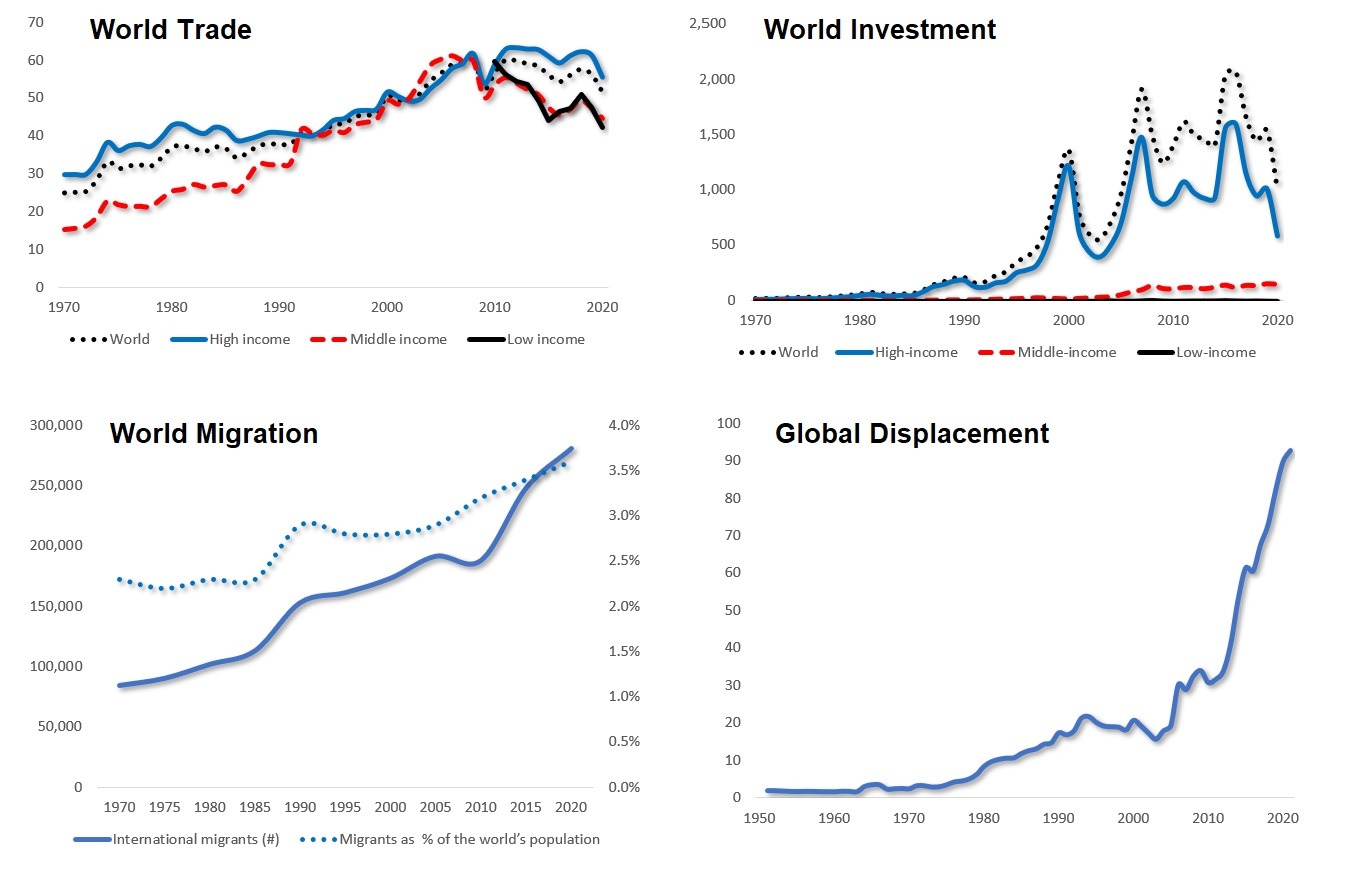
– Over the past decade, global economic prospects have been penalized by the fall of world trade, investment and migration, coupled with the unwarranted suffering of over 100 million globally displaced. It’s a prologue to an untenable future.

The postwar wave of globalization benefited mainly the advanced economies. It was only after 1980 that some large developing countries, particularly China, broke into world markets for manufactured goods and services, while also attracting foreign capital. This era of globalization eclipsed with the global recession in 2008.

As the G20 cooperation subsequently dimmed, so did global growth prospects, too.

Between November 2008 and 2016, global imbalances steadily worsened as a result of increasing trade discrimination. It was only in 2017 that there were some signs of trade recovery.

Yet, that historical opportunity was missed with the U.S. trade wars, followed by waves of COVID19 pandemic, the consequent global depression and nascent Cold Wars.

Global economic integration is often measured by world trade, investment and migration, although technology and finance could be added to the list.

The net effect of the past decade? Plunging trade and investment, slowing migration and explosion of global displacement.

Falling world trade

In particular, the fleeting gains of the U.S.-Sino trade truce were derailed by the global pandemic that caused both services and goods trade to contract by 30 percent in mid-2020. Subsequent gains have been penalized by new waves of pandemic variants and the worsening international economic landscape.

Last year, the World Trade Organization (WTO) anticipated global merchandise trade volume to grow by 10.8 percent, followed by a 4.7 percent rise in 2022. But these projections were unlikely to materialize even before the Ukrainian crisis.

Progress since the plunge of 2008 has been largely reversed. Trade as percentage of world GDP has fallen back to the level where it was over 15 years ago. Geopolitics derailed the potential for global recovery well before the pandemic, due to protectionism and new Cold Wars, compounded by the Russia sanctions.

Plunging world investment

Before the 2008 global crisis, world investment soared to almost $2 trillion. But the hoped-for rebound proved a pipe-dream, due to the tariff wars and the pandemic. High-income economies play a critical role in world inward investment flows. Yet, even before the Ukrainian crisis, world investment had plunged to a level which was first reached already in the late 1990s.

In 2020, global flows of FDI fell by one third to $1 trillion. That’s below the low of the 2008 crisis, and half of world investment in 2007.  Decades of progress have been reversed in just few years.

Globalization undermined

Sources: Difference Group and a. Trade as average of exports and imports; and as % of GDP (World Bank/OECD; b. FDI Inward Flows in $ billions (UNCTADSTAT). c. UN/IOM, d. UNCHR

In the process, the poorest economies have been hurt the most. And that pain is only about to begin.

Slower migration

Over the last two decades, the number of international migrants has climbed to 281 million people. Yet, global migration has been slowing since 2008, particularly in advanced economies. Due to the pandemic, the stock of international migrants has increased only by 2 million; a fourth less than expected by mid-2020.

Let’s put these figures in historical context.

Between 1870 and 1914, some 10 percent of the world population migrated in search for a better life. While the absolute number of international migrants has over tripled in the past half a century, their relative share stayed below 2 percent until 2010 and is today 3.6 percent of world population; a third of what it was a century ago.

Explosion of global displacement

And as migration flows decelerate or are being blocked, the number of globally displaced has exploded, compounded by the post-9/11 wars and external interventions since the Arab Spring, which the West initially saw as the prelude to “democratization” in the Middle East, a bit like the devastated Ukraine today.

As a net effect, the number of forcibly displaced has more than doubled in the past decade. The Ukraine crisis alone is projected to internally displace up to 6.7 million people and 4 million displaced abroad.

Despite COVID-19 mobility restrictions, the total figure exceeded 92 million at the year-end of 2021 and has recently soared over 100 million.

In other words, the number of the globally displaced is soon over twice as high as it was after two world wars, the Holocaust, and Hiroshima and Nagasaki in 1945.

If that’s the outcome of “peacetime conditions,” one shudders with horror the effect of wartime conditions in the early 21st century.

A prelude to darker futures?

In the past half a decade, the costs of missed opportunities amount to trillions of dollars. Given continuing policy mistakes, worse looms ahead.

Growth scenarios that still seemed likely in early 2022 will not materialize because they were projected in fall 2021, when

  • a truce subdued the U.S.-Sino trade war;
  • Ukraine’s proxy conflict had not yet erupted;
  • Sanctions targeting the world’s 11thlargest economy, the largest natural gas producer and third-largest oil producer, had not yet been launched.
  • And the Federal Reserve had not initiated its aggressive rate hikes and quantitative tightening, which will cause lost years in the West and lost decades in the Global South.

As long as current policies remain in place in the West, sanctions will undermine U.S. growth, destabilize the Russian economy, penalize the fragile Euro area and slow Chinese growth – all of which will have an adverse impact on economic prospects in South and Southeast Asia.

The Global South will pay much of the bill; in economic costs and human lives.

The longer the unwarranted stagnation will prevail, the greater the likelihood that current Cold Wars will turn into Hot Wars, at the cost of future generations, even our planet.

That’s something that none of us may want. But it is the net effect of shortsighted policies in the prosperous West.

About the Author:

Dr. Dan Steinbock is an internationally recognized strategist of the multipolar world and the founder of Difference Group. He has served at the India, China and America Institute (US), Shanghai Institutes for International Studies (China) and the EU Center (Singapore). For more, see https://www.differencegroup.net 

Versions of this commentary have been published by multiple major dailies around the world. It is based on a report recently published by the Austrian National Bank (OeNB) and the Austrian Federal Economic Chamber (WKÖ). See also https://www.differencegroup.net


Global water scarcity is ‘code red’ for humanity, the answer is private finance

By George Prior 

– Half the world is now facing droughts, floods and filthy water – and the problem urgently requires huge amounts of private finance, warns the CEO of one of the world’s largest independent financial advisory, asset management and fintech organizations.

The warning from deVere Group’s Nigel Green comes as Italy declares a state of emergency amid the worst drought in 70 years.

Elsewhere, Lake Mead, the largest reservoir in the United States, which provides water for tens of millions of people and countless acres of farmland in the southwest, is now just one-quarter full.

Meanwhile, once again Sydney is flooded as the impact of the climate crisis becomes the new normal for Australia’s most populous state.

Nigel Green says: “There’s no doubt that all around the world the fallout of the growing climate crisis is accelerating.

“The UN’s Intergovernmental Panel on Climate Change has warned in a report that more than half the world’s population faces water scarcity for at least one month every year, others will be hit by regular severe floods, previously only seen once-in-a-generation, while others have access to only dirty water.

“This is now being played out in real-time every time you look at the news.”

He continues: “A failure to get a grip on this emergency is going to produce catastrophic, irreversible consequences later.

“The response will require political and social determination on a global scale.

“But, critically, it will also require tens of trillions of dollars. As governments alone cannot afford this now, especially with slowing economic growth amongst other headwinds, the solutions demand private financing.”

As such, notes the deVere Group CEO, the financial sector needs now needs to become more proactive to “unleash and mobilize” the funds required.

He is calling for never-before-seen levels of cooperation between financial advisories, insurance firms, banks, wealth and asset managers, investment companies, fintech groups, banks, and auditors in the fight against climate change.

“Governments around the world have proven themselves to be slow – at best – at responding to the urgent ‘code red’ situation’ we’re facing.

“Therefore, the financial industry must step-up. If we don’t, the level of funding will not be available, nor at the pace necessary, to mitigate human-created global warming.”

Nigel Green concludes: “Climate change is the greatest risk multiplier to our planet, to our communities, and to our way of life.

“It will take huge amounts of private financing to halt its impact.

“The onus now falls on the financial sector to help mobilize and unlock the necessary funds through education and robust, impactful investment solutions.”

About:

deVere Group is one of the world’s largest independent advisors of specialist global financial solutions to international, local mass affluent, and high-net-worth clients.  It has a network of more than 70 offices across the world, over 80,000 clients and $12bn under advisement.

Ichimoku Cloud Analysis 05.07.2022 (EURUSD, BRENT, NZDUSD)

Article By RoboForex.com

EURUSD, “Euro vs US Dollar”

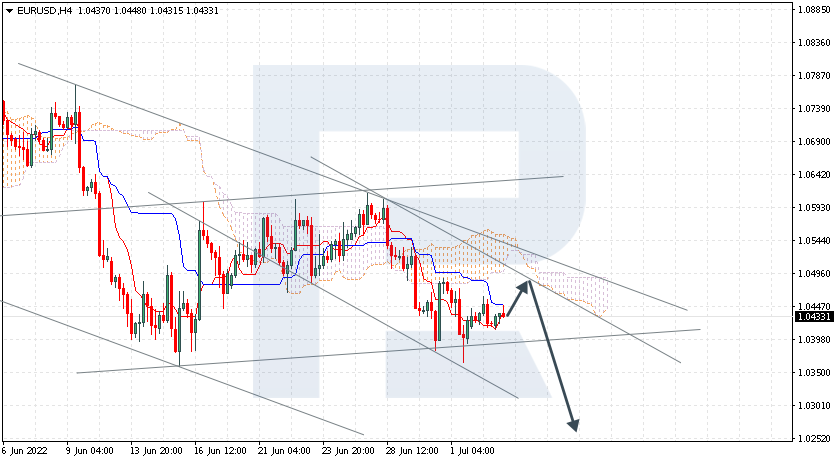
EURUSD is rebounding from Tenkan-Sen and Kijun-Sen. The instrument is currently moving below Ichimoku Cloud, thus indicating a descending tendency. The markets could indicate that the price may test the cloud’s downside border at 1.0465 and then resume moving downwards to reach 1.0255. Another signal in favour of a further downtrend will be a rebound from the descending channel’s upside border. However, the bearish scenario may no longer be valid if the price breaks the cloud’s upside border and fixes above 1.0585. In this case, the pair may continue growing towards 1.0675. To confirm further decline, the price must break the rising channel’s downside border and fix below 1.0385.

EURUSD
Risk Warning: the result of previous trading operations do not guarantee the same results in the future

BRENT

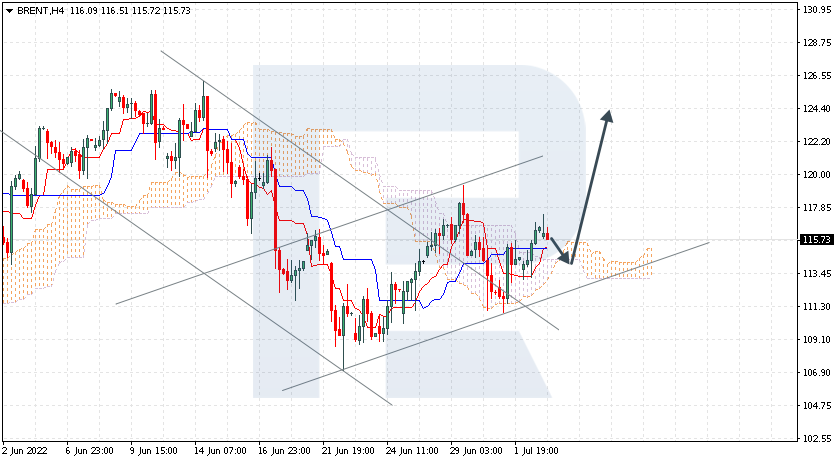
Brent is testing the resistance level. The instrument is currently moving above Ichimoku Cloud, thus indicating an ascending tendency. The markets could indicate that the price may test the cloud’s upside border at 115.15 and then resume moving upwards to reach 124.45. Another signal in favour of a further uptrend will be a rebound from the rising channel’s downside border. However, the bullish scenario may no longer be valid if the price breaks the cloud’s downside border and fixes below 111.05. In this case, the pair may continue falling towards 109.55.

BRENT
Risk Warning: the result of previous trading operations do not guarantee the same results in the future

NZDUSD, “New Zealand Dollar vs US Dollar”

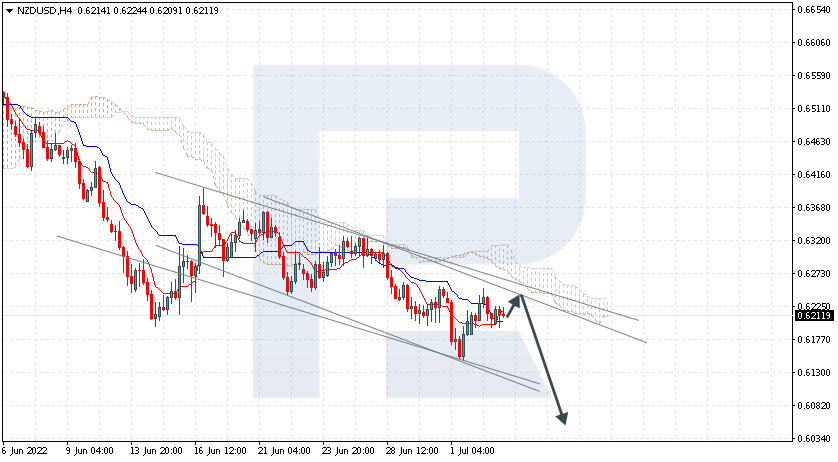
NZDUSD is correcting within the bearish channel. The instrument is currently moving below Ichimoku Cloud, thus indicating a descending tendency. The markets could indicate that the price may test the cloud’s downside border at 0.6230 and then resume moving downwards to reach 0.6075. Another signal in favour of a further downtrend will be a rebound from the descending channel’s upside border. However, the bearish scenario may no longer be valid if the price breaks the cloud’s upside border and fixes above 0.6320. In this case, the pair may continue growing towards 0.6415.

NZDUSD

Article By RoboForex.com

Attention!
Forecasts presented in this section only reflect the author’s private opinion and should not be considered as guidance for trading. RoboForex LP bears no responsibility for trading results based on trading recommendations described in these analytical reviews.

Japanese Candlesticks Analysis 05.07.2022 (EURUSD, USDJPY, EURGBP)

Article By RoboForex.com

EURUSD, “Euro vs US Dollar”

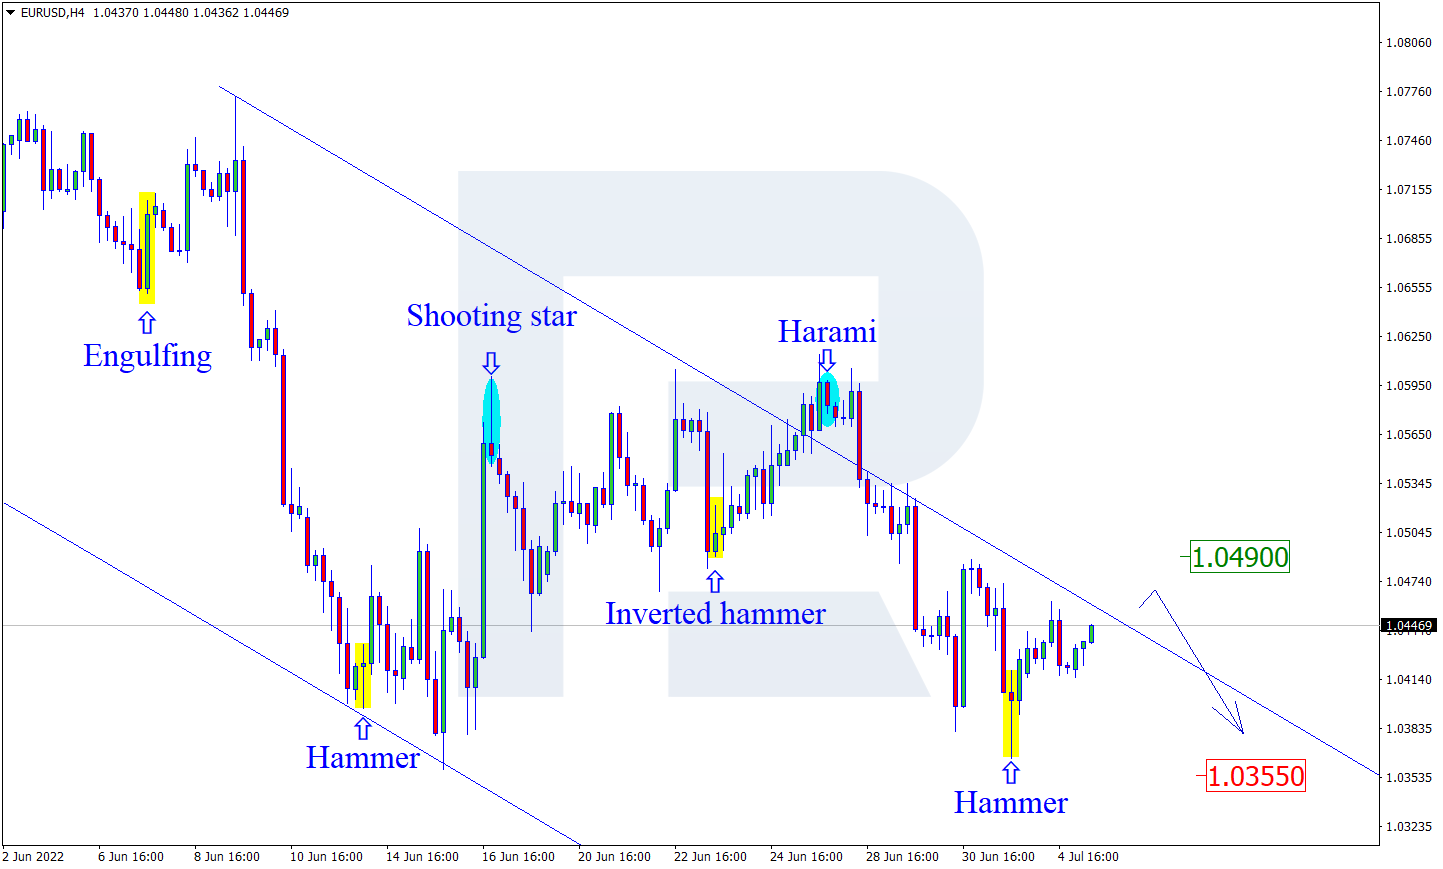
As we can see in the H4 chart, the asset has formed a Hammer reversal pattern close to the support area. At the moment, EURUSD may is reversing in the form of another ascending impulse. In this case, the upside target may be at 1.0490. However, an alternative scenario implies that the price may fall to reach 1.0355 and continue the downtrend without testing 1.0490.

EURUSD
Risk Warning: the result of previous trading operations do not guarantee the same results in the future

USDJPY, “US Dollar vs Japanese Yen”

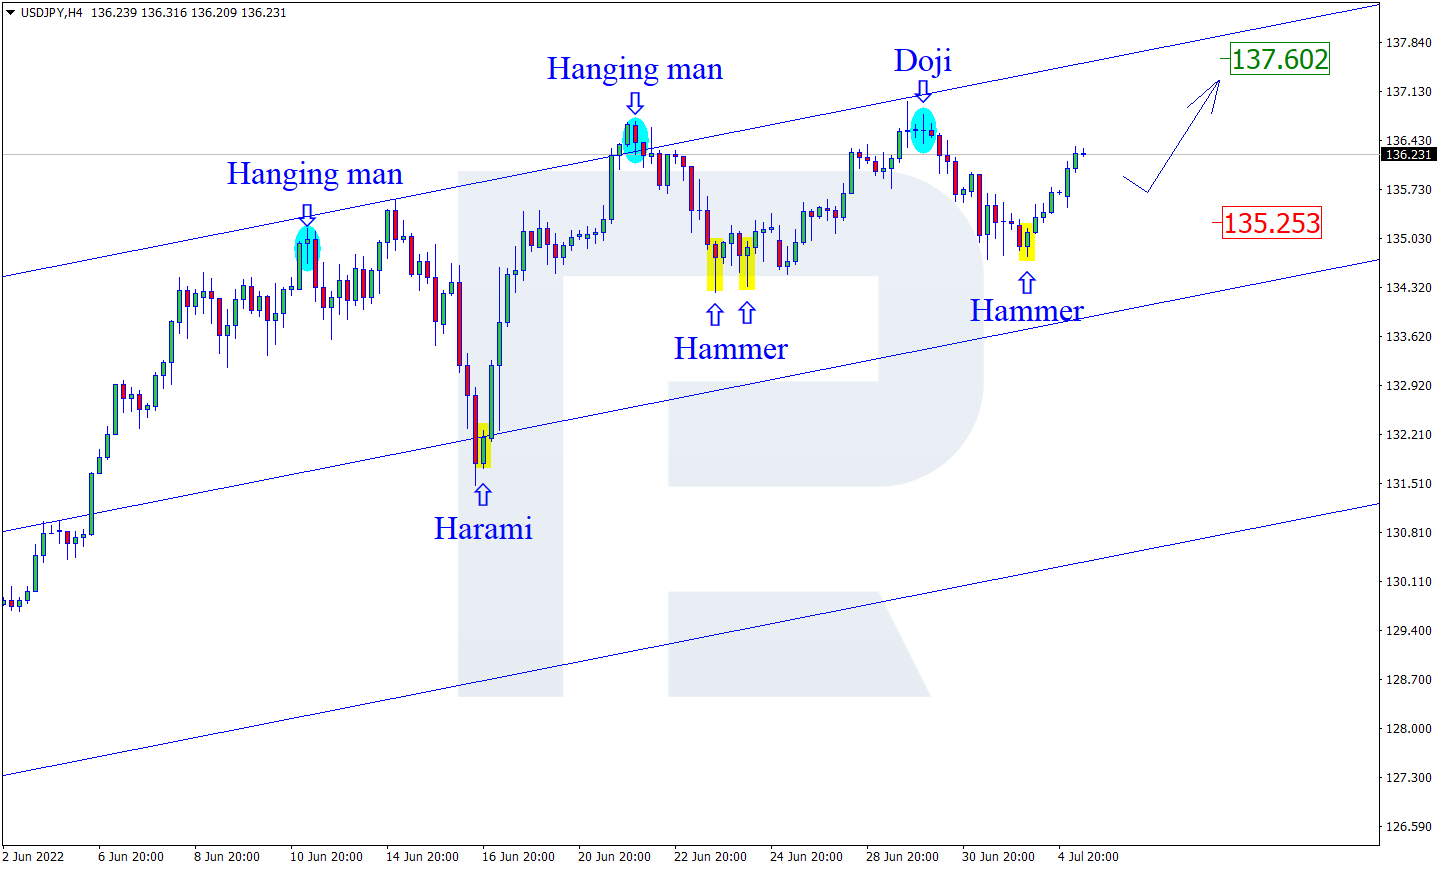
As we can see in the H4 chart, USDJPY has formed several reversal patterns not far from the support area, such as Hammer. At the moment, the asset may reverse in the form of a new ascending impulse. In this case, the upside target may be at 137.60. At the same time, an opposite scenario implies that the price may correct to reach 135.25 and continue the uptrend only after the pullback.

USDJPY
Risk Warning: the result of previous trading operations do not guarantee the same results in the future

EURGBP, “Euro vs Great Britain Pound”

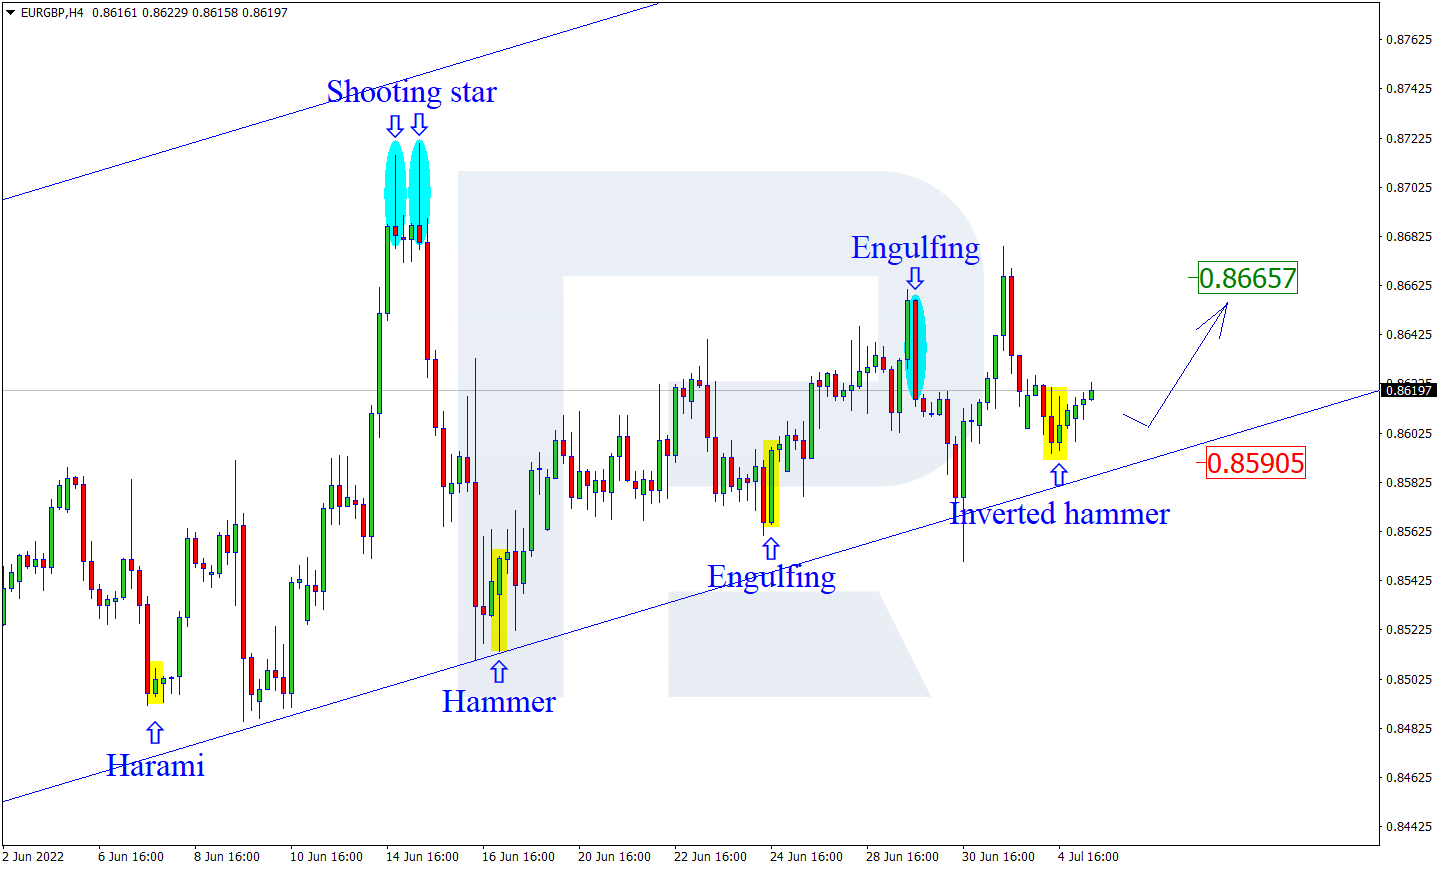
As we can see in the H4 chart, after forming several reversal patterns near the support area, such as an Inverted Hammer, EURGBP is reversing in the form of a new rising impulse. In this case, the upside target may be the resistance level at 0.8665. Later, the market may test this level, break it, and continue moving upwards. Still, there might be an alternative scenario, according to which the asset may correct to reach 0.8590 first and then resume the uptrend.

EURGBP

Article By RoboForex.com

Attention!
Forecasts presented in this section only reflect the author’s private opinion and should not be considered as guidance for trading. RoboForex LP bears no responsibility for trading results based on trading recommendations described in these analytical reviews.

The Analytical Overview of the Main Currency Pairs on 2022.07.05

By JustForex

The EUR/USD currency pair

Technical indicators of the currency pair:
  • Prev Open: 1.0415
  • Prev Close: 1.0422
  • % chg. over the last day: +0.07%

In his speech yesterday, ECB Vice President Luis de Guindos said that higher inflation in the Eurozone would remain for some time. The ECB expects that lower energy prices, eliminating supply disruptions related to the pandemic, and normalizing monetary policy will help inflation return to the 2% target in the medium term. But the war and the risk of further energy supply disruptions to the Eurozone still pose a significant downside risk. The ECB is still planning to raise interest rates by 0.25% at the July meeting and make another increase at the September meeting.

Trading recommendations
  • Support levels: 1.0412, 1.0379
  • Resistance levels: 1.0447, 1.0504, 1.0564, 1.0611, 1.0680, 1.0723

From the technical point of view, the trend on the EUR/USD currency pair on the hourly time frame is bearish. The price is trading below the moving averages, and the MACD indicator has become inactive. The price is forming a flat again. Under such market conditions, sell deals can be considered from the resistance level of 1.0447 or 1.0504, but only after the additional confirmation. Buy trades are best to look for on intraday time frames from the support level of 1.0412, but only with confirmation and short targets.

Alternative scenario: if the price breaks out through the 1.0611 resistance level and fixes above, the uptrend will likely resume.

EUR/USD
News feed for 2022.07.05:
  • – Eurozone German Services PMI (m/m) at 10:55 (GMT+3);
  • – Eurozone Services PMI (m/m) at 11:00 (GMT+3).

The GBP/USD currency pair

Technical indicators of the currency pair:
  • Prev Open: 1.2103
  • Prev Close: 1.2102
  • % chg. over the last day: -0.01%

The British pound sterling rose against the safe-haven currencies on Monday, helped by an improvement in global risk appetite during a calm trading session due to the US holiday weekend. The difference between the monetary policy of the Bank of England and the US Fed on higher inflation also put pressure on the pound. The Fed interest rate is currently at 1.75%, while the Bank of England rate is at 1.25%. Such an overbalance of the rate will contribute to a further decline in GBPUSD quotes in the medium term.

Trading recommendations
  • Support levels: 1.2062, 1.2015, 1.1974
  • Resistance levels: 1.2137, 1.2172, 1.2238, 1.2324, 1.2422, 1.2470, 1.2523, 1.2629

From the technical point of view, the trend on the GBP/USD currency pair on the hourly time frame is bearish. The situation is very similar to the euro. The price is trading below the moving averages, the MACD indicator has become inactive, and the price is forming a wide-volatile flat. Under such market conditions, sell deals can be considered from the resistance level of 1.2137 or 1.2172, but only after the additional confirmation. Buy trades are best to look for on intraday time frames from the support level of 1.2062, but only with confirmation and short targets.

Alternative scenario: if the price breaks out through the 1.2324 resistance level and fixes above, the uptrend will likely resume.

GBP/USD
News feed for 2022.07.05:
  • – UK Services PMI (m/m) at 11:30 (GMT+3);
  • – UK BoE Financial Stability Report (m/m) at 12:30 (GMT+3);
  • – UK BoE Gov Bailey Speaks at 13:00 (GMT+3).

The USD/JPY currency pair

Technical indicators of the currency pair:
  • Prev Open: 135.28
  • Prev Close: 135.65
  • % chg. over the last day: +0.27%

According to the BoJ’s former chief economist, Inflation in Japan will be higher and longer than the Bank of Japan now expects, making an upward revision to the price forecast likely later this month. But the revision will not mean that a change in monetary policy is imminent. The Bank of Japan will deliver its latest quarterly forecast on July 21. Its yield curve control program has come under heavy criticism in recent weeks because of increased speculation of tightening.

Trading recommendations
  • Support levels: 135.67, 134.83, 133.35, 131.67, 131.00, 130.12, 129.48, 128.76
  • Resistance levels: 136.57

The medium-term trend on the USD/JPY currency pair is bullish. Buyer pressure in recent days has been increasing again. The MACD indicator has become positive, and the price forms a wide balance. Under such market conditions, buy trades can be considered from the support level of 135.67, but with confirmation. A resistance level of 136.57 is good for sell deals, but only with additional confirmation and short targets.

Alternative scenario: If the price fixes below 133.35, the downtrend will likely resume.

USD/JPY
News feed for 2022.07.05:
  • – Japan Services PMI (m/m) at 03:30 (GMT+3).

The USD/CAD currency pair

Technical indicators of the currency pair:
  • Prev Open: 1.2877
  • Prev Close: 1.2858
  • % chg. over the last day: -0.15%

Canadian manufacturing activity fell slightly in June as inflationary pressures and material shortages held back production, and firms became less optimistic about future production. The manufacturing index fell to its lowest level since June 2020 to 50.9 from 55.6 in May. Consumer expectations for inflation rose, along with concerns about food, gas, and rent prices. Businesses expect high inflation over a more extended period. Both surveys reinforce calls for a 75 basis point rate hike at the next Bank of Canada decision on July 13.

Trading recommendations
  • Support levels: 1.2847, 1.2781, 1.2701, 1.2616
  • Resistance levels: 1.2914, 1.2957, 1.3045

In terms of technical analysis, the trend on the USD/CAD currency pair is bullish. The price is now trading in a wide corridor, a slight pressure from buyers prevails, and the MACD indicator does not show activity. Under such market conditions, it is better to look for buy deals in the lower time frames from the support level of 1.2847, but with confirmation. For sell deals, it is better to consider the resistance level of 1.2914, but it is also better with confirmation and short targets.

Alternative scenario: if the price breaks through and consolidates below the 1.2838 support level, the downtrend will likely resume.

USD/CAD
There is no news feed for today.

By JustForex


This article reflects a personal opinion and should not be interpreted as an investment advice, and/or offer, and/or a persistent request for carrying out financial transactions, and/or a guarantee, and/or a forecast of future events.

The RBA has aggressively raised the interest rate. A labor strike in Norway threatens to disrupt oil and gas production

By JustForex

Yesterday the US had a bank holiday due to Independence Day, and the stock market did not trade.

Stock markets in Europe traded without a single dynamic on Monday. Yesterday, German DAX (DE30) decreased by 0.31%, French CAC 40 (FR40) added 0.40%, Spanish IBEX 35 (ES35) lost 0.17%, British FTSE 100 (UK100) was up to 0.89%.

Annual inflation in Turkey soared to nearly 79%, reaching its highest level in 24 years. Consumer prices skyrocketed due to the Russian-Ukrainian war, high energy, and food prices, and a sharply devalued lira, the national currency. Turkey had experienced rapid growth in previous years. Still, President Recep Tayyip Erdoğan has refused to raise rates substantially in the past few years to reduce inflation, calling interest rates the “mother of all evils”. The result has been a sharp decline in the Turkish lira and much lower buying power. Erdogan has instructed the country’s Central Bank, which analysts say is independent of him, to cut borrowing rates repeatedly in 2020 and 2021, even as inflation continued to rise. Central Bank governors who disagreed with this course of action were fired. Turkey’s Central Bank had replaced four governors in two years.

Brent oil prices rose yesterday as a strike in Norway threatened to disrupt oil and gas production. The strike is expected to cut oil and gas production by 89,000 barrels per day, of which gas production will be 27,500 barrels per day. Overall, the demand outlook is also worrisome for investors amid tightening global financial conditions as the US Federal Reserve fights high inflation with rapid rate hikes.

Asian markets also traded flat yesterday. Japan’s Nikkei 225 (JP225) gained 0.84%, Hong Kong’s Hang Seng (HK50) decreased by 0.13%, and Australia’s S&P/ASX 200 (AU200) added 1.11% on Monday.

Analysts think Asian stocks may get a boost on the back of positive economic data and hints of easing Sino-US tensions. The White House will announce some Chinese tariff cuts later this week to dampen rising inflation and help restore optimism to the markets. Service sector activity in China reached its fastest pace in nearly a year, which also lifted investor sentiment.

Analysts at Nomura Bank believe the EU, Britain, Japan, South Korea, Australia, Canada, and the United States are likely to fall into recession over the next 12 months as central banks try to regain control of inflation by tightening policy too much.

The Reserve Bank of Australia raised its interest rate from 0.5% to 1.35%. In his speech, RBA Governor Phillip Lowe said the war in Ukraine and the strong demand for manufacturing capacity are putting upward pressure on prices. Inflation in Australia is high but slightly lower compared to other leading economies. The RBA predicts inflation will peak at the end of this year and fall back into the 2-3% range next year.

S&P 500 (F) (US500) 3,825.33 0 (0%)

Dow Jones (US30) 31,097.26 0 (0%)

DAX (DE40) 12,773.38 −39.65 (−0.31%)

FTSE 100 (UK100) 7,232.65 +64.00 (+0.89%)

USD Index 105.19 +0.06 (+0.05%)

Important events for today:
  • – Japan Services PMI (m/m) at 03:30 (GMT+3);
  • – Australia Retail Sales (m/m) at 04:30 (GMT+3);
  • – China Caixin Services PMI (m/m) at 04:45 (GMT+3);
  • – Australia RBA Interest Rate Decision (m/m) at 07:30 (GMT+3);
  • – Eurozone German Services PMI (m/m) at 10:55 (GMT+3);
  • – Eurozone Services PMI (m/m) at 11:00 (GMT+3);
  • – UK Services PMI (m/m) at 11:30 (GMT+3);
  • – UK BoE Financial Stability Report (m/m) at 12:30 (GMT+3);
  • – UK BoE Gov Bailey Speaks at 13:00 (GMT+3).

By JustForex


This article reflects a personal opinion and should not be interpreted as an investment advice, and/or offer, and/or a persistent request for carrying out financial transactions, and/or a guarantee, and/or a forecast of future events.

Trade Of The Week: Volatile Week For Dollar As Focus Shifts To NFP?

By ForexTime 

The mighty dollar reigned supreme during the first half of 2022, asserting its dominance over all G10 currencies.

Greenback bulls drew ample inspiration from risk aversion as geopolitical risks and recession fears sent investors sprinting towards safe-haven destinations. Appetite towards the currency was also stimulated by expectations for aggressive Fed rate hikes in the face of soaring inflation with rising Treasury yields fuelling upside gains.

As buying sentiment improved throughout H1, this propelled the Dollar Index (DXY) to levels not seen in 20 years.

There was also some action on the equally- weighted USD Index which hit a 2022 high of 1.1954 in June.

Given how bulls dominated the scene in H1, the momentum could roll over into the second half of 2022 if the fundamentals forces remain intact. Taking a quick look at the technicals, both the Dollar Index and Equally-weighted USD index remain firmly bullish on multiple timeframes with the path of least resistance north. When considering how the week ahead is jam-packed with key US economic reports and speeches from numerous Fed officials, it may be wise to fasten your seatbelts for potential USD volatility.

The low down…

Last week, Federal Reserve Chair reiterated that the US economy was “well positioned to withstand tighter monetary policy” during a panel discussion at the ECB forum. However, he cautioned about the Fed’s ability to achieve a “soft landing”. This has fed into the US recession fears as the central bank wages war against soaring inflation.

Annual inflation rate in the United States unexpectedly accelerated to 8.6% in May, the highest since December 1981 as energy prices jumped the most since September 2005. This red-hot figure poured cold water on hopes of inflation peaking and fuelled speculation of aggressive interest rate hikes from the Fed.

Interestingly, the latest core Personal Consumption Expenditure (PCE) painted a different picture as inflation showed some signs of cooling off in May. This was a significant development, especially when considering how the core PCE is the Fed’s preferred inflation metric. The PCE Price Index rose 6.3% year-over-year which was slightly below market forecast while the core PCE dropped to 4.7%, down from April’s 4.9%. This better-than-expected data may revive hopes around price pressures peaking, cooling bets around aggressive hikes. Nevertheless, traders are still pricing in around a 75% chance of a 75-basis point rate hike at the Fed meeting this month.

The week ahead…

US markets will be closed on Monday for Independence Day.

Nevertheless, the holiday-shortened week promises to be eventful due to key economic reports and risk events. All eyes will be on the FOMC minutes on Wednesday which could provide fresh insight into policy paths ahead of the key US jobs report on Friday. At its June meeting, the Fed raised interest rates by 75 basis points, its biggest rate increase since 1994. The minutes should provide more insight into the internal discussions over the decision.

Before the NFP report on Friday, investors will be served side dishes in the form of the US ADP employment change and initial jobless claims. This will be topped off with speeches from Fed officials.

The main course on Friday could satisfy or dissatisfy investors depending on the print. Markets expect the US economy to have added 250,000 jobs in June, while the unemployment rate is seen holding at 3.6%. Should the headline NFP meet or exceed market forecasts with the unemployment rate holding steady or falling, this could soothe US recession fears. Alternatively, a lower-than-expected headline NFP figure coupled with a higher-than-3.6% unemployment rate could fuel fears around the US economy bound for a recession down the road.

Dollar breakout on the horizon?

It looks like the equally-weighted USD Index could be gearing to push higher with 1.1950 acting as a key level of interest.

Prices remain bullish on the weekly and daily timeframe. Beyond 1.1950, the next key point can be found at 1.2070. A solid breakout above 1.2070 could open the doors towards 1.2300.

Should 1.1950 prove to be reliable resistance, a decline back towards 1.1700, 1.1640, and 1.1400 could be on the cards.


Forex-Time-LogoArticle by ForexTime

ForexTime Ltd (FXTM) is an award winning international online forex broker regulated by CySEC 185/12 www.forextime.com

Gold Price Analysis: Too Much Pressure

By RoboForex Analytical Department

The Gold prices reached stability on Monday not far from $1,812 per troy ounce. The strong American currency still puts much pressure on the precious metal.

Despite the significant market turbulence, demand for Gold as a “safe haven” asset is close to zero because US bonds are rallying and attracting much more attention. Unlike bonds, Gold doesn’t generate its own profitability.

Another factor that makes Gold less attractive to investors in the anticipation of another rate hike by the US Federal Reserve System.

Also, the Gold price is being pressured by news from India, which raised its import fee for the precious metal from 7.5% с 12.5% to reduce the foreign trade deficit. This move will decrease the demand for Gold in the country – the news is very important for market players because India is the second biggest consumer of Gold on the planet.

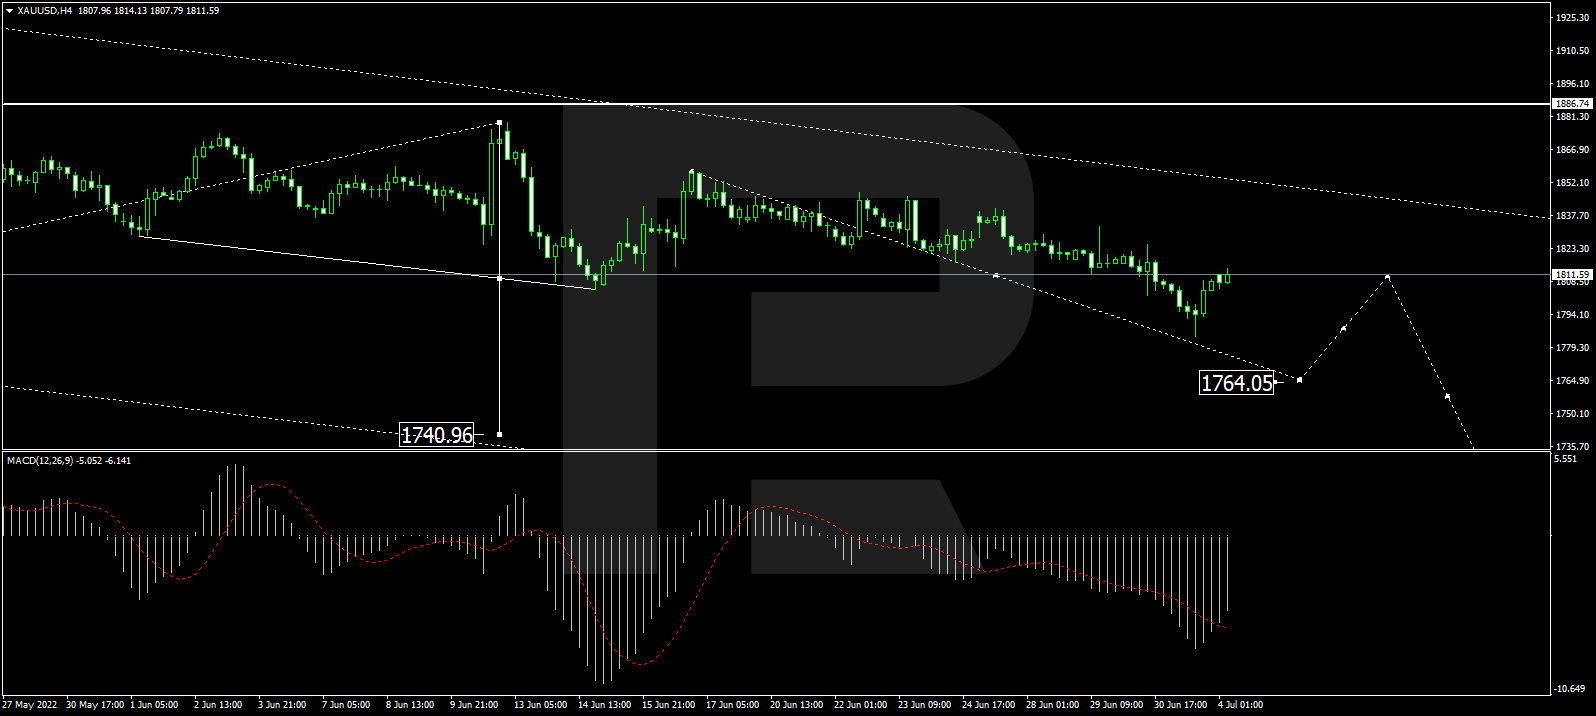
As we can see in the H4 chart, after completing the first descending structure at 1805.05, along with the correction up to 1857.10, XAU/USD has rebounded from the latter level; right now, it is falling again with the short-term target at 1764.00. Later, the market may start a new correction to test 1811.77 from below and then resume trading downwards towards 1704.88. From the technical point of view, this scenario is confirmed by the MACD Oscillator: its signal line is moving below 0 and may soon update its lows.

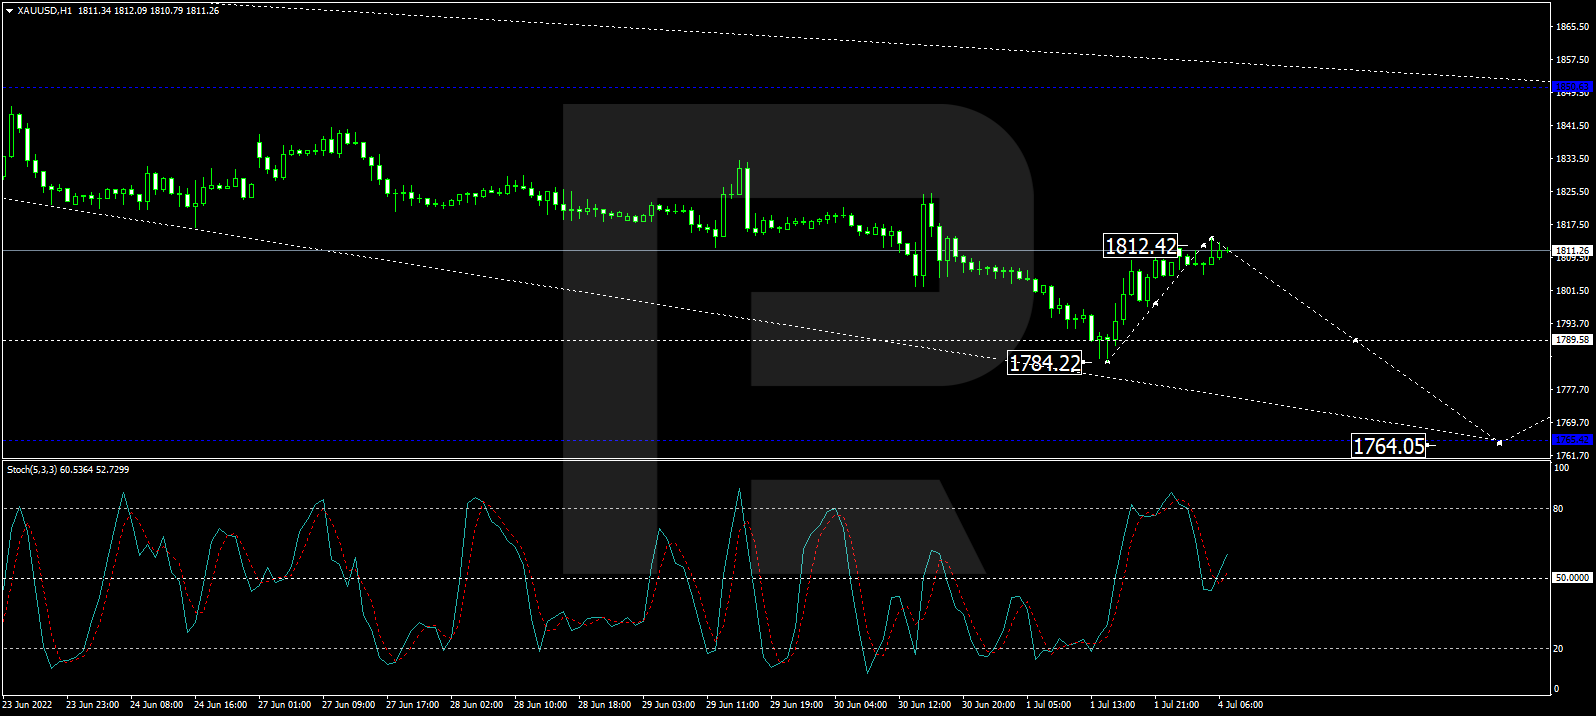
In the H1 chart, Gold has finished the descending wave at 1784.22, along with the correction to test 1812.40 from below; right now, it is consolidating below the latter level. Possibly, the metal may break this range to the downside and resume falling with the short-term target at 1764.00. From the technical point of view, this scenario is confirmed by the Stochastic Oscillator: after breaking 50 downwards, its signal is expected to continue falling and reach 20.

Disclaimer

Any forecasts contained herein are based on the author’s particular opinion. This analysis may not be treated as trading advice. RoboForex bears no responsibility for trading results based on trading recommendations and reviews contained herein.