The cryptocurrency market digest (BTC). Overview for 09.11.2022

By RoboForex.com

On the crypto market, optimists are shedding blood, and not for the first day in a row. The BTC has dropped to 18,135 USD. The leading cryptocurrency lost 8% overnight and more than 11% over a week.

Other crytocurrencies also dropped over the week: the XRP (-18%), ETH (-20%), DOGE (-38%), SOL (-42%).

Meanwhile, demand has grown for the OKB (+19.0%), MATIC (+6.8%), PAXG (+3.4%), USDP (+0.1%).

The main reason for the crash is the story around Binance and FXT. Let us agree that the FXT exchange fell prey to the eclipse corridor: the platform lost a lot of liquidity after the FTT token went on sale. Investors recalled the story with LUNA at once and fled from risks.

After all that happened, Binance decided to buy the FXT. This looks kind of ambiguous.

All this quite untimely distracted investors from the growth of the US stock indices. In such circumstances, the BTC could easily break through 22,000 USD, but dropped to the well-traded range between strong support levels of 18,000-19,000 USD.

What is next? until the US regulators react somehow, volatility in crypto will remain extreme. This means, the market will be under sales, though not in such crazy volumes.

On Wednesday, capitalisation of the crypto market is 891.8 billion USD. The BTC takes up 39.1% and the ETH – 17.4%.

Article By RoboForex.com

Attention!
Forecasts presented in this section only reflect the author’s private opinion and should not be considered as guidance for trading. RoboForex LP bears no responsibility for trading results based on trading recommendations described in these analytical reviews.

The Analytical Overview of the Main Currency Pairs on 2022.11.09

By JustMarkets

The EUR/USD currency pair

Technical indicators of the currency pair:
  • Prev Open: 1.0016
  • Prev Close: 1.0072
  • % chg. over the last day: +0.56 %

The preliminary results of the US Congressional elections show a significant Republican lead, which means that the US is close to a government split. This may lead to a rise in the dollar index, as the new Congress will want to deal with inflation more quickly and push the US Federal Reserve to raise interest rates even more aggressively. Republicans are willing to accept a recession, but only if it is quick. Therefore, once inflation begins to decline, the US Fed may return to stimulative methods for the economy.

Trading recommendations
  • Support levels: 1.0012, 0.9946, 0.9838, 0.9794, 0.9755, 0.9702, 0.9601
  • Resistance levels: 1.0111, 1.0162, 1.0230

From the technical point of view, the trend on the EUR/USD currency pair on the hourly time frame is still bullish. The price is trading above the moving averages. The MACD indicator is positive, but there is a divergence, indicating the weakness of the buyers and approaching a corrective movement. Under such market conditions, buy trades should be considered from the support level of 0.9946 or 0.9838, but with additional confirmation. Sell deals can be considered from the resistance level of 1.0111, but also with confirmation.

Alternative scenario: if the price breaks down through the support level of 0.9838 and fixes below it, the downtrend will likely resume.

EUR/USD
News feed for 2022.11.09:
  • – FOMC Member Williams Speaks at 10:00 (GMT+2).

The GBP/USD currency pair

Technical indicators of the currency pair:
  • Prev Open: 1.1514
  • Prev Close: 1.1544
  • % chg. over the last day: +0.26 %

Bank of England Chief Economist Huw Pill said that the sharp decline in the UK labor force is putting upward pressure on inflation and points to further interest rate hikes. The shrinking labor force is one of the reasons Bank of England policymakers point to why they are likely to raise the benchmark lending interest rate above 3%.

Trading recommendations
  • Support levels: 1.1491, 1.1348, 1.1230, 1.1172, 1.1093, 1.0915, 1.0817
  • Resistance levels: 1.1643, 1.1698, 1.1816, 1.1901

From the technical point of view, the GBP/USD currency pair trend on the hourly time frame is bullish. The price is trading above the moving averages. The MACD indicator is positive, but a divergence has appeared, which indicates that further growth is limited. Under such market conditions, buy trades are better to look for on intraday time frames with short targets. Long trades can be considered from the support level of 1.1491 or 1.1348. Sell trades are best sought from the resistance level of 1.1643 but better with confirmation in the form of a reverse initiative.

Alternative scenario: if the price breaks down of the 1.1231 support level and fixes below it, the downtrend will likely resume.

GBP/USD
There is no news feed for today.

The USD/JPY currency pair

Technical indicators of the currency pair:
  • Prev Open: 146.63
  • Prev Close: 145.66
  • % chg. over the last day: -0.67 %

Japan’s current account surplus hit an eight-year low in fiscal 1 due to a record trade deficit caused by a sharp rise in imports and a sharp fall in the yen. The country’s trade deficit stood at 9.23 trillion yen after imports rose twice as fast as exports. The sharp decline underscores a country’s vulnerability that relies heavily on imports. The government is counting on a rebound in inbound tourism, as the weak yen will make travel to Japan and shopping in the country cheaper for foreign tourists.

Trading recommendations
  • Support levels: 145.50, 144.91, 144.19, 143.00
  • Resistance levels: 146.24, 147.34, 148.82, 150.00, 151.05

From the technical point of view, the medium-term trend on the currency pair USD/JPY is bearish. The price is trading below the moving average levels. The MACD indicator is in the negative zone, and sellers’ pressure temporarily prevails. Under such market conditions, buy trades can be searched for on intraday time frames from the support level of 145.50, but with confirmation in the form of a reverse initiative. Sell deals can be searched from the 146.24 or 147.34 resistance level, but only with additional confirmation.

Alternative scenario: If the price fixes above 150.00, the uptrend will likely resume.

USD/JPY
There is no news feed for today.

The USD/CAD currency pair

Technical indicators of the currency pair:
  • Prev Open: 1.3493
  • Prev Close: 1.3426
  • % chg. over the last day: -0.50 %

The Canadian dollar is a commodity currency, so it is highly dependent not only on the monetary policy of the Bank of Canada but also on the dollar index and oil prices. Oil prices dropped sharply yesterday, which led to weakness in the Canadian currency. Interest rates in the US and Canada are at about the same level, so the imbalance in USD/CAD pricing will mainly come from the dynamics of oil prices and the dollar index.

Trading recommendations
  • Support levels: 1.3486, 1.3400
  • Resistance levels: 1.3608, 1.3682, 1.3776, 1.3855, 1.3968

From the point of view of technical analysis, the trend on the USD/CAD currency pair is bearish. The MACD indicator is negative now, but there is a divergence, which indicates the weakness of the sellers. The best way to sell is to consider the resistance level of 1.3479, but only after the additional confirmation. Buy trades should be considered on the lower time frames from the support level 1.3297, but with additional confirmation.

Alternative scenario: if the price breaks out and consolidates above the resistance level of 1.3682, the uptrend will likely resume.

USD/CAD
News feed for 2022.11.09:
  • – US Crude Oil Reserves (w/w) at 17:30 (GMT+2).

By JustMarkets


This article reflects a personal opinion and should not be interpreted as an investment advice, and/or offer, and/or a persistent request for carrying out financial transactions, and/or a guarantee, and/or a forecast of future events.

Investors returned to gold amid uncertainty over the distribution of power in the United States

By JustMarkets

The Dow Jones Index (US30) increased by 1.02% at Monday’s close, while the S&P 500 Index (US500) added 0.56%. The NASDAQ Technology Index (US100) jumped by 0.49% yesterday.

Preliminary results of the US congressional elections show a significant Republican lead, which means the US is close to a government split, likely derailing the Democrats’ big spending plans on social issues. This could lead to a rise in the dollar index, as the new Congress will want to deal with inflation more quickly and push the US Federal Reserve to raise interest rates even more aggressively. Republicans are willing to accept a recession, but only if it is quick.

Stock markets in Europe traded higher yesterday. The German DAX (DE30) gained 1.15%, the French CAC 40 (FR40) increased by 0.39%, the Spanish IBEX 35 (ES35) added 0.46%, the British FTSE 100 (UK100) closed up by 0.08%.

Sustained growth in German bond yields weakened the dollar amid expectations of further tightening of the European Central Bank policy, which led to a reduction in the spread with Treasury yields. Bank of Germany Governor Joachim Nagel said Tuesday that the ECB should not “give up too soon” and should keep raising rates even if it hurts growth. ECB Governing Council spokesman Pierre Wunsch pointed out yesterday that the European Central Bank may need to raise interest rates more than investors expect. The ECB’s monetary policy response will ultimately depend on the severity of the coming economic slowdown. Therefore, it is important for investors to gauge the performance of the region’s economy, especially GDP.

Gold prices jumped to a one-month high on Wednesday thanks to renewed demand for safe-haven assets and a weaker dollar due to uncertainty over the outcome of the US midterm elections.

Oil prices fell yesterday as industry data showed that US crude inventories rose more than expected. There are also growing concerns that the recovery of COVID-19 cases in the largest importer, China, will hurt demand for fuel. Last week, the oil market had pinned hopes that China might move to ease restrictions related to COVID, but officials said over the weekend that they would stick to their approach.

Asian markets traded flat yesterday. Japan’s Nikkei 225 (JP225) gained 1.25%, Hong Kong’s Hang Seng (HK50) decreased by 0.23%, and Australia’s S&P/ASX 200 (AU200) added 0.36% by the end of the day.

China’s consumer price index was 2.1% y/y in October (forecast 2.4%). The producer price index was 1.3% y/y (forecast 1.5%). The slowdown in China also does not bode well for broader Asian markets, given the country’s role as a major trading hub. Sentiment toward China worsened this week after authorities said Beijing has no plans to roll back its strict zero COVID policy.

S&P 500 (F) (US500) 3,828.11 +21.31 (+0.56%)

Dow Jones (US30) 33,160.83 +333.83 (+1.02%)

DAX (DE40) 13,688.75 +155.23 (+1.15%)

FTSE 100 (UK100) 7,306.14 +6.15 (+0.084%)

USD Index 109.63 −0.50 (−0.43%)

Important events for today:
  • – China Consumer Price Index (m/m) at 03:30 (GMT+2);
  • – China Producer Price Index (m/m) at 03:30 (GMT+2);
  • – FOMC Member Williams Speaks at 10:00 (GMT+2);
  • – US Crude Oil Reserves (w/w) at 17:30 (GMT+2).

By JustMarkets


This article reflects a personal opinion and should not be interpreted as an investment advice, and/or offer, and/or a persistent request for carrying out financial transactions, and/or a guarantee, and/or a forecast of future events.

RoboMarkets is the Gold and Title Sponsor of the AEL Women’s Volleyball Team in the 2022-2023 Season

European broker RoboMarkets which provides investment services has become the Gold and Title sponsor of the AEL women’s volleyball club in Limassol. The contract will remain in force through the 2022-2023 season. Through the agreement, the team playing in the Cyprus Major League will be called RoboMarkets AEL Volleyball.

The collaboration of RoboMarkets with AEL started already five years ago and keeps evolving thanks to the goals the two organisations have in common – victory and leadership. However, what mainly unites them both is their passion for volleyball. Over the years of working side by side, there have been challenges and bright times. This invaluable experience made the team stronger, and in the upcoming season, it will fight for victory with the new Title sponsor and under the new name – RoboMarkets AEL Volleyball. Apart from the new name, the sponsorship implies placing a RoboMarkets logo on the team’s outfit and organising joint marketing activities.

Founded in Limassol in 1976, ΑΕΛ (AEL Limassol), now re-named RoboMarkets AEL Volleyball, is the leader among the volleyball teams of the Republic of Cyprus. It boasts a record number of titles among the women’s volleyball teams in Cyprus – 30 Championships. Moreover, the team has become the holder of the Cup of Cyprus 28 times and the Super Cup of Cyprus – 12 times.

Denis Golomedov, Chief Marketing Officer at RoboMarkets, states: “We have been supporting the team for years, and are now on a new collaboration level in our dual capacity as Gold and Title sponsor. This makes our connection even stronger, especially during the 2022-2023 season. We are proud to give our name to one of the best volleyball teams in Cyprus. We will be doing our utmost to help the team become even better and reach new heights together with us!”

“On the occasion of expanding our collaboration with RoboMarkets as our Gold sponsor as well as Title sponsor, I would like, on behalf of the RoboMarkets AEL Volleyball committee to express our deep appreciation to RoboMarkets and its management. Knowing that we have great a company and people as partners, not only supporting us financially but also psychologically, pushes us to maximise our effort for distinction and fulfillment of our goals”, comments Costas Constantinou, President of RoboMarkets AEL Volleyball committee.

About RoboMarkets

RoboMarkets is an investment company with the CySEC license No. 191/13. RoboMarkets offers investment services in many European countries by providing traders, who work on financial market, with access to its proprietary trading platforms. More detailed information about the Company’s products and activities can be found on the official website at www.robomarkets.com.

EUR does not give up parity. Overview for 08.11.2022

Article By RoboForex.com

The market major is stuck to parity, unwilling to give it up. The current quote is 1.0000.

Yesterday, a monetary politician from the European Central Bank has mentioned that sooner or later the regulator will have to start Quantitative Tightening. Also, the ECB will have to increase interest rates to the level that would bring inflation to target levels as fast as possible.

These levels will be directly bound to the CPI dynamics, economic conditions, energy carriers prices and the demand for them.

Certain ECB members are sure that inflation in the Euro zone will remain at 10.7% in the nearest future. It will start declining in the first half of 2023 but on the whole, both average and base inflation will remain high.

Today, the macroeconomic calendar is empty both for the Euro zone and the US. The market will be looking at near-economic events and, most importantly, the US Congress elections.

Article By RoboForex.com

Attention!
Forecasts presented in this section only reflect the author’s private opinion and should not be considered as guidance for trading. RoboForex LP bears no responsibility for trading results based on trading recommendations described in these analytical reviews.

The Analytical Overview of the Main Currency Pairs on 2022.11.08

By JustMarkets

The EUR/USD currency pair

Technical indicators of the currency pair:
  • Prev Open: 0.9901
  • Prev Close: 1.0020
  • % chg. over the last day: +1.20 %

Congressional Elections will be held in the US today. Many traders and investors underestimate this event, referring to it as a political one. But it should be noted that this election puts control of Congress and President Joe Biden’s agenda for the remaining two years of his term at stake. Republicans are leading in the polls, and many analysts believe the likely outcome will be a split government, with the Republican Party controlling the House and possibly the Senate in the second half of Biden’s term. If this scenario goes into effect, the US would not be able to provide financial support in an economic downturn. It would also affect the prospects for government spending, which could be reallocated to other needs. This could lead to a sharp rise in the dollar index, a fall in the European currency, and a drop in stock indices.

Trading recommendations
  • Support levels: 0.9946, 0.9838, 0.9794, 0.9755, 0.9702, 0.9601
  • Resistance levels: 1.0055, 1.0111, 1.0162, 1.0230

From the technical point of view, the trend on the EUR/USD currency pair on the hourly time frame is still bullish. The price is trading above the moving averages. The MACD indicator is positive, but there is a divergence, indicating the weakness of the buyers. Under such market conditions, buy trades should be considered from the support level of 0.9946 or 0.9838, but with additional confirmation. Sell deals can be considered from the resistance level of 1.0055, but with confirmation as well.

Alternative scenario: if the price breaks down through the support level of 0.9795 and fixes below it, the downtrend will likely resume.

EUR/USD
News feed for 2022.11.08:
  • – Eurozone Retail Sales (m/m) at 12:00 (GMT+2);
  • – US Congressional Elections (All Day).

The GBP/USD currency pair

Technical indicators of the currency pair:
  • Prev Open: 1.1308
  • Prev Close: 1.1512
  • % chg. over the last day: +1.80 %

The British pound sterling has strengthened considerably in recent days, mainly due to the decline of the dollar index. But analysts believe that the British pound now has no fundamental basis for growth. The interest rate differential between the US Federal Reserve and the Bank of England is still widening, and the British economy is already on the verge of recession. Friday’s quarterly GDP data is projected to be negative, meaning two consecutive quarters of contraction, a technical recession. The Bank of England predicts that the UK economy will contract for up to 8 consecutive quarters.

Trading recommendations
  • Support levels: 1.1329, 1.1230, 1.1172, 1.1093, 1.0915, 1.0817
  • Resistance levels: 1.1585, 1.1698, 1.1816, 1.1901

From the technical point of view, the trend on the GBP/USD currency pair on the hourly time frame is bullish. The price is trading above the moving averages. The MACD indicator is positive, and the buyers’ pressure is still present. Under such market conditions, buy trades are better to look for on intraday time frames with short targets. It is possible to consider longs from the support level of 1.1329, but a correction is needed. Sell trades are best looked for from the resistance level of 1.1585 but better with confirmation in the form of a reverse initiative.

Alternative scenario: if the price breaks down of the 1.1231 support level and fixes below it, the downtrend will likely resume.

GBP/USD
There is no news feed for today.

The USD/JPY currency pair

Technical indicators of the currency pair:
  • Prev Open: 147.17
  • Prev Close: 146.62
  • % chg. over the last day: -0.38 %

Japan’s Cabinet on Tuesday will approve a supplementary budget for the current fiscal year to spend 29.1 trillion yen ($199 billion) on an economical package designed to ease the pain for households and businesses from rising prices exacerbated by a weaker yen. The government will issue about 22.8 trillion yen in bonds to provide the necessary financing, further pushing back the fiscal recovery despite the fact that its debt is already more than twice the size of its economy. The government estimates that the energy-focused measures will help reduce the country’s core consumer inflation by 1.2%.

Trading recommendations
  • Support levels: 146.38, 145.50, 144.91, 144.19, 143.00
  • Resistance levels: 147.34, 148.82, 150.00, 151.05

From the technical point of view, the medium-term trend on the currency pair USD/JPY is bearish. The price is trading at the level of the moving averages, and a wide-volatility balance is being formed. The MACD indicator is inactive. Under such market conditions, buy trades can be sought on intraday time frames from the support level of 146.38. Sell deals can be searched from the resistance level of 147.34, but only with additional confirmation.

Alternative scenario: If the price fixes above 150.00, the uptrend will likely resume.

USD/JPY
There is no news feed for today.

The USD/CAD currency pair

Technical indicators of the currency pair:
  • Prev Open: 1.3533
  • Prev Close: 1.3490
  • % chg. over the last day: -0.32 %

The Canadian dollar is a commodity currency, so it is highly dependent not only on the monetary policy of the Bank of Canada but also on the dollar index and oil prices. The oil market is very tight right now due to a variety of factors that affect it, from OPEC+ countries cutting production to G7 countries setting a restrictive price in response to Russia’s invasion of Ukraine. On the other hand, the influence of the dollar index, which is strongly confirmed by the US Federal Reserve monetary policy, plus the congressional elections will take place today, which may influence the dynamics. No wonder why the USD/CAD quotes show sharp movements to one side and to the other.

Trading recommendations
  • Support levels: 1.3486, 1.3400
  • Resistance levels: 1.3608, 1.3682, 1.3776, 1.3855, 1.3968

From the point of view of technical analysis, the trend on the USD/CAD currency pair is bearish. The price has consolidated below the moving averages and the priority change level. The MACD indicator is negative now, but there is some buying pressure on the lower time frames. The best way to sell is to consider the resistance level of 1.3608, but only after the additional confirmation. Buy trades should be considered on the lower time frames from the support level of 1.3486, but with additional confirmation.

Alternative scenario: if the price breaks out and consolidates above the resistance level of 1.3682, the uptrend will likely resume.

USD/CAD
There is no news feed for today.

By JustMarkets


This article reflects a personal opinion and should not be interpreted as an investment advice, and/or offer, and/or a persistent request for carrying out financial transactions, and/or a guarantee, and/or a forecast of future events.

The Fed-induced recessions

By Dan Steinbock

After unwarranted trade wars, a pandemic depression, proxy wars, energy and food crises, global economic prospects will be further penalized by the US Federal Reserve’s aggressive hikes and collateral damage worldwide.

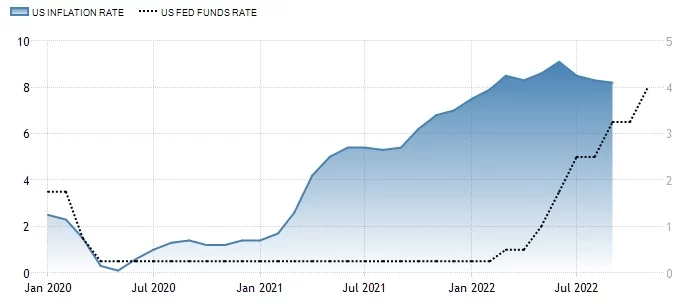
From early 2020 to early 2021, the Fed funds rate had been at 0.25%. Though the inflation rate in the US slowed for the third month to 8.2% in September 2022, it remained above market forecasts.

The energy index increased almost 20%, while the increase in the cost of food (over 11%) was close to its highest since 1979. Moreover, the core rate which excludes volatile food and energy, rose to 6.6%, the highest since August of 1982, and above market expectations. Inflationary pressures remain elevated (Figure).

Figure US Inflation and interest rate
Source: TradingEconomics, DifferenceGroup


Recently, the Fed raised the rate to 3.75%-4%. It was a sixth consecutive hike and the fourth straight three-quarter point increase, pushing borrowing costs to a new high since 2008.

Downplayed risks

Since the onset of 2020, the Fed has made two cardinal mistakes. Ignoring the WHO’s warnings about the international spread of the Covid-19, it began to cut rates only belatedly in March 2020. The second mistake ensued after mid-year 2021, when inflation started to climb rapidly. Instead of a timely response, the Fed chairman Jerome Powell downplayed the threat of soaring prices calling them “transitionary.”

Despite multiple red flags since then, the rate hikes’ net effects continue to be underestimated. Last January, I warned that US inflation is the global risk of 2022. Until then, the Fed had largely ignored soaring inflation. Due to the belated response, I expected the ensuing risks to penalize the ailing global recovery.

In February, after the disastrous failure of international diplomacy over Ukraine, I cautioned that global recovery is fading and the world economy must cope with the risk of stagflationary recession.

In the first week of March, I predicted that the unwarranted proxy war in Ukraine would “severely penalize Ukraine, Russia, the US and the NATO, Europe, developing countries and the global economy” which would compound the threats of energy and food inflation.

The Fed’s rampage toward 5%

In September, I predicted that US inflation and aggressive rate hikes are pushing the West into recession territory, while collateral damage is derailing development elsewhere.

As I projected then, the Fed was preparing another 75-point hike, followed by another 50-points hike. That would take the year-end rate to 4.5%.

What next? While the markets hoped for a smaller hike in December, Fed chair Powell noted the ultimate level of interest rates will be higher than previously expected.

Assuming still another 50 points hike in the first quarter of 2023, the Fed seems to be aiming at a rate of 5%. But will that prove “terminal”?

Trade wars, deglobalization and unwarranted conflicts tend to foster inflation. Will their impact really diminish by March 31, 2023? And what about energy and food inflation, and the new pandemic variants?

If assumptions are flawed, corrections ensue in the markets.

Toward an inclusive global monetary system

If the Fed’s monetary pain isn’t enough, the White House’s foreign policy fosters runaway inflation and elevated uncertainty. The net effect has been the lethal mix of a global energy crisis and what the UN Secretary-General Antonio Guterres has called the “meltdown of the global food system.”

As aggressive rate hikes continue to push the US, the UK, and Europe toward a stagflationary recession, peace talks are avoided in Ukraine whereas war rhetoric is gaining in Taiwan and several other international “hot spots.”

Indeed, a rapid, proactive diplomacy has not been the objective in Ukraine. Instead, as US defense secretary Lloyd Austin acknowledged in late April: “We want to see Russia weakened.” Today it seems that the effective strategic objective is to undermine China’s economy, even at the expense of Chinese, Asian and global economic prospects.

Aggressive rate hikes are predicated on greater unemployment and income polarization in America and worldwide. It is the 1980s déjà vu all over again, but with lost years in many advanced and emerging economies, and lost decades in developing countries. The difference is that today’s international environment is far more dire.

That’s what happens when the monetary policy of a single major country dominates the global economic prospects. Effectively, 332 million people dictate the future of 8 billion people. It is a system mired in conflicts of interests; and a system that fosters unwarranted suffering worldwide.

What we need is a monetary system that prioritizes peace and stability, full employment and steady prices – an inclusive system that looks like the world population it is supposed to serve.

About the Author:

Dr. Dan Steinbock is an internationally recognized strategist of the multipolar world and the founder of Difference Group. He has served at the India, China and America Institute (USA), Shanghai Institutes for International Studies (China) and the EU Center (Singapore). For more, see https://www.differencegroup.net


Stock indices show optimism ahead of US congressional elections

By JustMarkets

At Monday’s close, the Dow Jones Index (US30) increased by 1.31%, while the S&P 500 (US500) added 0.96%. Technology Index NASDAQ (US100) gained 0.85% yesterday.

Goldman Sachs told its clients on Monday that there is still a 35% chance of a recession in the US over the next 12 months. While that is twice the normal recession risk, it is well below the average of 63%, according to a recent survey by The Wall Street Journal. A Bloomberg Economics model released in late October determined that the risk of recession over the next 12 months is a staggering 100%. A probability model developed by Ned Davis Research also revealed a 98.1% chance of a global recession. But GS analysts believe the Federal Reserve can still make a soft landing for the US economy. The bank also expects the Gross Domestic Product to grow by about 1% over the next year.

Today is the US Congressional elections. Many traders and investors underestimate this event, categorizing it as political. But it should be noted that this election is at stake for control of Congress and President Joe Biden’s agenda for the remaining two years of his term. Republicans are leading in the polls, and many analysts believe the likely outcome will be a split government, with the Republican Party controlling the House and possibly the Senate in the second half of Biden’s term. If this scenario takes effect, the US will not be able to provide financial support in the economic downturn. It would also affect the prospects for government spending, which could be reallocated to other needs. Historically, the markets like it when there is a “Democratic President” and a “Republican Congress.” This has been the case for most of Obama’s and Clinton’s terms. The S&P 500 Index is up 73% and 181%, respectively. But that’s in the long-term run. If to take the short-term picture, the opposite is true. So, a government split could cause the dollar index to spike, the European currency to fall, and stock indices to plummet. In other words, if the Republicans win, the odds increase that inflation will be suppressed in the short term. But it increases the likelihood of a sharper, though shorter, recession.

Stock markets in Europe traded higher yesterday. Germany’s DAX (DE30) gained 0.55%, France’s CAC 40 (FR40) added 0.01%, Spain’s IBEX 35 Index (ES35) increased by 0.25%, and Britain’s FTSE 100 (UK100) closed down by 0.48%.

The government of the Eurozone spent 200 billion euros to support the energy stability in the region. Analysts believe the move will support economic growth but lead to further inflationary increases.

The European Central Bank should continue to raise interest rates, even at a slow pace, until core inflation, which excludes energy and food prices, begins to decline, said Governing Council member François Villeroy de Galhau. Villeroy said he expects overall inflation to peak in the first half of 2023 and begin to decline, probably starting next spring.

The situation in the oil market remains tense. There are multidirectional factors acting on oil, from OPEC+ countries cutting production to G7 countries setting a restrictive price in response to Russia’s invasion of Ukraine. There is also the factor of China and its restrictive policy, and there is the factor of crude oil reserves and energy shortages in Europe. Plus, monetary policy and the dollar index, the growth of which negatively affects oil. Such a mixture of factors all at once led to the difficulty of forecasting the price of oil. Therefore, it is worth relying on more than just fundamental indicators now.

Asian markets were mostly on the rise yesterday. Japan’s Nikkei 225 (JP225) gained 1.21%, Hong Kong’s Hang Seng (HK50) added 2.69%, and Australian S&P/ASX 200 (AU200) was up 0.60% by the end of the day.

Japan’s Cabinet on Tuesday will approve a supplementary budget for the current fiscal year to spend 29.1 trillion yen ($199 billion) on an economical package designed to ease the pain for households and businesses from rising prices exacerbated by a weaker yen. The government will issue about 22.8 trillion yen in bonds to provide the necessary financing, further pushing back the fiscal recovery despite the fact that its debt is already more than twice the size of its economy. The government estimates that the energy-focused measures will help reduce the country’s core consumer inflation by 1.2%.

S&P 500 (F) (US500) 3,770.55 +50.66 (+1.36%)

Dow Jones (US30) 32,403.22 +401.97 (+1.26%)

DAX (DE40) 13,459.85 +329.66 (+2.51%)

FTSE 100 (UK100) 7,299.99 −34.85 (+2.03%)

USD Index 110.16 −0.718 (−0.64%)

Important events for today:
  • – Australia NAB Business Confidence (m/m) at 02:30 (GMT+2);
  • – New Zealand Inflation Expectations (q/q) at 04:00 (GMT+2);
  • – Switzerland SNB Chairman Jordan speaks at 10:15 (GMT+2);
  • – Australia RBA Governor Lowe Speaks at 11:30 (GMT+2);
  • – Eurozone Retail Sales (m/m) at 12:00 (GMT+2);
  • – US Congressional Elections (All Day).

By JustMarkets


This article reflects a personal opinion and should not be interpreted as an investment advice, and/or offer, and/or a persistent request for carrying out financial transactions, and/or a guarantee, and/or a forecast of future events.

How might 2022 US midterm elections affect stocks? Here are 3 scenarios.

By ForexTime 

  • Since 1946, US stocks typically fared better in 6-month period after midterms elections, than six months prior.
  • Democrats retaining control of Congress may be deemed negative for US stocks, while Republicans wresting control of Congress could be seen as positive for equities.
  • However, any reaction to this midterm election could be relatively modest compared to the larger driver that is the Fed’s attempts to cool still-hot inflation (and possible trigger a US recession).


History has been kind for US stock markets following the midterm elections.

According to Bloomberg data, for 16 out of the past 19 midterms since 1946, stocks have fared better in the 6-month period after a midterms than the six months before the elections.

Also, take into account the year-end seasonality which typically heralds stock gains.

Over the past three decades, the month of November has seen an average monthly gain of 1.84% for the S&P 500.

That’s the second-highest monthly average gain going back to 1993, after first-placed April’s 2.28% average monthly climb over that three-decade span.


However, this year could be different.

The US pollical landscape has since changed drastically, with the chasm seemingly growing more polarized with the passage of time.

Also, the macroeconomic backdrop and the resultant central bank response has been unkind to risk assets, to say the least.

After all:

  • US core inflation (consumer prices that exclude more-volatile food and energy prices) is at its highest since 1982, pending this Thursday’s (Nov. 10th) US inflation data release.

    At 6.6% as of September 2022, that core CPI print is still more than triple the Fed’s 2% target (though the Fed’s preferred inflation gauge is the Core PCE).

  • The US Federal Reserve has already hiked its benchmark interest rates by 375 basis points so far this year, bringing the upper bound of its rates range now to 4% = a level not seen since 2008.

    Using current market forecasts, US rates are expected to peak at 5.1% by mid-2023, though that peak could move even higher if US inflation is shown to be stubbornly elevated.


A reminder of what’s at stake in today’s midterm elections: control of the US Congress.

NOTE: Senate + House = US Congress

Up for grabs today:

  • 435 seats in House of Representatives
  • 35 of the 100 Senate seats
  • 36 governorships

Going into this election, Democrats have control of both chambers of Congress, as well as the White House (US President Joe Biden is a Democrat).

Republicans only need to take on 5 seats to claim a House-majority, while only one more seat is needed to take control of the Senate.


Ultimately, markets want to know how the political makeup of Congress would set the incoming fiscal policies, and how such policies would feed into the current inflation outlook as well as the Fed’s expected response.

After all, inflation woes as well as recession fears are very much framing voters’ mindsets as they cast their ballots today.

Such worries have already seen a notable shift away from Democrats, with President Biden’s approval ratings falling in the lead up to today’s elections.


3 scenarios for US stocks

But as for investors and traders around the world, here are some broad outcomes that they might have to content with over the next 24 hours:

  1. If Republicans control both the House and the Senate = S&P 500 may extend recent gains

    Republicans are typically associated with tighter fiscal spending.

    Less government spending could work in tandem with the Fed rate hikes in subduing red-hot consumer prices.

    Hence, we may see immediate gains for US stocks based on the above assumptions, as a Republican stronghold on Congress (and tighter fiscal spending) implies that the Fed may have less work to do in subduing inflationary pressures.

    Though whether or not Republicans can actually rein in government spending, especially if the US economy threatens to enter a recession in 2023, would be a different matter.

  2. If Democrats retain control of the House and Senate = S&P 500 may fall further

    Democrats are typically associated with looser fiscal spending plans/larger government spending.
    Already in the lead up to today’s elections, the party has touted boosting healthcare and childcare subsidies and wage hikes for workers.

    These types of measures tend to fan inflationary pressures, which implies the Fed has to raise US interest rates even higher.
    As we know, Fed rate hikes have essentially been enemy #1 for US stocks this year.

    Hence the simplistic assumption here would be:

    More government spending by Democrats = more Fed rate hikes = more pain for US stocks.

  3. Political uncertainty / unclear or contested outcome = S&P 500 could revel amidst the ambiguity and hang on to recent gains

    Markets generally dislike uncertainty.
    However, uncertainty that preserves the way things are (the status quo) may not be such a bad thing for stocks.

    Additionally, US stocks have proven resilient to political unrest, judging by recent history.
    Recall how even amidst the January 2021 riots at the US Capitol, the S&P 500 barely budged, going about its merry way towards its all-time high just a hair below 4820 (intraday prices) at the start of 2022.

    Still, one could argue how any chaos in Congress might yet trigger a knee-jerk selloff across stocks, with investors potentially entering into risk-off mode and seeking refuge in safe havens (e.g. gold, US dollar, US Treasuries).


Looking at the charts …

To be clear, the S&P 500 remains very much in a downtrend on the weekly timeframe.


And with the S&P 500 already headed for its worst year since the Global Financial Crisis, today’s midterm elections may influence whether its:

  • year-to-date losses of 20% can be trimmed, or …
  • the ongoing bear market will be extended in 2023


Heightened macro fears (and downward earnings revisions) may yet see the S&P 500 ultimately retesting its 200-week SMA for support in the mid-3000 region.


Key Resistance and Support levels for S&P 500 after 2022 US midterm elections:

  • IMMEDIATE RESISTANCE: 3920
    (late-October/early-November cycle high, also around its 100-day simple moving average)
  • STRONGER RESISTANCE: 4000 psychologically-important mark
  • IMMEDIATE SUPPORT: 3700 region
    (last week’s low)
  • STRONGER SUPPORT: around 3637
    (mid-June cycle low)


Overall, I’m inclined to think that any reaction to the US midterm elections are expected to be relatively muted compared to the bigger driver that is the Fed’s ongoing rate hikes which in turn are ramping up recession risks for the world’s largest economy.

Noting that the final tally for this US midterm elections could take days before reaching a conclusive ending, then should leave Thursday’s US inflation report in the driver’s seat for dictating how the S&P 500 would fare over the immediate term.


Forex-Time-LogoArticle by ForexTime

ForexTime Ltd (FXTM) is an award winning international online forex broker regulated by CySEC 185/12 www.forextime.com

Why Meta’s share price collapse is good news for the future of social media

By Renaud Foucart, Lancaster University 

Facebook may not be the original social media platform but it has stood the test of time – until recently. Meta, the company that owns Facebook, Instagram and WhatsApp, saw its value plummet by around $80 billion (£69 billion) in just one day at the end of October, after its third-quarter profits halved amid the global slowdown. Meta is now valued at around $270 billion compared with more than $1 trillion last year.

Several issues have caused investors to turn away from the social media giant, including falling advertising revenue, a conflict with Apple over its app store charging policy, and competition for younger audiences from newer platforms such as TikTok.

Meta’s chief-executive Mark Zuckerberg has also used his majority control to double down on his ambitions for the “metaverse”, a virtual reality project on which he has already spent more than $100 billion – with questionable results according to initial investor and media reaction. Zuckerberg has promised even more investment in the metaverse next year.

It’s tempting to describe this spending spree as a billionaire’s “insane fantasy”, but there is a simpler explanation. As dominant platforms compete for a limited amount of advertising revenue, regulation – particularly when it differs between countries or regions – has created space for more competitors. This is good news for new social media companies, but it also means that the only way Meta is likely to be able to keep its dominant position is by placing a massive bet on the technology of the future. Zuckerberg believes that means the metaverse, but this remains to be seen.

Tech’s changing fortunes

Even with its recent troubles, Meta owns the largest social network in the world. Those recent results that caused investors to flee in their droves still showed total revenues of $27 billion and profits of $4.4 billion.

To maintain its position as market leader in the past, Meta has typically bought its most promising competitors as early as possible. Integrating these newly acquired startups into the company’s ecosystem helped to maximise advertising revenue and preclude competition.

Research shows that digital markets are typically dominated by a single firm, but also that these firms tend to be much more specialised than the major companies of the past. Meta is only active in social media and makes money almost exclusively by selling advertising.

Attempts by such firms to expand into other areas typically fail – know anyone with a Facebook phone? And while you may not remember Google’s attempt at social media, iPhone users are probably at least aware of Apple’s maps app.

So Facebook relies on consumers using devices produced by other tech companies to make money. But as global social media advertising revenue slows down, this is becoming more difficult. Apple has begun charging Meta for the revenue it makes from iPhone users, for example. And research shows that, when two companies compete to make money from the same captive source, their successive markups not only push prices higher for consumers but also keep profits lower for both firms.

Global domination fail

Meta’s strategy has, until recently, allowed it to rule social media in western markets – but not in China, a country of more than 300 million social media users. Since 2009, Facebook has been blocked by the country’s “great firewall”, the largest and most sophisticated system of censorship in the world.

Reported attempts to adapt Facebook to suit Chinese government media control have never been successful. And so, Chinese company ByteDance was able to launch a news platform called Toutiao in 2012 without having to compete with a dominant social network. In 2016, ByteDance launched Douyin, a social media platform for publishing short videos which was subsequently released to the rest of the world in 2018 as TikTok.

Despite not being profitable, ByteDance’s market capitalisation is now estimated at around $300 billion – versus Meta’s current £270 billion valuation. It is also popular among younger users that tend to be much more avid social media users.

Meta cannot simply buy TikTok: it is too big, not publicly traded and under tight control by the Chinese government. Zuckerberg’s firm has instead tried to compete by launching similar features on Instagram. Ironically, the only large market where this strategy is really working is India, a country that banned TikTok in 2021 due to a military conflict with China.

Fair competition

At the same time that TikTok has been expanding beyond Meta’s reach, western regulators have also started to examine the impact of the lack of competition in digital markets on innovation. While research shows that the winner-take-all nature of highly innovative markets is typically good for consumers, this is only true when all companies get a fair chance to become dominant.

In addition to recent rulings against tech company dominance by its highest court, the European Union also recently introduced the Digital Markets Act. This outlaws many practices used by dominant firms to preserve their status in a market.

Similar legislation is expected from the US after the November midterm elections, while the UK has forced Meta to sell gif library Giphy to ensure it doesn’t decrease competition in the online advertising sector.

All of this means that, for Facebook to remain dominant, Meta needs to invest in its own products. To be the market leader of tomorrow, the company cannot simply count on buying up promising startups.

But its metaverse is a nebulous project and an odd bet. After all, Google has already failed to drum up interest in Google Glass, even though the technology behind it was successful. What has changed to convince normal people to regularly wear virtual reality headsets?

The only alternative for Meta may be to find a better idea in which to invest. In the meantime, regulation continues to protect potential competitors. This is great news for consumers and creators alike: now might be the best moment to launch an innovative social media format that can actually compete with giants like Meta to become the market leader.

The Conversation

About the Author:

Renaud Foucart, Senior Lecturer in Economics, Lancaster University Management School, Lancaster University

This article is republished from The Conversation under a Creative Commons license. Read the original article.