Mid-Week Technical Outlook: USD

By ForexTime 

After dominating the FX space throughout 2022, the dollar’s reign could be coming to an end.

Since the start of Q4, dollar bulls have been missing in action as investors bet the Federal Reserve will slow the pace of rate hikes in the face of slowing economic growth.

This has pushed the Dollar Index (DXY) to its lowest level in five weeks, injecting bears with enough confidence to attack 110.00. Given how the dollar may weaken further on Fed pivot hopes, this could drag the DXY towards 109.00 in the near term.

We can see a similar theme in the equally-weighted USD index. Prices are under pressure on the weekly charts. Sustained weakness below 1.2500 could open the doors towards 1.2184.

EURUSD back above parity

As the dollar struggles across the board, this has offered an opportunity for currencies to fight back. Euro bulls wasted no time in pushing the EURUSD back above parity for the first time in five weeks. With dollar bulls missing in action amid Fed pivot hopes, and the ECB expected to raise rates by 75 basis points on Thursday, this has propelled the EURUSD towards 1.0030. A daily close above parity could encourage a move towards 1.0100 in the short term. If parity proves to be unreliable support, we could see a decline back toward 0.9900.

GBPUSD breaks above 1.1490

Pound bulls blasted above the 1.1490 resistance level this morning thanks to a weaker dollar. Prices have turned bullish on the daily timeframe and could hit the 100 SMA in the short term. A strong break above this level may see prices test the daily bullish channel around 1.1850. Should the upside lose momentum, a move back toward 1140 could be on the cards.

AUDUSD eyes 0.6550

It looks like AUDUSD bulls are back in town. The sharp rebound witnessed today could signal the return of bulls with 0.6550 acting as a key point of interest. A strong break above this level could see the currency pair target the 50-day SMA and higher. Should 0.6550 prove to be a tough resistance to crack, the AUDUSD could return towards 0.6340 and 0.6200, respectively.

USDJPY capped below 149.00?

After creating consistently higher highs and higher lows, USDJPY bulls could be taking a break. Prices are trading back below 149.00 thanks to fundamental forces and may sink lower due to a weaker dollar. Bears may target 145.00 and 143.50 which is where the 50-day SMA resides.

Watch out for the NZDUSD

It looks like the NZDUSD could be gearing for a major breakout above 0.5800. Such a move could open a path toward the 50 day SMA at 0.5880 and 0.5900. A scenario where 0.5800 holds the forte may send prices back towards 0.5720 and 0.5560.


Forex-Time-LogoArticle by ForexTime

ForexTime Ltd (FXTM) is an award winning international online forex broker regulated by CySEC 185/12 www.forextime.com

Six Resource Companies You Should Pay Attention To

Source: Adrian Day  (10/24/22) 

Several resource companies on expert Adrian Day’s list have reported their production numbers for the third quarter, with some positive surprises, though costs are rising.

Barrick Gold Corp. (ABX:TSX; GOLD:NYSE) reported production of just under one million ounces, down 54,000 ounces from the year-ago quarter and below estimates, while costs have risen. Copper production, however, was stronger than forecast. The company believes it will have a strong fourth quarter so that annual production will be within guidance, at the lower end for gold but mid-range for copper.

While production was down, costs rose. Cash costs for gold rose 3-5% last quarter to US$889/oz, partly reflecting the lower production during the quarter. All-in-sustaining costs, estimated at US$1,248, are also up 3-5% on the quarter, 20% from a year ago.

The production shortfall is largely attributable to the Nevada Gold Mines, where anticipated higher grades did not materialize, though are expected this quarter. Pueblo Viejo in the Dominican Republic partly offset the lower Nevada output.

With dynamic management and world-class assets around the globe, Barrick, trading at low valuation multiples, is a Buy.

Osisko Has Another Record, With Growth Ahead

Osisko Gold Royalties Ltd. (OR:TSX; OR:NYSE) reported another record quarter with deliveries, revenues, and cash margin all at new highs. Production was up 7% quarter-on-quarter, and the company expects this trend to continue into the final quarter of the year, putting it on track to meet its annual guidance, albeit at the low end of the range.

One negative was that the Eagle mine, operated by Victoria Gold, still in ramp-up, had problems with a conveyer, with operations down for two to three weeks. The company bought back 1.3 million shares at a total cost of CA$16.5 million during the quarter.

With conservative management and a built-in pipeline of growth, Osisko is a Buy.

Royal on Track To Meet Guidance

Royal Gold Inc. (RGLD:NASDAQ; RGL:TSX) announced it has sold just 56,000 oz of gold equivalent ounces (GEOs) during the quarter, identical to the previous quarter, though below analyst estimates.

The company had 31,000 ounces in inventory at the quarter end, mostly gold but also silver and copper. The company in on track to achieve the upper end of its annual production guidance.

With quality assets, Royal Gold is a Buy.

Another Strong Quarter for Altius

Altius Minerals Corp. (ALS:TSX.V) reported strong quarterly revenue, though slightly down from Q2, which was a record for the company. For the year-to-date, revenue is up 30% on the comparable period in 2021. The outperformance was attributable to higher thermal coal revenue and strong if expected, revenues from potash.

Once again, the results demonstrate the benefits of a diversified portfolio, as some commodities perform better than others.

During the quarter, Altius purchased additional shares in Labrador Iron Ore Royalty, and it remains active on its buy-back program. Separately, the Supreme Court of Canada ruled in an unrelated case on what constitutes a taking by regulatory action.

This has positive implications for Altius’ ongoing case against Alberta for its action against coal mines on which the company holds royalties.

Although Altius is a core holding for us, given that the volatile stock is at the top of the recent range, we will hold and look for pullbacks to add.

Key Drilling Ahead for Lara

Lara Exploration Ltd. (LRA:TSX.V) has resumed drilling at its Planalto Project in Brazil after receipt of a new permit to extend drilling northwards from the new Cupuzeiro discovery at the project. Additional critical drilling to test the gap between Cupuzeira and the original Homestead deposit is planned once a separate permit is received for that.

Capstone Copper can earn up to 70% in the project on certain conditions.

At this price, Lara is a very strong Buy.

New Targets for Midland

Midland Exploration Inc. (MD:TSX.V) said it had discovered several new mineralized areas of high-grade copper and gold in its strategic alliance with SOQUEM in the Labrador Trough in Quebec. The company will evaluate the results and looks to advance exploration, possibly with drilling next year.

With strong management, a solid balance sheet, and multiple active projects, Midland is a Buy.

BEST BUYS this week include, in addition to the above, Wheaton Precious Metals Corp. (WPM:TSX; WPM:NYSE); Gladstone Investment Corp. (GAIN: NASDAQ); Nestle SA (NESN:VX; NSRGY:OTC); Hutchison Port Holdings Trust (HPHT:Singapore)); Ares Capital Corp. (ARCC:NASDAQ); and Pan American Silver Corp. (PAAS:TSX; PAAS:NASDAQ).


Adrian Day Disclosures:

Adrian Day’s Global Analyst is distributed for $990 per year by Investment Consultants International, Ltd., P.O. Box 6644, Annapolis, MD 21401. (410) 224-8885. www.AdrianDayGlobalAnalyst.com. Publisher: Adrian Day. Owner: Investment Consultants International, Ltd. Staff may have positions in securities discussed herein. Adrian Day is also President of Global Strategic Management (GSM), a registered investment advisor, and a separate company from this service. In his capacity as GSM president, Adrian Day may be buying or selling for clients securities recommended herein concurrently, before or after recommendations herein, and may be acting for clients in a manner contrary to recommendations herein. This is not a solicitation for GSM. Views herein are the editor’s opinion and not fact. All information is believed to be correct, but its accuracy cannot be guaranteed. The owner and editor are not responsible for errors and omissions. © 2022. Adrian Day’s Global Analyst. Information and advice herein are intended purely for the subscriber’s own account. Under no circumstances may any part of a Global Analyst e-mail be copied or distributed without prior written permission of the editor. Given the nature of this service, we will pursue any violations aggressively.

Disclosures:

1) Adrian Day: I, or members of my immediate household or family, own securities of the following companies mentioned in this article: All. I personally am, or members of my immediate household or family are, paid by the following companies mentioned in this article: None. My company has a financial relationship with the following companies mentioned in this article: None. Funds controlled by Adrian Day Asset Management, which is unaffiliated with Adrian Day’s newsletter, hold shares of the following companies mentioned in this article: All. I determined which companies would be included in this article based on my research and understanding of the sector.

2) The following companies mentioned in this article are billboard sponsors of Streetwise Reports: None. Click here for important disclosures about sponsor fees. The information provided above is for informational purposes only and is not a recommendation to buy or sell any security.

3) Statements and opinions expressed are the opinions of the author and not of Streetwise Reports or its officers. The author is wholly responsible for the validity of the statements. The author was not paid by Streetwise Reports for this article. Streetwise Reports was not paid by the author to publish or syndicate this article. Streetwise Reports requires contributing authors to disclose any shareholdings in, or economic relationships with, companies that they write about. Streetwise Reports relies upon the authors to accurately provide this information and Streetwise Reports has no means of verifying its accuracy.

4) This article does not constitute investment advice. Each reader is encouraged to consult with his or her individual financial professional and any action a reader takes as a result of information presented here is his or her own responsibility. By opening this page, each reader accepts and agrees to Streetwise Reports’ terms of use and full legal disclaimer. This article is not a solicitation for investment. Streetwise Reports does not render general or specific investment advice and the information on Streetwise Reports should not be considered a recommendation to buy or sell any security. Streetwise Reports does not endorse or recommend the business, products, services, or securities of any company mentioned on Streetwise Reports.

5) From time to time, Streetwise Reports LLC and its directors, officers, employees, or members of their families, as well as persons interviewed for articles and interviews on the site, may have a long or short position in the securities mentioned. Directors, officers, employees, or members of their immediate families are prohibited from making purchases and/or sales of those securities in the open market or otherwise from the time of the decision to publish an article until three business days after the publication of the article. The foregoing prohibition does not apply to articles that in substance only restate previously published company release. As of the date of this article, officers and/or employees of Streetwise Reports LLC (including members of their household) own securities of  Wheaton Precious Metals Corp. and Pan American Silver Corp., companies mentioned in this article.

Japanese Candlesticks Analysis 26.10.2022 (XAUUSD, NZDUSD, GBPUSD)

Article By RoboForex.com

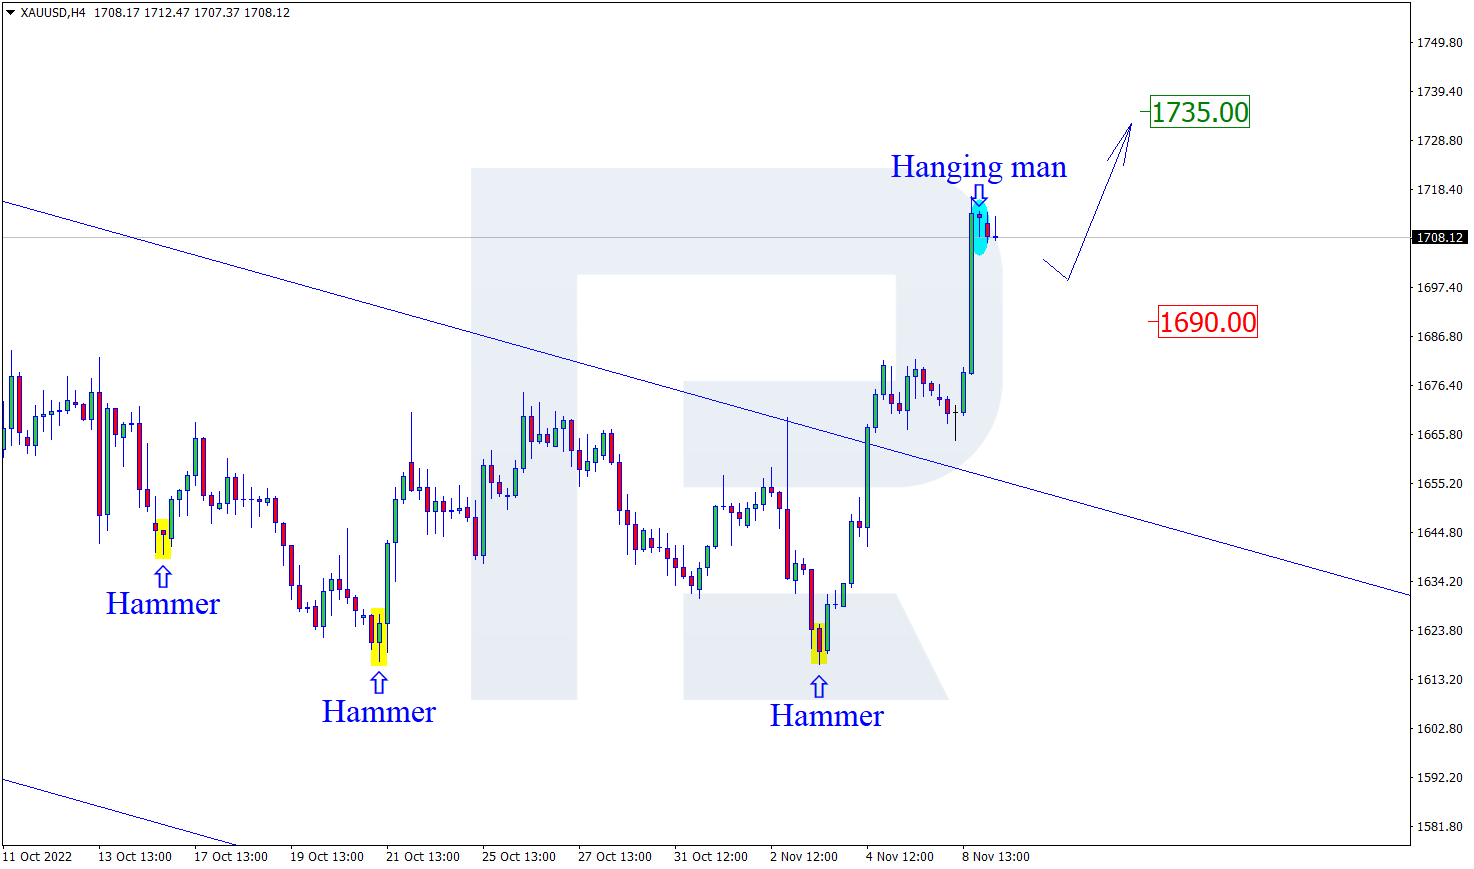
XAUUSD, “Gold vs US Dollar”

At the support level, gold has formed a Hammer reversal pattern. Going by the signal, the pair is forming a correctional wave. The goal of growth will be 1675.50. After a test of the resistance level, the pair might bounce off it and continue the downtrend. However, the quotes may fall to 1640.50 without a pullback to the resistance level.

XAUUSD
Risk Warning: the result of previous trading operations do not guarantee the same results in the future

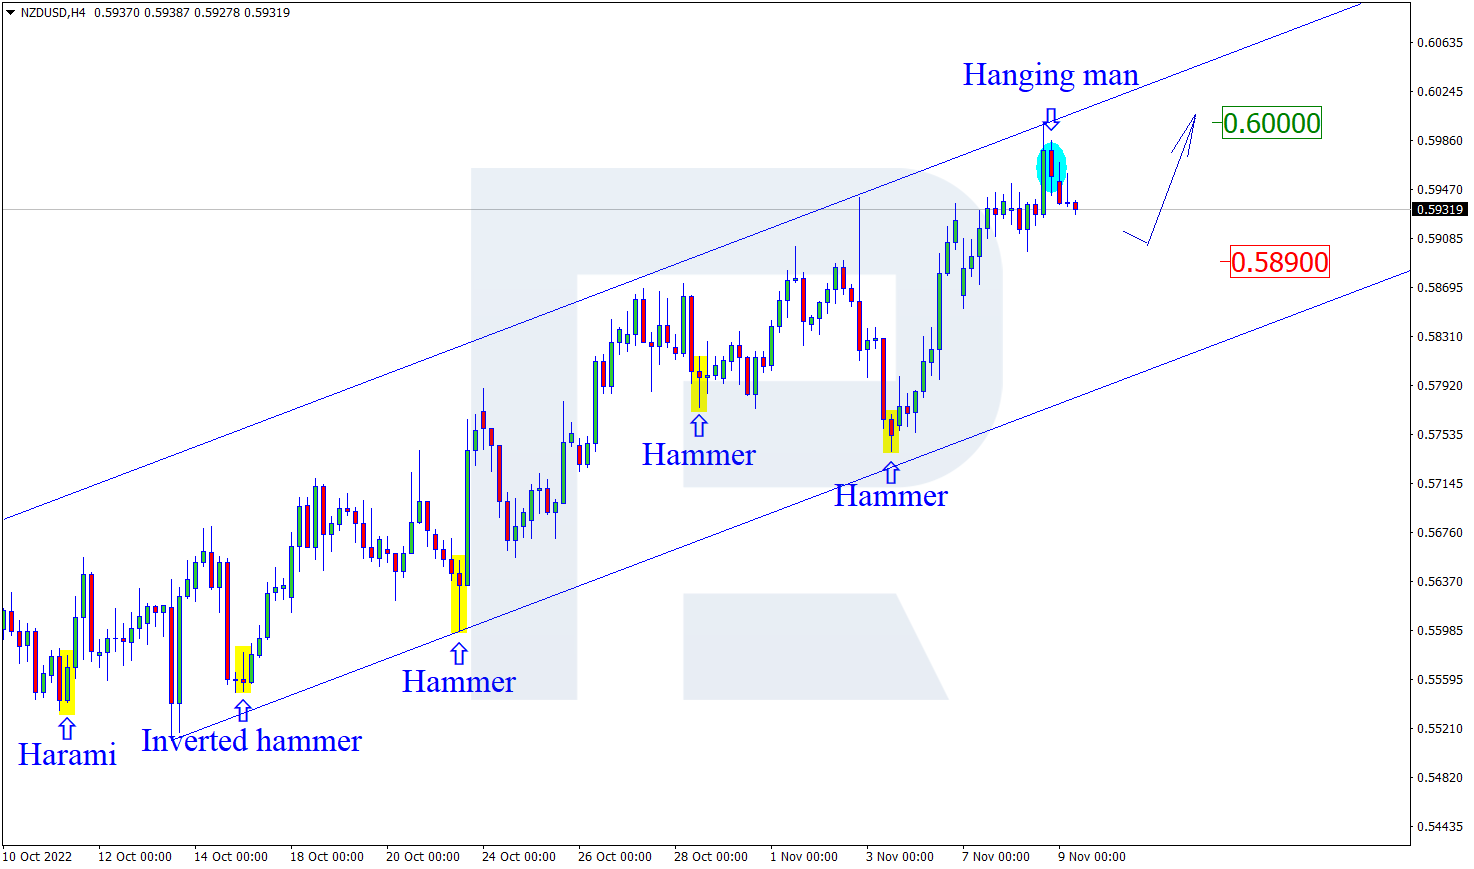
NZDUSD, “New Zealand Dollar vs US Dollar”

On H4, at the support level, the pair has formed a Hammer reversal pattern. The pair is now going by the signal in an ascending wave. The goal of growth will be 0.5825. After a breakaway of the resistance level, the quotes will get a chance to continue the uptrend. However, the price may correct to 0.5735 before growing.

NZDUSD
Risk Warning: the result of previous trading operations do not guarantee the same results in the future

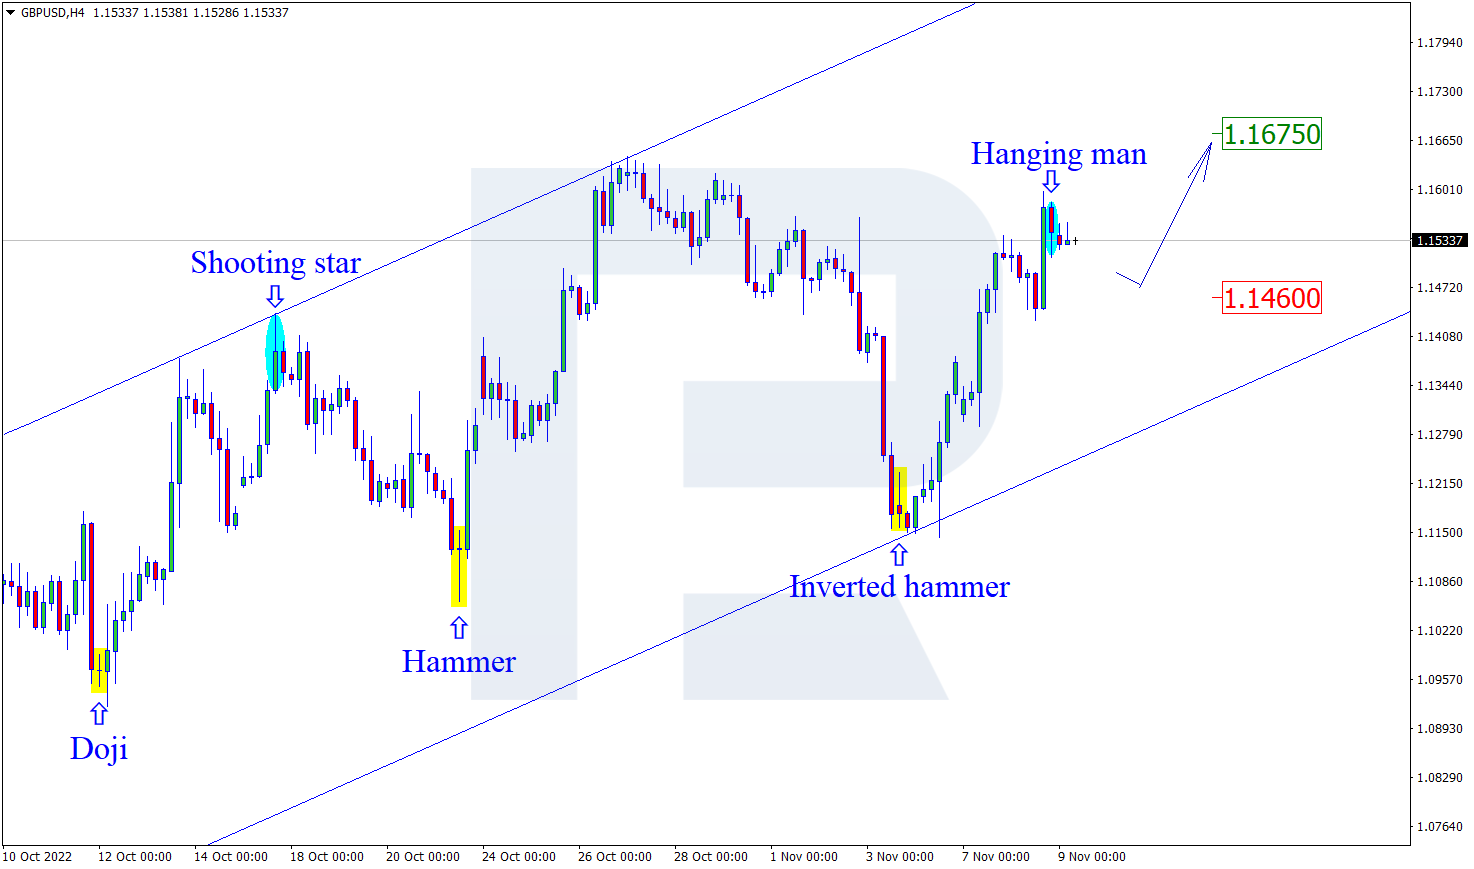
GBPUSD, “Great Britain Pound vs US Dollar”

On H4, at the support level, the pair has formed a Hammer reversal pattern. The pair is now going by the signal in an ascending wave. The goal of growth is the resistance level of 1.1650. If it is broken away, the price will have a chance to continue the downtrend. However, it might drop to 1.1390 before growing.

GBPUSD

Article By RoboForex.com

Attention!
Forecasts presented in this section only reflect the author’s private opinion and should not be considered as guidance for trading. RoboForex LP bears no responsibility for trading results based on trading recommendations described in these analytical reviews.

The cryptocurrency market digest (BTC, Ripple, BITO). Overview for 26.10.2022

Article By RoboForex.com

Finally, the day has come when we have something to say about the BTC. Over the last 24 hours, the leading crypto has grown quite a bit. On Wednesday, it is mainly fluctuating near 20,326 USD.

The BTC even rose to 20,415 USD. This was due to an increase in the US stock indices: the impulse of growth persists on the platform, investors are working it out fully, though it becomes every time harder to buy.

On the one hand, stock market optimism can be explained by market players expecting the Fed to cool down its tightening policy. The Fed has never given such signals apart from certain remarks of the members. It should be reminded that the market has already got trapped by such wild guesses and seems to learn nothing.

On the other hand, nothing nothing has stopped the BTC from growing to 20,000 USD. Yet it failed to secure above 20,500 USD. This means growth to the important resistance level of 21,500 USD is in question.

The crypto market capitalisation is estimated as 979 billion USD. The BTC takes up 39.8%, ETH — 17.7%.

Ripple opened applications for third wave of Creator NFT

Ripple continues working with the Creator NFT and opens the third wave of applications for Creator Fund grants sized 250 million USD. This segment of the programme will be focused on creators and both physical tokens and NFTs.

Bitcoin ETF is losing

The Bitcoin ETF, ProShares (BITO) is suffering serious losses this year. A bit more than a year before placement, the ETF lost 70% of its high of November 2021, following the BTC.

Article By RoboForex.com

Attention!
Forecasts presented in this section only reflect the author’s private opinion and should not be considered as guidance for trading. RoboForex LP bears no responsibility for trading results based on trading recommendations described in these analytical reviews.

Lithium Co. Signs CA$2B Supply Deal With EU Auto Maker

Source: Streetwise Reports  (10/21/22)

Rock Tech Lithium Inc. shares traded 30% higher yesterday after the company reported it executed a five-year supply contract with Mercedes-Benz AG of Germany. Under the terms of the agreement, Rock Tech will provide Mercedes with 10,000 tonnes of battery-grade lithium hydroxide yearly, which is expected to generate CA$2 billion in revenue for the company.

The agreement between the two companies will run for a period of five years and is expected to provide Rock Tech with total revenues of around CA$2 billion over the life of the agreement.

Rock Tech’s CEO Markus Bruegmann remarked, “Signing the Supply Agreement marks a significant milestone of our offtake strategy, and I am honored that Mercedes-Benz demonstrates trust in Rock Tech as a new but reliable player in a diversified European battery supply chain.”

Vancouver B.C.-based lithium explorer and developer Rock Tech Lithium Inc. (RCK:TSX.V; RCKTF:OTCQX; RJIB:FSE; A1XF0V:WKN), which owns a 100% interest in the Georgia Lake lithium project in Ontario’s Thunder Bay Mining District, yesterday announced that “it has entered into a definitive supply agreement with Mercedes-Benz Group AG (MBGYY:OTCMKTS;MBGAF:OTC-Pink) providing for the supply of an average of 10,000 tonnes of battery-grade lithium hydroxide per year.”

The contracted deliveries will account for about 40% of the forecasted annual production from Rock Tech’s planned converter capacity in Guben, Germany.

Rock Tech’s CEO Markus Bruegmann remarked, “Signing the Supply Agreement marks a significant milestone of our offtake strategy, and I am honored that Mercedes-Benz demonstrates trust in Rock Tech as a new but reliable player in a diversified European battery supply chain.”

“We intend to focus our efforts on providing lithium hydroxide that will help to bring Mercedes-Benz’s electric mobility ambitions into action. This arrangement is a major step forward in our plans to directly contribute to clean mobility,” Bruegmann added.

Mercedes-Benz Group’s Chief Technology Officer Markus Schäfer commented, “This significant amount of lithium sourced directly from Rock Tech will help Mercedes-Benz to advance localization of European production of state-of-the-art battery cells. The on average 10,000 tonnes of lithium hydroxide per annum will play a key role in securing the lithium supply for our battery production in Europe to help achieve our ambitious electrification goals.”

It is anticipated that the high-quality lithium hydroxide produced by Rock Tech will allow Mercedes-Benz to scale up production and equip approximately 150,000 electric vehicles (EVs) with premium high-performance batteries.

Both firms are striving to meet their goals of achieving carbon neutrality and, as part of the agreement, are committed to creating a roadmap to achieving CO2-neutral production of lithium hydroxide by year-end 2030. The companies noted that to ensure this objective is met, the agreement specifically requires that “all lithium hydroxide supplied by Rock Tech shall be sourced from mining sites audited by the Initiative for Responsible Mining Assurances (IRMA).”

Rock Tech is headquartered in Vancouver, B.C., and is focused on the exploration and development of lithium properties. The company holds a 100% interest in the Georgia Lake lithium project located within Ontario’s Thunder Bay Mining District. In addition to its upstream activities, the firm is investing in downstream operations, with the first planned lithium hydroxide converter built in Germany to supply the EU auto market with the materials needed to manufacture EV batteries. Approximately 40% of the product produced at this plant will be sold to Mercedes-Benz to satisfy the recently signed 5-year supply contract.

Mercedes-Benz Group AG is dedicated to moving toward CO2 neutrality and is strategically acting to transform its vehicle production to an all-electric platform. The company is highly focused on developing and integrating advanced battery cell technology with higher energy density and safety to increase the quality, range, and performance of its cars and vans.

Rock Tech Lithium has a market cap of around US$178.3 million, with approximately 84.7 million shares outstanding. RCKTF shares opened nearly 28% higher yesterday at US$2.63 (+US$0.572, +27.79%) over the previous day’s US$2.058 closing price. The stock traded yesterday between US$2.44 and US$2.70 per share and closed for trading at US$2.68 (+US$0.622, +30.22%).

Disclosures:
1) Stephen Hytha wrote this article for Streetwise Reports LLC and provides services to Streetwise Reports as an independent contractor. He or members of his household own securities of the following companies mentioned in the article: None. He or members of his household are paid by the following companies mentioned in this article: None.

2) The following companies mentioned in this article are billboard sponsors of Streetwise Reports: None. Click here for important disclosures about sponsor fees.

3) Comments and opinions expressed are those of the specific experts and not of Streetwise Reports or its officers. The information provided above is for informational purposes only and is not a recommendation to buy or sell any security.

4) The article does not constitute investment advice. Each reader is encouraged to consult with his or her individual financial professional and any action a reader takes as a result of information presented here is his or her own responsibility. By opening this page, each reader accepts and agrees to Streetwise Reports’ terms of use and full legal disclaimer. This article is not a solicitation for investment. Streetwise Reports does not render general or specific investment advice and the information on Streetwise Reports should not be considered a recommendation to buy or sell any security. Streetwise Reports does not endorse or recommend the business, products, services or securities of any company mentioned on Streetwise Reports.

5) From time to time, Streetwise Reports LLC and its directors, officers, employees or members of their families, as well as persons interviewed for articles and interviews on the site, may have a long or short position in securities mentioned. Directors, officers, employees or members of their immediate families are prohibited from making purchases and/or sales of those securities in the open market or otherwise from the time of the decision to publish an article until three business days after the publication of the article. The foregoing prohibition does not apply to articles that in substance only restate previously published company releases.

The Analytical Overview of the Main Currency Pairs on 2022.10.26

By JustMarkets

The EUR/USD currency pair

Technical indicators of the currency pair:
  • Prev Open: 0.9872
  • Prev Close: 0.9961
  • % chg. over the last day: +0.90 %

In Germany, the IFO Business Activity Index declined for the fifth month in a row to 84.3 points from a revised 84.4 points in September. But despite the decline, there are signs of stabilization. Although investor expectations have slightly improved for Germany and Europe as a whole, the current component of the assessment is still weak. Germany’s Q3 GDP data will be released later in the week. Analysts expect the economy to contract as companies and households are increasingly affected by higher energy bills and continued high inflation, adjusting consumption and investment.

Trading recommendations
  • Support levels: 0.9897, 0.9873, 0.9835, 0.9755, 0.9601
  • Resistance levels: 0.9961, 1.0058, 1.0111, 1.0162, 1.0230

From the technical point of view, the trend on the EUR/USD currency pair on the hourly time frame is bullish. The price is trading above the moving averages. The MACD indicator is in the positive zone, and the buyers’ pressure remains. Under such market conditions, buy trades should be considered from the support level of 0.9897 or 0.9873, but with additional confirmation in the form of reverse initiative. Sells deals may be considered from the resistance level of 0.9961 or 1.0058, but also with confirmation.

Alternative scenario: if the price breaks down through the support level of 0.9755 and fixes below it, the downtrend will likely resume.

EUR/USD
News feed for 2022.10.26:
  • – German Ifo Business Climate (m/m) at 11:00 (GMT+3);
  • – US CB Consumer Confidence (m/m) at 17:00 (GMT+3);
  • – FOMC Member Waller Speaks at 20:55 (GMT+3).

The GBP/USD currency pair

Technical indicators of the currency pair:
  • Prev Open: 1.1275
  • Prev Close: 1.1465
  • % chg. over the last day: +1.69 %

In his first speech as British Prime Minister, Rishi Sunak promised to right the wrongs of the outgoing administration but hinted that “difficult decisions” lie ahead. This is not surprising since Britain is facing serious fundamental problems: inflation is at a 40-year high, the economy is falling, and there are an energy crisis and rising heating and energy bills. Investors are now turning their attention to the budget proposal due later this month and the upcoming Bank of England meeting on November 3.

Trading recommendations
  • Support levels: 1.1382, 1.1338, 1.1172, 1.1093, 1.0915, 1.0817
  • Resistance levels: 1.1478, 1.1693, 1.1816, 1.1901

From the technical point of view, the trend on the GBP/USD currency pair on the hourly time frame is bullish. The price is trading above the levels of the moving averages. The MACD indicator has become positive, and there is still buying pressure. Under such market conditions, buy trades can be considered from the support level of 1.1382 or 1.1337, but better after confirmation. Sell trades are best to look for on intraday time frames, the nearest resistance level is 1.1478, but it is also better with confirmation since the level has already been tested.

Alternative scenario: if the price breaks down of the 1.1172 support level and fixes below it, the downtrend will likely resume.

GBP/USD
There is no news feed for today.

The USD/JPY currency pair

Technical indicators of the currency pair:
  • Prev Open: 148.88
  • Prev Close: 147.94
  • % chg. over the last day: -0.63 %

According to estimates by broker Central Tanshi Co. the Japanese authorities have spent as much as 5.5 trillion yen (almost $37 billion) to support the yen. Analysts are sure that if the yield of inflation-adjusted government bonds does not improve, this step will only have a temporary effect, as the divergent policies of the Bank of Japan and the US Federal Reserve lead to an increase in the interest rate differential, which is very negative for the Japanese currency. However, BoJ governor Kuroda said last week that the central bank would keep monetary policy soft for at least the rest of the year.

Trading recommendations
  • Support levels: 146.63, 145.88, 144.91, 144.16, 143.00
  • Resistance levels: 148.64, 150.00, 151.05

From the technical point of view, the medium-term trend on the currency pair USD/JPY is bullish despite the currency intervention. The price is trading below the levels of the moving averages. The MACD indicator has become negative, and there is slight sellers’ pressure. Under such market conditions, buy trades can be sought on intraday time frames from the support level of 146.63, but with confirmation. Sell deals can be searched from a resistance level of 148.64, but only with additional confirmation in the form of a reverse initiative.

Alternative scenario: If the price fixes below 145.88, the downtrend will likely resume.

USD/JPY
There is no news feed for today.

The USD/CAD currency pair

Technical indicators of the currency pair:
  • Prev Open: 1.3705
  • Prev Close: 1.3606
  • % chg. over the last day: -0.72 %

The central Bank of Canada will hold a monetary policy and interest rate meeting today. Analysts expect the Bank of Canada to raise the rate by 0.75%, although some experts think the Bank of Canada might raise the rate by 0.5% as the core inflation is growing, the overall consumer inflation has been falling for three months in a row. As a result, the Bank of Canada might need to take a smaller step to avoid “plunging” the economy into a recession.

Trading recommendations
  • Support levels: 1.3583, 1.3535, 1.3454
  • Resistance levels: 1.3678, 1.3795, 1.3855, 1.3968

From the point of view of technical analysis, the trend on the USD/CAD currency pair has changed to bearish. The price has consolidated below the priority level and traded below the moving averages. The MACD indicator has become negative, but there is a divergence, indicating the sellers’ weakness. The best way to sell is to consider the resistance level of 1.3678, but only after additional confirmation in the form of reverse initiative. Buy trades should be considered on the lower time frames from the support level of 1.3583, but it is also better after confirmation.

Alternative scenario: if the price breaks out and consolidates above the resistance level of 1.3855, the uptrend will likely resume.

USD/CAD
There is no news feed for today.

By JustMarkets


This article reflects a personal opinion and should not be interpreted as an investment advice, and/or offer, and/or a persistent request for carrying out financial transactions, and/or a guarantee, and/or a forecast of future events.

Reports from Google and Microsoft disappointed investors. Inflation in Australia reached a 32-year-high

By JustMarkets

At yesterday’s close of the stock market, the Dow Jones Index (US30) increased by 1.07%, and the S&P 500 Index (US500) added 1.63%. Technology Index NASDAQ (US100) gained 2.25% on Tuesday. Investor sentiment improved amid growing expectations that the high-interest rate damage to the US economy may prompt the Federal Reserve to soften its hawkish stance. Also, a positive for the market is the reporting season, but tech giants were disappointing yesterday.

Google Inc (GOOGL) failed to beat quarterly earnings estimates Tuesday as advertisers cut back in the face of the economic downturn. As a result, the company’s stock plummeted nearly 7% on the report release.

Microsoft (MSFT) shares also fell more than 6% in after-hours trading after the software giant disappointed in its revenue growth forecast for its Azure cloud computing business.

On Tuesday, Spotify Technology SA (SPOT) beat Wall Street estimates for third-quarter revenue and subscriber growth but said harsh economic conditions led to slower-than-forecast advertising growth.

The US consumer confidence fell more than expected in October to a three-month low as high inflation, and growing concerns about the economic outlook put pressure on Americans. The drop in confidence shows that the Federal Reserve’s aggressive interest rate hikes are taking a toll on consumers. And with the midterm elections just two weeks away, this is a worrying sign for President Joe Biden and the Democrats, who are trying to maintain their slim majority in Congress. In the future, inflationary pressures will continue to pose strong obstacles to consumer confidence and spending, leading to a difficult holiday season for retailers.

Equity markets in Europe were mostly up yesterday. Germany’s DAX (DE30) gained 0.94%, France’s CAC 40 (FR40) added 1.94%, Spain’s IBEX 35 (ES35) increased by 1.49%, Britain’s FTSE 100 (UK100) closed down slightly by 0.01% on Tuesday.

Deutsche Bank reported a significant jump in earnings in the third quarter despite a downturn in deal-making. UniCredit raised its 2022 earnings target, with the second-largest Italian bank supported by higher interest rates and lower loan loss reserves.

Financial markets are convinced that tomorrow’s ECB meeting will include another significant increase in key interest rates. In line with the last move in September, the only uncertainty concerns the step of raising. The 75-basis-point hike that ECB officials have been talking about in recent weeks is still an unresolved issue since last month, and several Governing Council members demanded only a 50-basis-point increase on the grounds that a possible recession would itself reduce inflationary pressures. And more and more members are now talking about the likelihood of a limited recession in 2023. This week’s meeting will almost certainly also include a discussion of quantitative tightening (QT). But even without QT, financial markets are increasingly convinced that key interest rates are far from their peak. From the current level of 1.25%, analysts are predicting a rate hike to 2.25% by the end of the year.

New Prime Minister Rishi Sunak promises to lead the UK out of its economic crisis. Sunak reappointed Jeremy Hunt as his finance minister to appease markets that had abandoned his predecessor’s debt-driven economic plans. Sunak also warned that difficult decisions lie ahead as he hopes to cut government spending.

Asian markets traded flat yesterday. Japan’s Nikkei 225 (JP225) jumped by 1.02%, Hong Kong’s Hang Seng (HK50) ended the day down by 0.10%, and Australia’s S&P/ASX 200 (AU200) was up by 0.28%. But since the market opened today, Hong Kong’s and China’s shares are showing the best dynamics of the day. Hong Kong’s Hang Seng Index (HK50) jumped by 2% from a 13-year low, while China’s Shanghai Shenzhen CSI 300 blue-chip index increased by 1.4%.

Inflation in Australia has jumped to a 32-year high. The reason for this is a sharp rise in home construction costs and rising gas prices. Data from the Australian Bureau of Statistics showed Wednesday that the consumer price index (CPI) jumped by 1.8% over the last quarter. On an annualized basis, the inflation rate rose from 6.1% to 7.3%. This is negative data that will push the Reserve Bank of Australia (RBA) to resume raising interest rates more aggressively. Initially, the RBA wanted to slow growth so that rising interest rates would not affect consumer spending too much, but that plan has not been successful.

S&P 500 (F) (US500) 3,859.11 +61.77 (+1.63%)

Dow Jones (US30) 31,836.74 +337.12 (+1.07%)

DAX (DE40) 13,052.96 +121.51 (+0.94%)

FTSE 100 (UK100) 7,013.48 −0.51 (−0.01%)

USD Index 110.88 −1.11 (−0.99%)

Important events for today:
  • – Australia Consumer Price Index (m/m) at 03:30 (GMT+3);
  • – US New Home Sales (m/m) at 17:00 (GMT+3);
  • – Canada BoC Monetary Policy Report at 17:00 (GMT+3);
  • – Canada BoC Interest Rate Decision at 17:00 (GMT+3);
  • – US Crude Oil Reserves (w/w) at 17:30 (GMT+3);
  • – Canada BoC Press Conference at 18:00 (GMT+3).

By JustMarkets


This article reflects a personal opinion and should not be interpreted as an investment advice, and/or offer, and/or a persistent request for carrying out financial transactions, and/or a guarantee, and/or a forecast of future events.

Is This the Vaunted Fed Pivot?

Source: Clive Maund  (10/24/22)

Expert Clive Maund believes the Fed may pivot soon. Read to find out why he believes this is true and where he thinks the market is heading.

The stock market was at a critical juncture by late last week, and without Fed intervention, or at least the talk of Fed intervention, it would have plunged, so right on cue, it was put about that the Fed would “pivot” soon, meaning abandon its policy of jacking up interest rates to battle inflation (a battle it cannot win, by the way).

This was, of course, what the oversold market wanted to hear, and the effect was immediate, with early losses being reversed and the Dow closing up almost 750 points on the day as yields started to drop and the dollar took a hit.

It hardly looks like the time has arrived to start cracking open the champagne, for overall, the setup remains incredibly dangerous, so if the Fed doesn’t deliver with a “pivot,” or even if it does and it has little effect, the market could yet turn tail and plunge.

If the Fed (and other central banks) keep creating money at an exponentially faster rate than they are now to stop the debt markets from imploding, the result will be hyperinflation, and we are heading in that direction already.

In the writer’s view (that is to say me), this way of carrying on suits the Globalists or New World Order just fine.

After all, they have already had the effrontery to put up loads of adverts saying, “You will own nothing and be happy,” and a policy of continually expanding the money supply will enable them to buy up everything and, at the same time exterminate the population at large by creating hyperinflation that renders them destitute so that they end up going “cap in hand” for their universal-basic-income subsistence handouts which they will have to qualify for by being fully vaxxed and not visiting websites that their Masters don’t approve of, etc.

Clearly, if this is the approach they adopt, it could have a stabilizing effect on the markets regardless of the economy being in terminal decline.

Thus it was that the mere hint yesterday of the Fed going easy caused a dramatic reversal in markets back to risk-on, and the S&P500 index (and other índices) finished the day with a nice big white candle on their charts, as we can see on the latest 6-month chart for the S&P500 index below.

If the Fed takes the easy way out, which is to keep creating money until it leads to hyperinflation, then the precious metals (and many other commodities) should soar.

Incidentally, this positive candle builds on the impressive “bullish engulfing pattern” reversal that appeared the week before last, which involved an impressive large white candle, so it is looking increasingly like the market has put in an intermediate low for now.

However, that said, it hardly looks like the time has arrived to start cracking open the champagne, for overall, the setup remains incredibly dangerous, so if the Fed doesn’t deliver with a “pivot,” or even if it does and it has little effect, the market could yet turn tail and plunge.

We can see the horribly bearish setup on the latest 5-year chart for the S&P500 index, which would not be changed by a rally in the coming weeks back up to the Dome boundary.

What could be going on now is that the Fed is complicit in massaging sentiment to keep the market propped up until the mid-terms, after which they may permit it to drop like a rock. Therefore a good tactic may be to see if the market can make it up to or near to the Dome boundary, at which point it will be time to thin positions or lay on more hedges, buy tranches of Puts at good prices, etc.

We will be on the lookout for this.

The chart for the 2008 crash is shown below to enable you to see the uncanny similarity between then and now.

The difference is that if the markets do crash soon, they won’t bounce back afterward as in 2008 and 2009.

This is because the bond market will be crashing, too, as there will be no QE card to play, unlike last time, as the entire system flies apart.

On the 6-month chart for the S&P500 index, we can see the large bullish engulfing pattern that appeared the week before last, which marked the turn, and the impressive white candle that occurred yesterday as the Fed leaked out hints that it will “pivot.”

We will be turning our attention to the precious metals sector tomorrow since clearly, if the Fed takes the easy way out, which is to keep creating money until it leads to hyperinflation, then the precious metals (and many other commodities) should soar, so it’s no wonder we saw impressive action in many PM stocks yesterday. Keep in mind the political motivations for keeping the markets propped up until the mid-terms.

CliveMaund.com Disclosures

The above represents the opinion and analysis of Mr. Maund, based on data available to him, at the time of writing. Mr. Maund’s opinions are his own, and are not a recommendation or an offer to buy or sell securities. Mr. Maund is an independent analyst who receives no compensation of any kind from any groups, individuals or corporations mentioned in his reports. As trading and investing in any financial markets may involve serious risk of loss, Mr. Maund recommends that you consult with a qualified investment advisor, one licensed by appropriate regulatory agencies in your legal jurisdiction and do your own due diligence and research when making any kind of a transaction with financial ramifications. Although a qualified and experienced stock market analyst, Clive Maund is not a Registered Securities Advisor. Therefore Mr. Maund’s opinions on the market and stocks can only be construed as a solicitation to buy and sell securities when they are subject to the prior approval and endorsement of a Registered Securities Advisor operating in accordance with the appropriate regulations in your area of jurisdiction.

Disclosures:
1) Statements and opinions expressed are the opinions of Clive Maund and not of Streetwise Reports or its officers. The author is wholly responsible for the validity of the statements. Streetwise Reports was not involved in any aspect of the article preparation. The author was not paid by Streetwise Reports LLC for this article. Streetwise Reports was not paid by the author to publish or syndicate this article.

2) This article does not constitute investment advice. Each reader is encouraged to consult with his or her individual financial professional and any action a reader takes as a result of information presented here is his or her own responsibility. By opening this page, each reader accepts and agrees to Streetwise Reports’ terms of use and full legal disclaimer. This article is not a solicitation for investment. Streetwise Reports does not render general or specific investment advice and the information on Streetwise Reports should not be considered a recommendation to buy or sell any security. Streetwise Reports does not endorse or recommend the business, products, services or securities of any company mentioned on Streetwise Reports.

3) From time to time, Streetwise Reports LLC and its directors, officers, employees or members of their families, as well as persons interviewed for articles and interviews on the site, may have a long or short position in securities mentioned. Directors, officers, employees or members of their immediate families are prohibited from making purchases and/or sales of those securities in the open market or otherwise from the time of the decision to publish an article until three business days after the publication of the article. The foregoing prohibition does not apply to articles that in substance only restate previously published company releases.

Murrey Math Lines 25.10.2022 (AUDUSD, NZDUSD)

Article By RoboForex.com

AUDUSD, “Australian Dollar vs US Dollar”

On H4, the quotes are under the 200-day Moving Average, indicating the prevalence of a downtrend. The RSI has broken through the support level. A test of 3/8 (0.6225) should be expected, followed by a breakaway and falling to the support level of 2/8 (0.6103). The scenario can be cancelled by the price rising over the resistance level of 4/8 (0.6347). After this, the pair may rise to 5/8 (0.6469).

AUDUSDH4
Risk Warning: the result of previous trading operations do not guarantee the same results in the future

On M15, a breakaway of the lower border of VoltyChannel will increase the probability of a decline to 5/8 (0.6469) on H4.

AUDUSD_M15
Risk Warning: the result of previous trading operations do not guarantee the same results in the future

NZDUSD, “New Zealand Dollar vs US Dollar”

On H4, the quotes are also under the 200-day Moving Average, indicating a downtrend, and on the RSI, the support level has been broken. A test of 2/8 (0.5615) is expected, followed by a breakaway and falling to the support level of 1/8 (0.5493). The scenario can be cancelled by coming over the resistance level of 3/8 (0.5737). This can provoke growth of the pair to 4/8 (0.5859).

NZDUSD_H4
Risk Warning: the result of previous trading operations do not guarantee the same results in the future

On M15, the decline can be additionally supporter by a breakaway of the lower border of the VoltyChannel.

NZDUSD_M15

Article By RoboForex.com

Attention!
Forecasts presented in this section only reflect the author’s private opinion and should not be considered as guidance for trading. RoboForex LP bears no responsibility for trading results based on trading recommendations described in these analytical reviews.

Japanese Candlesticks Analysis 25.10.2022 (EURUSD, USDJPY, EURGBP)

Article By RoboForex.com

EURUSD, “Euro vs US Dollar”

On H4, at the resistance level, the pair has formed a Harami reversal pattern. If the pair now goes by the signal, it will end up in a descending wave. The goal of the decline is 0.9795. However, the pair may still rise to 0.9925, bounce off it, and continue the downtrend after the correction.

EURUSD
Risk Warning: the result of previous trading operations do not guarantee the same results in the future

USDJPY, “US Dollar vs Japanese Yen”

On H4, at the support level the pair has formed a Harami reversal pattern. Currently the pair may go by the signal in an ascending wave. The goal of the growth is 150.90. However, the price may still pull back to 148.00, so that the uptrend continues upon correcting to the support level.

USDJPY
Risk Warning: the result of previous trading operations do not guarantee the same results in the future

EURGBP, “Euro vs Great Britain Pound”

On H4, a Hammer reversal pattern has formed. Currently, the pair may go by the signal in an ascending wave. The goal of growth might be the resistance level of 0.8870. Upon testing and breaking through it, the pair will have the chance to continue the uptrend. However, the quotes may still pull back to 0.8695 before growing to the resistance level.

EURGBP
Risk Warning: the result of previous trading operations do not guarantee the same results in the future

Article By RoboForex.com

Attention!
Forecasts presented in this section only reflect the author’s private opinion and should not be considered as guidance for trading. RoboForex LP bears no responsibility for trading results based on trading recommendations described in these analytical reviews.