By Jim Krane, Jones Graduate School of Business at Rice University
What’s the cheapest, quickest way to reduce climate change without roiling the economy? In the United States, it may be by reducing methane emissions from the oil and gas industry.
Methane is the main component of natural gas, and it can leak anywhere along the supply chain, from the wellhead and processing plant, through pipelines and distribution lines, all the way to the burner of your home’s stove or furnace.
Once it reaches the atmosphere, methane’s super heat-trapping properties render it a major agent of warming. Over 20 years, methane causes 85 times more warming than the same amount of carbon dioxide. But methane doesn’t stay in the atmosphere for long, so stopping methane leaks today can have a fast impact on lowering global temperatures.
That’s one reason governments at the 2022 United Nations climate change conference in Egypt focused on methane as an easy win in the climate battle.
So far, 150 countries, including the United States and most of the big oil producers other than Russia, have pledged to reduce methane emissions from oil and gas by at least 30%. China has not signed but has agreed to reduce emissions. If those pledges are met, the result would be equivalent to eliminating the greenhouse gas emissions from all of the world’s cars, trucks, buses and all two- and three-wheeled vehicles, according to the International Energy Agency.
There’s also another reason for the methane focus, and it makes this strategy more likely to succeed: Stopping methane leaks from the oil and gas industry can largely pay for itself and boost the amount of fuel available.
Capturing methane can pay off
Methane is produced by decaying organic material. Natural sources, such as wetlands, account for roughly 40% of today’s global methane emissions. But the majority comes from human activities, such as farms, landfills and wastewater treatment plants – and fuel production. Oil, gas and coal together make up about a third of global methane emissions.
In all, methane is responsible for almost a third of the 1.2 degrees Celsius (2.2 degrees Fahrenheit) that global temperatures have risen since the industrial era.
Unfortunately, methane emissions are still rising. In 2021, atmospheric levels increased to 1,908 parts per billion, the highest levels in at least 800,000 years. Last year’s increase of 18 parts per billion was the biggest on record.
Among the sources, the oil and gas sector is best equipped to stop emitting because it is already configured to sell any methane it can prevent from leaking.
Methane leaks and “venting” in the oil and gas sector have numerous causes. Unintentional leaks can flow from pneumatic devices, valves, compressors and storage tanks, which often are designed to vent methane when pressures build.
Unlit or inefficient flares are another big source. Some companies routinely burn off excess gas that they can’t easily capture or don’t have the pipeline capacity to transport, but that still releases methane and carbon dioxide into the atmosphere.
Nearly all of these emissions can be stopped with new components or regulations that prohibit routine flaring.
Making those repairs can pay off. Global oil and gas operations emitted more methane in 2021 than Canada consumed that entire year, according to IEA estimates. If that gas were captured, at current U.S. prices – $4 per million British thermal unit – that wasted methane would fetch around $17 billion. The IEA determined that a one-time investment of $11 billion would eliminate roughly 75% of methane leaks worldwide, along with an even larger amount of gas that is wasted by “flaring” or burning it off at the wellhead.
The repairs and infrastructure investments would not only reduce warming, but they would also generate profits for producers and provide direly needed natural gas to markets undergoing drastic shortages due to Russia’s invasion of Ukraine.
Getting companies to cut methane emissions
Motivating U.S. producers to act has been the big hurdle.
The Biden administration is aiming for an 87% reduction in methane emissions below 2005 levels by the end of the decade. To get there, it has reimposed and strengthened U.S. methane rules that were dropped by the Trump administration. These include requiring drillers to find and repair leaks at more than 1 million U.S. well sites.
The U.S. Inflation Reduction Act of 2022 further incentivizes methane mitigation, including by levying an emissions tax on large oil and gas producers starting at $900 per ton in 2024, increasing to $1,500 in 2026. That fee, which can be waived by the Environmental Protection Agency and doesn’t affect small producers or leaks below 0.2% of gas produced, is based on the social cost to society from methane’s contribution to climate damage.
Customers are also putting pressure on the industry. Regulatory indifference by the Trump administration to U.S. methane flaring and venting led to cancellation of some European plans to import U.S. liquefied natural gas.
Reducing methane isn’t always straightforward, though, particularly in the U.S., where thousands of oil companies operate with minimal oversight.
A company’s methane emissions aren’t necessarily proportional to its oil and gas production, either. For example, a 2021 study using data from the EPA found Texas-based Hilcorp Energy reporting nearly 50% more methane emissions than ExxonMobil, despite producing less oil and gas. Hilcorp, which specializes in acquiring “late life” assets, says it is working to reduce emissions. Other little-known producers have also reported large emissions.
Investor pressure has pushed several publicly traded companies to reduce their methane emissions, but in practice this sometimes leads them to sell off “dirty” assets to smaller operators with less oversight.
In such a situation, the easiest way to encourage companies to clean up is via a tax. Done right, companies would act before they had to pay.
Using technology to keep emissions in check
Unlike carbon dioxide, which lingers in the atmosphere for a century or more, methane only sticks around for about a dozen years. So, if humans stop replenishing methane stocks in the atmosphere, those levels will decline.
A review of methane leaks in the Permian Basin shows the big impact that some regions can have.
Researchers found that gas and oil operations in the Permian, in west Texas and New Mexico, had a leakage rate estimated at 3.7% in 2018 and 2019, before the pandemic. A 2012 study found that leakage rates above 3.2% make climate damage from using natural gas worse than that from burning coal, which is normally considered the biggest climate threat.
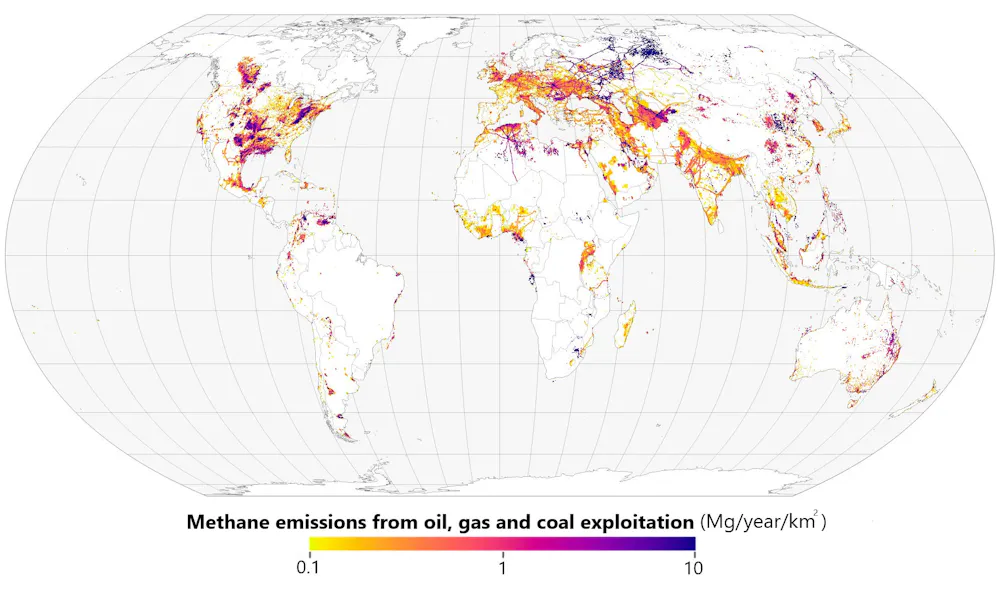
Joshua Stevens/NASA Earth Observatory
Methane leaks used to escape detection because the gas is invisible. Now, the proliferation of satellite-based sensors and infrared cameras makes detection easy.
Companies such as GTI Energy’s Veritas, Project Canary and MiQ have also launched to assist natural gas producers in reducing emissions and then verifying the reductions. At that point, if leaks are less than 0.2%, producers can avoid the federal fee and also market their output as “responsibly sourced” gas.![]()
About the Author:
Jim Krane, Fellow for Energy Studies, Baker Institute for Public Policy; Lecturer, Jones Graduate School of Business at Rice University
This article is republished from The Conversation under a Creative Commons license. Read the original article.