On Monday, the market major is neutral near 1.0800. The market has got all the info at hand: the decision of the Federal Reserve System to lift the interest rate by 25 base points and the confirmation of the ECB mood for it has lifted the rate by 50 base points.
The Fed will go on lifting the rate smoothly but is “mentally” preparing to put an end to the cycle. As for the ECB, it is decisive about lifting the rate until it gets inflation under control. As long as it lost quite a lot of time on monitoring the situation, things look quite logical.
The US employment market in January proved strong. The unemployment rate dropped to 3.4%, average wage grew by 0.3% m/m as expected. 517 thousand new workplaces were created by the NFP report, which is much more than forecast. The data taken together gave great support to the USD.
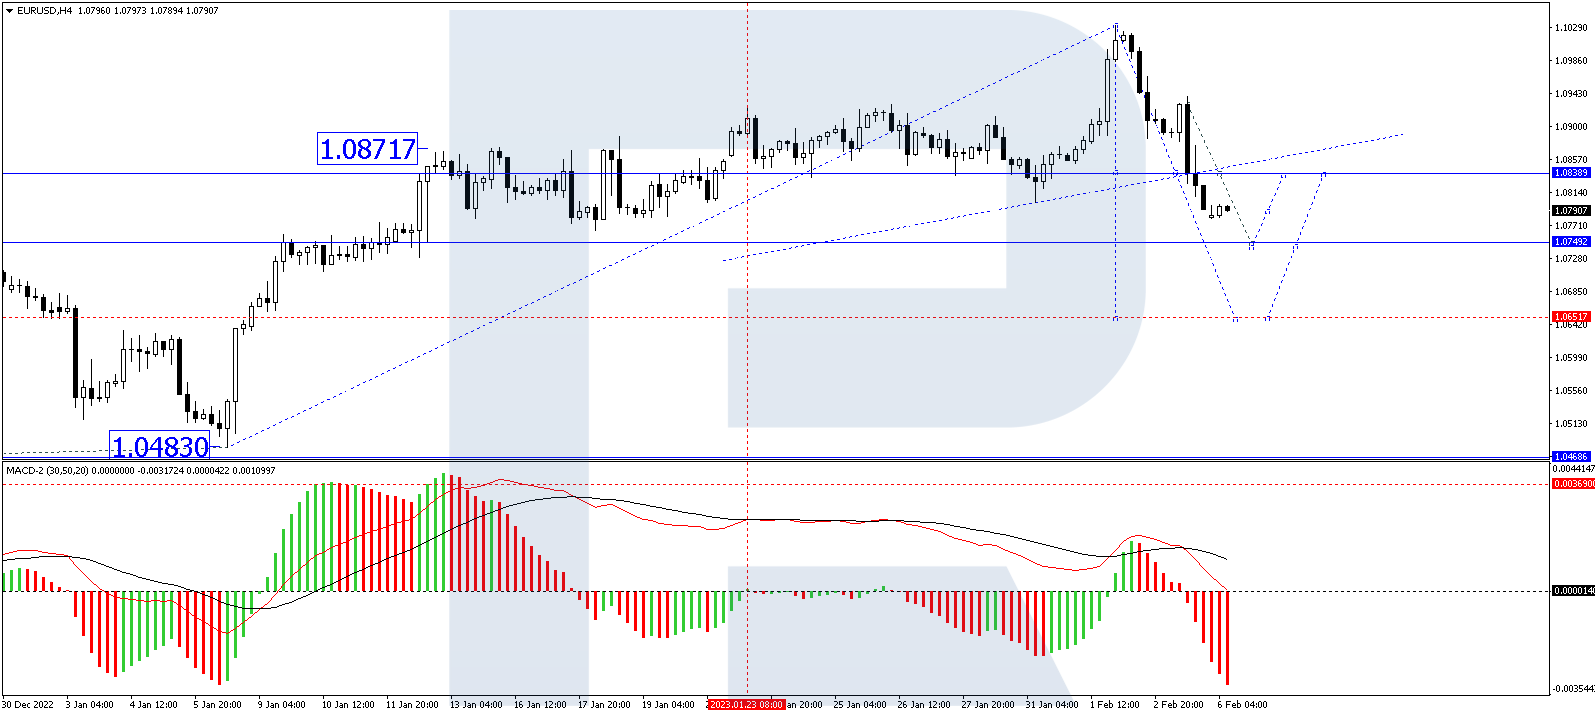
On H4, EURUSD has completed a wave of decline to 1.0840. Practically, this level has become a breakthrough for the ascending channel. At the moment, the market formed a consolidation range around this point, and with an escape downwards it opened a pathway for decline to 1.0750. After it is reached, a correction to 1.0840 should follow, and after that – a decline to 1.0650. Technically, this scenario is confirmed by the MACD. Its signal line is heading strictly downwards, getting ready to break through the zero level.
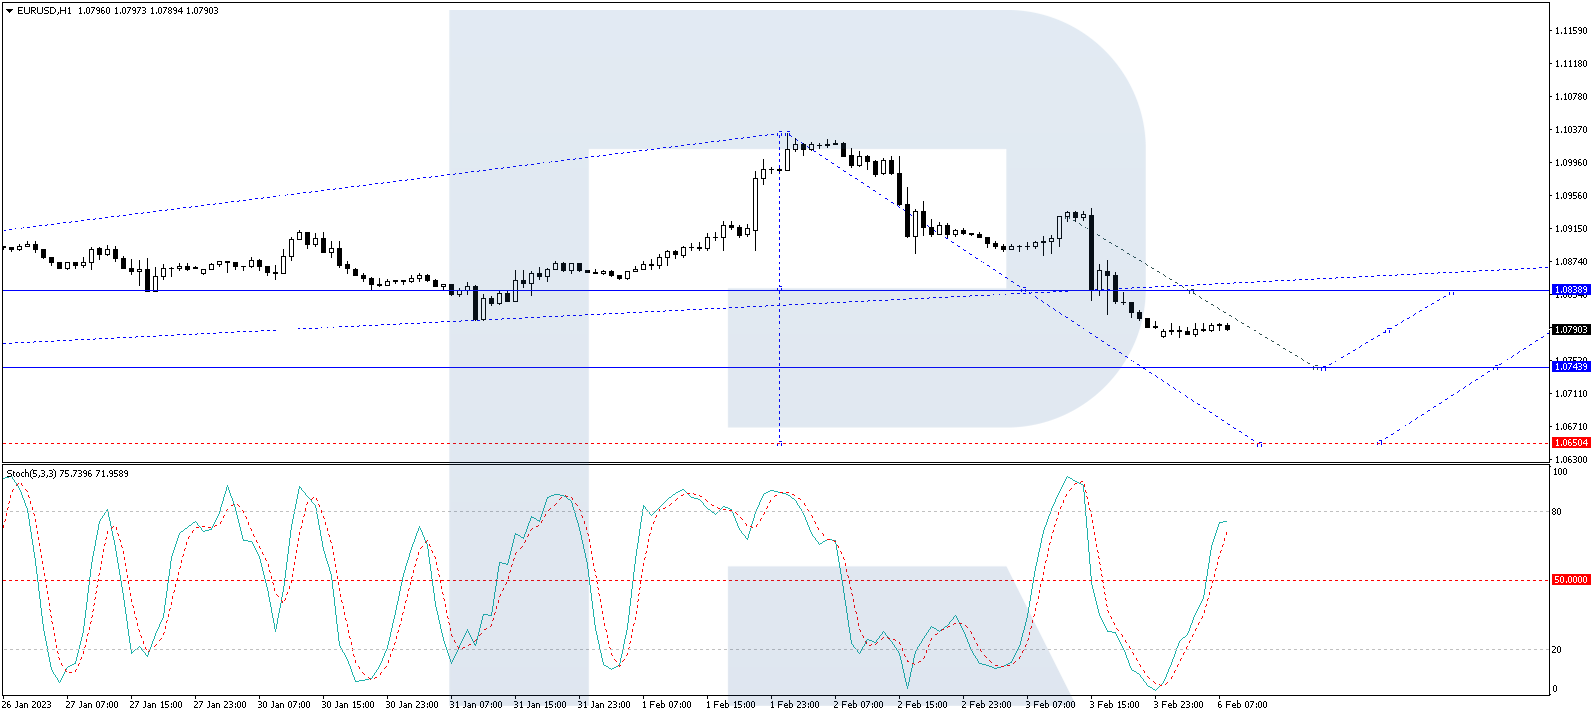
On H1, the pair has formed a structure of a consolidation range around 1.0840. With an escape downwards, a pathway for decline to 1.0750 will open. Then a correction up to 1.0840 and a decline to 1.0650 should follow. Technically, this scenario is confirmed by the Stochastic oscillator. Its signal line is above 50. A decline to 20 is expected.
Disclaimer
Any forecasts contained herein are based on the author’s particular opinion. This analysis may not be treated as trading advice. RoboForex bears no responsibility for trading results based on trading recommendations and reviews contained herein.
The BTC lost its foothold and dropped to 22,787 USD. The decline over the week amounts to 3.95%.
After last Friday the US employment statistics was out, investors got anxious about future reactions of the Fed. The report was strong, which could assure the Fed about further tightening the credit and monetary policy. This is bad for the stock market, the S&P 500 and Nasdaq indices, with whom the BTC has quite a serious correlation.
An important support level is 23,000 USD. The faster the BTC returns above it, the better.
Capitalisation of the crypto market is 1.056 trillion USD. This result has lasted above trillion for 3 weeks, which gives reasons for being cautiously optimistic: investors are beginning to act. The BTC takes up 41.5% of the market and the ETH – 18.7%.
Digital pound may appear in 2030
The Bank of England and Treasury do not exclude the probability of issuing digital pound because the country needs it while cash is being used less and less. Statistics show that in 2021 only 15% of all transactions were in cash, while in 2011 the share was 50%.
Cardano: great result in 2023
Since the beginning of the year, the ADA has grown by 65%, and capitalisation of the project has extended to 13.81 billion USD from 8.63 billion USD. Thus, the ADA has become number 8 in the rating of the most required crypto. The main support comes from large investors.
FTX claims refund from politicians
The FTX crypto exchange asks all politicians who has received some financial support to give it back by the end of February. All politicians in question have received confidential messages. The total sum is 93 million USD.
Attention! Forecasts presented in this section only reflect the author’s private opinion and should not be considered as guidance for trading. RoboForex LP bears no responsibility for trading results based on trading recommendations described in these analytical reviews.
According to the US Bureau of Labor Statistics, total Nonfarm Payrolls rose by 517K in January (forecast 190K, forecast 223K), and the unemployment rate declined to 3.4% (forecast 3.6%, forecast 3.5%). The very strong labor market data leaves more leeway for the US Federal Reserve to keep raising rates. This brought panic back into the market as investors rushed to sell stocks and buy dollars. Financial markets are currently pricing in another 25 basis point rate hike at the US Fed’s March meeting and another 50 basis point hike from the ECB. In the medium term, a reduction in the interest rate spread should play for the European currency’s strengthening.
The trend on the EUR/USD currency pair on the hourly time frame has changed to bearish. The price broke through the priority change level and consolidated lower. The MACD indicator is deeply negative, with no signs of a reversal. Under such market conditions, it is best to wait for a small pullback as the price has deviated strongly from the moving averages. Buy trades are best considered from the support level of 1.0781, but confirmation in the form of a reversal on the lower time frames is needed. Sell deals can be considered from the resistance level of 1.0838, but it is also better with confirmation in the form of a reverse initiative.
Alternative scenario: if the price breaks down through the resistance level of 1.0967 and fixes above it, the uptrend will likely resume.
News feed for 2023.02.06:
– Eurozone Retail Sales (m/m) at 12:00 (GMT+2);
– ECB President Lagarde’s Speech at 20:00 (GMT+2).
The GBP/USD currency pair
Technical indicators of the currency pair:
Prev Open: 1.2224
Prev Close: 1.2052
% chg. over the last day: -1.43 %
The Bank of England said last week that the UK is still set for a recession this year, but it will probably not be as deep as previously feared because of falling energy prices and weaker market interest rate expectations. Analysts believe that the current rate level of 4% may be the cap rate for the UK. The Monetary Policy Committee of England (MPC) abandoned the wording “may require a further increase in the bank rate,” which was constantly present in the meeting minutes. But everything will depend on the next inflation and GDP data. If inflation proves to be more robust and widespread, the Bank of England may hold another rate hike.
Trading recommendations
Support levels: 1.2035, 1.2000, 1.1930
Resistance levels: 1.2182, 1.2228, 1.2311, 1.2416
From the technical point of view, the trend on the GBP/USD currency pair on the hourly time frame has changed to bearish. The price declined sharply on the news on Friday and consolidated below the priority change level. The MACD indicator is in the negative zone with no signs of a reversal. Under such market conditions, it is better to look for buy trades on intraday time frames from the support level of 1.2000, but with confirmation in the form of a reverse initiative. It is best to look for sell deals after the pullback, as the price has deviated strongly from the moving averages. The best resistance levels are 1.2147 and 1.2228, but it is also better with a confirmation in the form of the reverse initiative.
Alternative scenario: if the price breaks out through the 1.2416 resistance level and fixes above it, the uptrend will likely resume.
News feed for 2023.02.06:
– UK Construction PMI (m/m) at 11:30 (GMT+2).
The USD/JPY currency pair
Technical indicators of the currency pair:
Prev Open: 128.65
Prev Close: 131.18
% chg. over the last day: +1.96 %
A sharp jump in the dollar index on the back of strong US labor market data led to an increase in USD/JPY quotes on Friday. The US Fed has more leeway to raise rates further, while the Bank of Japan continues to hold rates at negative levels and maintain its stimulative policy, even though inflation in the country is at a 42-year high and is expected to rise further. An increase in the interest rate differential will have a negative impact on the Japanese Yen, with Japan’s GDP growth not being able to offset this impact.
Trading recommendations
Support levels: 129.98, 129.19, 129.04, 128.16
Resistance levels: 132.37, 132.95, 133.23
From the technical point of view, the medium-term trend on the currency pair USD/JPY has changed to bullish. The price strongly deviated from the moving averages. The MACD indicator is in the positive zone with signs of overbought but without divergence. It is better to look for buy trades after a slight correction to the support levels in the “discount” zone — 129.98 or 129.19, but only with confirmation on the lower time frames. At a minimum, it is necessary to wait for the correction to the level of 131.10. Sell deals can be sought after the impulse return of the price below the level of 131.58, which will form a false breakout area above the level.
Alternative scenario: If the price fixes below the support level of 128.16, the downtrend will be renewed with a high probability.
There is no news feed for today.
The USD/CAD currency pair
Technical indicators of the currency pair:
Prev Open: 1.3314
Prev Close: 1.3389
% chg. over the last day: +0.64 %
The Canadian dollar is a commodity currency and is dependent on instruments such as the dollar index and oil. Oil prices dropped sharply on Friday on the back of a stronger dollar index. The market is also pressured by sanctions on Russian oil products, which came into force on February 5. At the same time, traders should not forget about oil reserves, which have reached their highest level since the summer of 2021. What’s next? China’s opening continues. Hence traders should expect demand to increase. Russian oil will be limited in price, and the amount of Russian oil on the market will decrease. All this might lead to a new jump in oil prices, but only after the strategic reserves start to decline.
From the point of view of technical analysis, the trend on the USD/CAD currency pair is bearish. But the price is close to the priority change level, and the buyers prevail inside the day. The MACD indicator is in the positive zone, but there are the first signs of weakness. Sell deals should be considered from the resistance level at 1.3424 or 1.3448 in case there is a reversal in the intraday time frames. Buy trades could be considered from the 1.3333 support level, but with additional confirmation in the form of an impulse initiative.
Alternative scenario: if the price breaks out and consolidates above the resistance level of 1.3424, the uptrend will likely resume.
This article reflects a personal opinion and should not be interpreted as an investment advice, and/or offer, and/or a persistent request for carrying out financial transactions, and/or a guarantee, and/or a forecast of future events.
Friday’s US jobs report caused investors to revise their expectations of how hawkish the Fed might be in its efforts to rein in inflation. Nonfarm payrolls showed 517K (forecast 190K, previous 223K). The unemployment rate fell to 3.4% (forecast 3.6%, previous 3.5%). Very strong labor market data leaves the US Fed with more leeway to keep raising rates. Investors are concerned that excessive Fed rate hikes will cause a recession in the economy. That’s why such labor market data caused a sell-off in the stock market. At the close of the stock market on Friday, the Dow Jones Index (US30) decreased by 0.38% (+0.05% for the week), while the S&P 500 (US500) lost 1.04% (+2.15% for the week). The NASDAQ Technology Index (US100) fell by 1.59% (+4.30% for the week).
The earning season continues this week, and mainly consumer and industrial companies will report. The calendar includes such companies as Walt Disney (DIS), News Corp (NWSA), New York Times (NYT), Fox Corp A (FOXA), PepsiCo (PEP), Kellogg (K), Activision Blizzard (ATVI), Pinterest (PINS), BP (BP), TotalEnergies SE ADR (TTE), Uber Tech (UBER), Toyota Motor ADR (TM), AbbVie (ABBV), AstraZeneca ADR (AZN), Philip Morris (PM), PayPal Holdings Inc (PYPL), BNP Paribas ADR (BNPQY), L’Oreal ADR (LRLCY) and others. Refinitiv expects S&P 500 earnings to fall by 2.4% in the fourth quarter from a year ago, a sharper drop than the 1.6% forecast on January 1, after 190 companies reported.
Equity markets in Europe traded flat on Friday but closed the week on the plus side. German DAX (DE30) decreased by 0.21% (+2.69% for the week), French CAC 40 (FR40) gained 0.94% (+2.55% for the week), Spanish IBEX 35 (ES35) lost 0.04% (+1.94% for the week), British FTSE 100 (UK100) added 1.04% (+1.76% for the week).
The Bank of England raised its November GDP forecast for the fourth quarter from a slight decline of 0.1% (q/q) to a minimum growth of 0.1% (q/q). On the one hand, this is positive, indicating that this year’s recession is likely to be “much shallower” than previously forecast. But in the event of a negative GDP report this week, the UK economy will fall into a technical recession, which is defined as two consecutive quarters of negative economic growth.
Gold fell nearly 3% Friday after a strong US jobs report in January triggered profit-taking on the precious metal’s long rally. Gold has an inverse correlation to the dollar index and government bond yields, so a rise in the dollar is almost always negative for the precious metal.
Crude oil prices decreased by 7% for the week. The benchmark Brent oil fell below $80 a barrel, and WTI (West Texas Intermediate) fell to $70 a barrel. This was caused by the growth of the dollar index, as well as by the excessive fuel in strategic reserves. The market was also pressured by the OPEC+ decision last week to leave production levels unchanged and uncertainty over how good demand from China will be in February. The US and European Union sanctions on Russian fuel products, which took effect on Sunday, should significantly hit Moscow’s oil revenues. However, analysts believe that, on the contrary, it may lead to an increase in oil prices because, considering the current level of demand to the level of oil production, the ban on Russian oil may lead to a shortage of “black gold” in the market.
Natural gas futures fell by 21% over the week despite the onset of frost in the key northeastern US region. An unusually warm start to the winter of 2022/23 resulted in a significant reduction in heating demand in the United States compared to the norm, leaving more gas in storage than originally anticipated. In Europe, the situation is similar. By all indicators, natural gas prices are extremely oversold, so analysts expect at least a short-term rebound.
Asian markets traded without a single dynamic last week. Japan’s Nikkei 225 (JP225) gained 0.46% over the week, China’s FTSE China A50 (CHA50) declined by 4.92%, Hong Kong’s Hang Seng (HK50) dropped 4.07%, India’s NIFTY 50 (IND50) gained 1.01%, and Australia’s S&P/ASX 200 (AU200) was positive by 0.86%.
Japan’s economy is likely to return to growth in the final quarter of 2022 as the country reopens to tourists, offsetting weakening corporate activity and exports amid worsening global conditions. Analysts expect GDP growth of 2% in the last quarter.
In the commodities market, futures on orange juice (+16.45%), coffee (+2.24%), and sugar (+1.57%) showed the biggest gains last week. Futures on natural gas (-16.29%), gasoline (-10.44%), WTI oil (-8.09%), Brent oil (-7.79%), silver (-5.19%), copper (-4.55%), platinum (-3.62%) and gold (-2.68%) showed the biggest drop.
S&P 500 (F) (US500) 4,136.48 −43.28 (−1.04%)
Dow Jones (US30) 33,926.01 −127.93 (−0.38%)
DAX (DE40) 15,476.43 −32.76 (−0.21%)
FTSE 100 (UK100) 7,901.80 +81.64 (+1.04%)
USD Index 102.99 +1.24 (+1.22%)
Important events for today:
– Australia Retail Sales (m/m) at 02:30 (GMT+2);
– UK Construction PMI (m/m) at 11:30 (GMT+2);
– Eurozone Retail Sales (m/m) at 12:00 (GMT+2);
– Canada Ivey PMI (m/m) at 17:00 (GMT+2);
– ECB President Lagarde’s Speech at 20:00 (GMT+2).
This article reflects a personal opinion and should not be interpreted as an investment advice, and/or offer, and/or a persistent request for carrying out financial transactions, and/or a guarantee, and/or a forecast of future events.
After tumbling 2.5% last Friday due to an unexpectedly strong US jobs report, gold prices have kicked off the new week on a steadier note.
The precious metal is attempting to nurse deep wounds inflicted by January’s blockbuster NFP report which aggressively fuelled expectations around more US rate hikes from the Federal Reserve. Last month, the US economy created a whooping 517k jobs – the most since July and easily bearing market forecasts of 185k. Meanwhile, unemployment fell to its lowest level since 1969 at 3.4%. Given how the stunningly good report is likely to energize dollar bulls and empower Fed hawks, the path of least resistance for gold may point south in the short to medium term.
In our 2023, we highlighted how gold could be one of the biggest gainers this year thanks to expectations around the Fed switching to rate cuts later in 2023. The latest developments may have poured some cold water on these expectations. However, more key economic data may be needed to come to any meaningful conclusions. In the meantime, there is a possibility that the robust jobs data may set the tone for February
Taking a brief look at the technicals, gold may be down but certainly not out yet as bulls remain in some control on the monthly timeframe. There seems to be strong resistance around $1950 – $2000 while support can be found at $1700 – $1680. Gold could find itself rangebound until a fresh directional catalyst is brought into the picture.
Calm week before another storm?
Compared to last week’s mighty few days of market thrills, key central bank meetings, and high-risk events, the economic calendar for this week is relatively lighter.
Naturally, much attention will be directed toward speeches from Fed officials including Jerome Powell and US President Joe Bidens State of the Union Address. Even the weekly initial jobless claims on Thursday and US February consumer sentiment published on Friday may influence gold prices. Overall, the direction of gold should mostly be dictated by renewed Fed hike bets, a stronger dollar, and rising Treasury yields.
Looking beyond this week, it’s all about the US inflation report. Back in December 2022, the annual inflation rate in the United States slowed for a sixth straight month to 6.5%. This was a welcome development for financial markets and raised hopes over the Fed shifting into lower gear on rates. However, the robust strength of the US labour could feed fears over inflation remaining stubbornly high despite the latest recent slowdown. Ultimately, further signs of cooling inflationary pressures in January could provide gold bulls some sort of lifeline as the battle for dominance rages on.
Other themes to watch out for…
It will be wise to keep a close eye on the developments revolving around Sino-U.S. relations. Market sentiment remains gripped by fears over worsening US-China relations after the US shot down a suspected Chinese spy balloon over the weekend. Should tensions escalate, this may promote risk aversion boosting appetite for safe-haven assets. Appetite towards gold could receive a boost, however, this may be capped by an appreciating dollar.
Gold to remain below $1900?
Despite edging higher on Monday, gold prices remain under pressure on the daily charts. After cutting through the $1900 psychological level like a hot knife through butter, bears are clearly in a position of power. Sustained weakness below $1880 may open the doors towards $1825 and $1800, respectively. If prices can push back above $1900, gold could challenge $1950 and $2000, respectively.
Looking at the monthly charts, the recent rejection from the $1950 could guide prices back toward $1700 before bulls re-enter the scene. A breakdown below $1700 has the potential to trigger a selloff towards $1625.
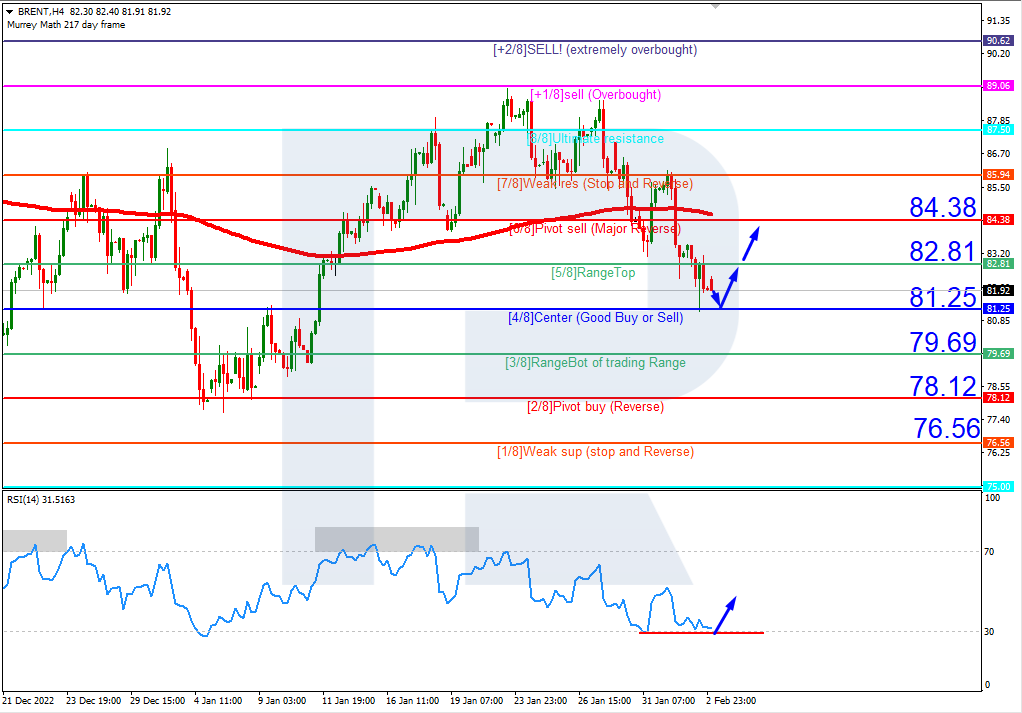
On H4, the quotes have broken through the 200-day Moving Average and are now below it, which indicates possible development of a downtrend. However, the RSI has reached the oversold area, which is a signal for a correction. So, a test of 4/8 (81.25) is expected, followed by a bounce off it and growth to the resistance level of 6/8 (84.38). The scenario can be cancelled by a downward breakaway of the support level of 4/8 (81.25). In this case, the quotes might drop to 2/8 (78.12).
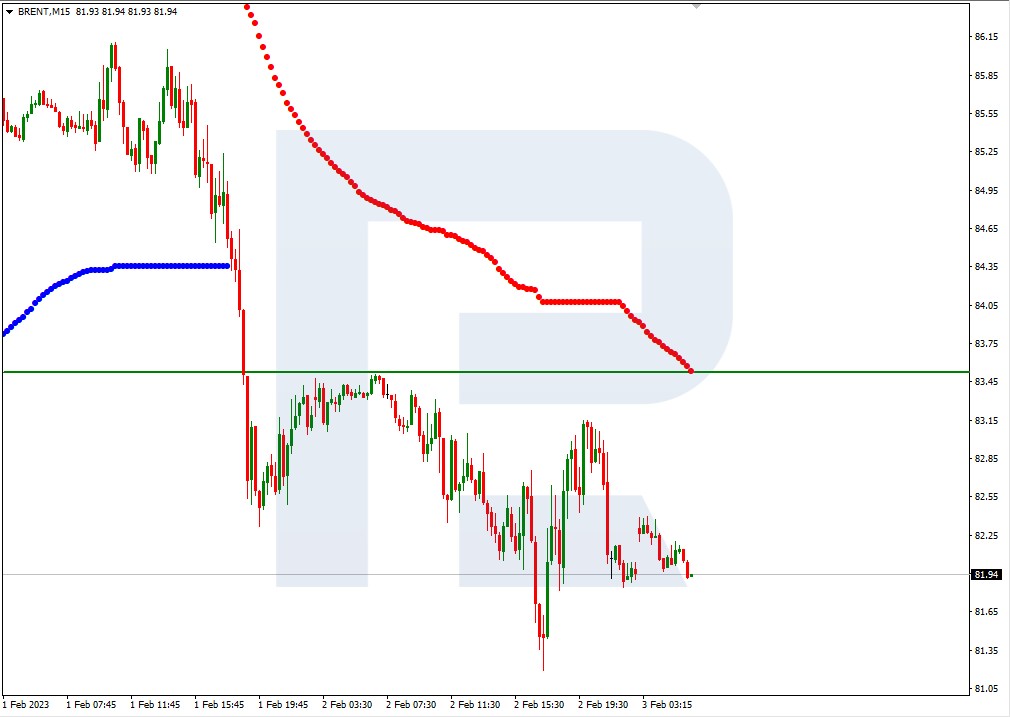
On M15, the upper line of VoltyChannel is too far away from the current price, so growth of the quotes will be indicated by a bounce off 4/8 (81.25) on H4.
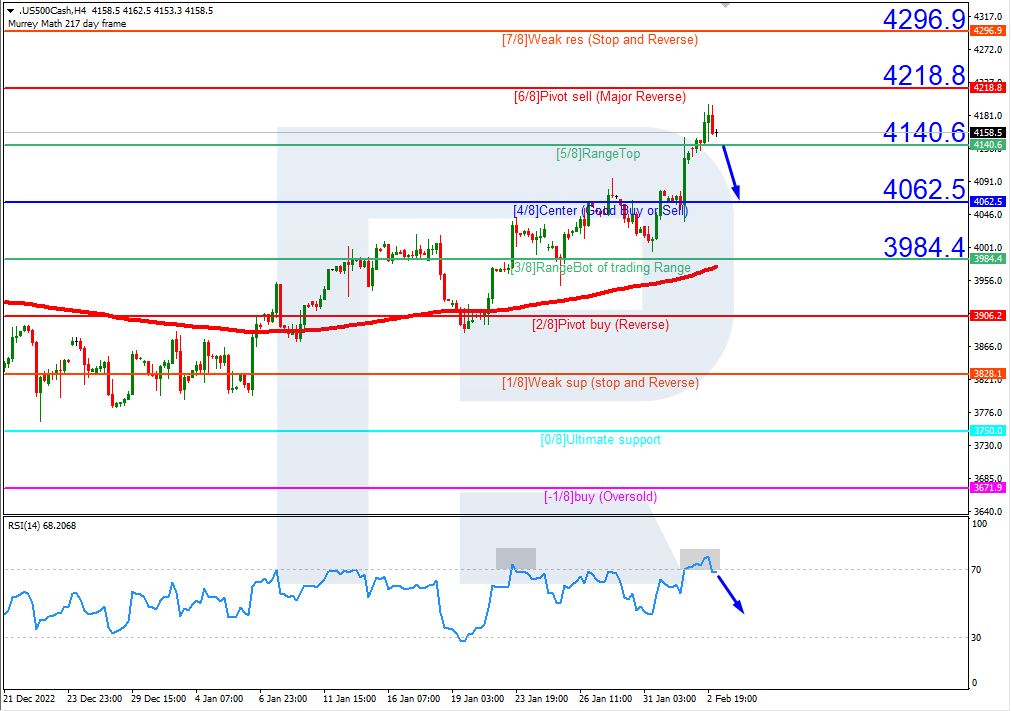
S&P 500
On H4, the quotes are above the 200-day Moving Average, which indicates prevalence of an uptrend. However, the RSI has reached the overbought area. In this case, a downward breakaway of 5/8 (4140.6) is expected, followed by falling to the support level of 4/8 (4062.5). The scenario can be cancelled by an upward breakaway of the resistance level of 6/8 (4218.8). In this case, the quotes should go on moving upwards and might reach 7/8 (4296.9).
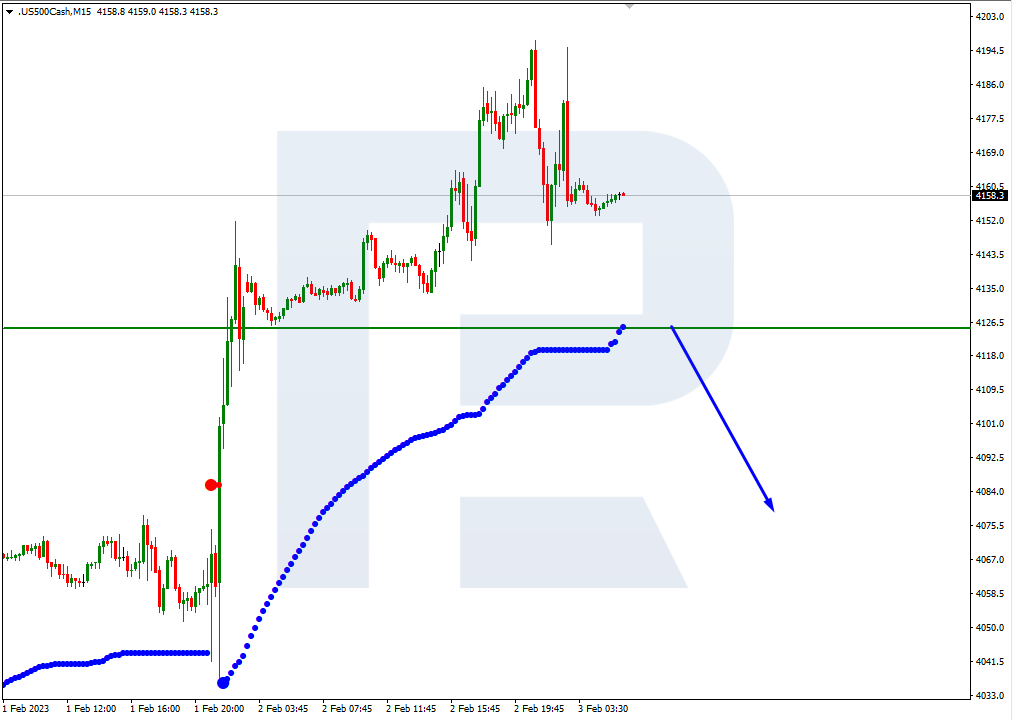
On M15, an additional signal of a decline can be given by a breakaway of the lower border of VoltyChannel.
Attention! Forecasts presented in this section only reflect the author’s private opinion and should not be considered as guidance for trading. RoboForex LP bears no responsibility for trading results based on trading recommendations described in these analytical reviews.
The Australian Dollar has been the best-performing G10 currency against the US dollar so far in 2023.
AUDUSD currently also boasts a year-to-date advance of more than 3.7% at the time of writing.
And the Aussie’s performance could be impacted by the Reserve Bank of Australia’s first policy meeting of the year, to be held amidst these other potential market-moving events over the coming week:
Monday, February 6
AUD: Australia January inflation, 4Q retail sales
EUR: Germany January inflation, December factory orders; Eurozone December retail sales
Tuesday, February 7
AUD: Reserve Bank of Australia rate decision
EUR: Germany December industrial production
USD: Fed Chair Jerome Powell interview
US President Joe Biden delivers State of the Union address
Wednesday, February 8
USD: New York Fed President John Williams speech
Earnings by Disney, Uber
Thursday, February 9
SEK: Sweden rate decision
GBP: BOE Governor Andrew Bailey speech
USD: US weekly initial jobless claims
Pepsico quarterly earnings
Friday, February 10
JPY: Japan January PPI
CNH: China January CPI and PPI
AUD: RBA releases updated quarterly economic forecasts and policy outlook
The RBA is set to trigger a hike of 25 basis points (bps) next week.
If so:
that would be the RBA’s fourth consecutive 25bps hike, and would be half the size of the 50bps hikes delivered on four separate occasions between June and September 2022.
the RBA would’ve raised its benchmark cash rate by a cumulative 325bps over the past 12 months (assuming next week’s hike is indeed 25bps), bringing its Cash Rate Target up to 3.35% from the record low of 0.10% just 10 months ago.
In other words, next week’s hike may be the RBA’s last in a policy tightening campaign that began back in May 2022.
Why is the RBA easing up on its rate hikes?
The RBA even contemplated pausing its rate hikes even at its December policy meeting, for fear of doing too much damage to the Australian economy.
Recall that central banks hike interest rates in order to “destroy demand” and subdue inflation.
And there have been enough signs that the RBA hikes are taking their toll:
Unemployment edged higher to 3.5% in December, while 14,600 jobs were lost that month
Inflation is expected to have peaked at 8.4% in December, and should moderate over the course of 2023 (look out for the RBA’s updated forecasts on Friday, Feb 10th).
How might the RBA’s decision impact AUDUSD?
If the RBA grows more concerned about incurring too much damage on its economy and opts for a:
smaller-than-25bps hike next week (perhaps just 15bps?)
leaves it cash rate unchanged, or …
strongly suggests that the end of its rate-hiking campaign is truly close at hand
… any of the above “dovish” outcomes may prompt the unwinding of some of AUD’s stellar year-to-date gains.
Look out for initial support at AUDUSD’s 21-day simple moving average (SMA) which currently sits just around the psychologically-important 0.7000 level.
Aussie bulls could then take such “hawkish” cues by the RBA to launch AUDUSD closer towards the early-June peak at 0.72830.
At the time of writing, Bloomberg’s FX model points to a 71% chance that AUDUSD trades within the 0.6925 to 0.7199 range over the next one-week period.
Why has AUD been soaring?
One word = China.
Australia is very much exposed to China, with the latter accounting for about 40% of Australia’s exports ranging from wine, lobsters, and of course, coal.
As China-Australia trade tensions thaw, the land Down Under stands to reap the benefits as the world’s second largest economy continues with its reopening.
Furthermore, the Australian economy is expected to fare much better in 2023 and be the exception to the forecasted global recession this year, as recently predicted by the IMF.
Hence, such optimism has seenAUD advance against all of its G10 peers since the start of the year, with AUDUSD yesterday punching its way to its highest levels since June, before easing slightly.
However, prices have been consolidating around the 50% Fibonacci retracement level for AUDUSD’s peak-to-trough performance over the past two years.
But before next week’s RBA decision, markets must first digest today’s US jobs report!
Note that the support/resistance levels above are derived from AUDUSD’s price action at the time this Week Ahead article is published, hours before the release of the US nonfarm payrolls due later today (Friday, February 3rd).
Signs that the US jobs market is weakening:
lower-than-forecasted 189,000 jobs created in January
higher-than-expected 3.6% unemployment rate
… would burnish hopes that the Fed has to pause its rate hikes sooner rather than later.
Such expectations might potentially drag the US dollar lower while offering a boost to AUDUSD.
In other words, today’s NFP report could have major sway on AUDUSD’s performance, even before the RBA would have its potential say on the Aussie.
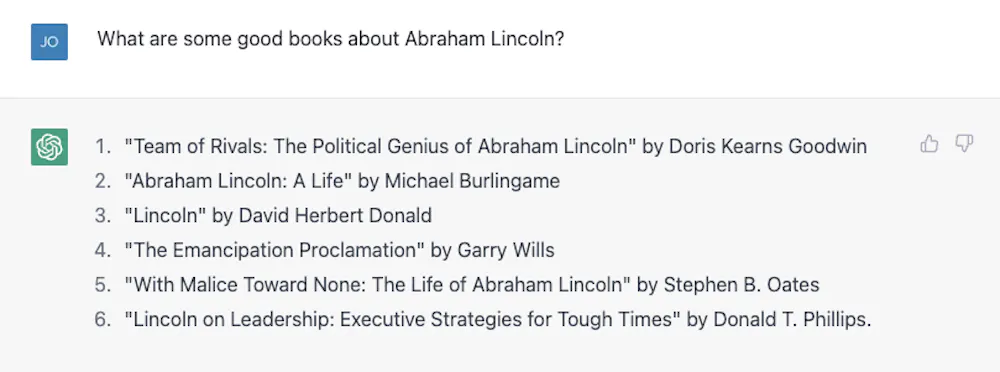
It doesn’t take much to get ChatGPT to make a factual mistake. My son is doing a report on U.S. presidents, so I figured I’d help him out by looking up a few biographies. I tried asking for a list of books about Abraham Lincoln and it did a pretty good job:
A reasonable list of books about Lincoln. Screen capture by Jonathan May., CC BY-ND
Number 4 isn’t right. Garry Wills famously wrote “Lincoln at Gettysburg,” and Lincoln himself wrote the Emancipation Proclamation, of course, but it’s not a bad start. Then I tried something harder, asking instead about the much more obscure William Henry Harrison, and it gamely provided a list, nearly all of which was wrong.
Books about Harrison, fewer than half of which are correct. Screen capture by Jonathan May., CC BY-ND
Numbers 4 and 5 are correct; the rest don’t exist or are not authored by those people. I repeated the exact same exercise and got slightly different results:
More books about Harrison, still mostly nonexistent. Screen capture by Jonathan May., CC BY-ND
This time numbers 2 and 3 are correct and the other three are not actual books or not written by those authors. Number 4, “William Henry Harrison: His Life and Times” is a real book, but it’s by James A. Green, not by Robert Remini, a well-known historian of the Jacksonian age.
I called out the error and ChatGPT eagerly corrected itself and then confidently told me the book was in fact written by Gail Collins (who wrote a different Harrison biography), and then went on to say more about the book and about her. I finally revealed the truth and the machine was happy to run with my correction. Then I lied absurdly, saying during their first hundred days presidents have to write a biography of some former president, and ChatGPT called me out on it. I then lied subtly, incorrectly attributing authorship of the Harrison biography to historian and writer Paul C. Nagel, and it bought my lie.
When I asked ChatGPT if it was sure I was not lying, it claimed that it’s just an “AI language model” and doesn’t have the ability to verify accuracy. However it modified that claim by saying “I can only provide information based on the training data I have been provided, and it appears that the book ‘William Henry Harrison: His Life and Times’ was written by Paul C. Nagel and published in 1977.”
This is not true.
Words, not facts
It may seem from this interaction that ChatGPT was given a library of facts, including incorrect claims about authors and books. After all, ChatGPT’s maker, OpenAI, claims it trained the chatbot on “vast amounts of data from the internet written by humans.”
However, it was almost certainly not given the names of a bunch of made-up books about one of the most mediocre presidents. In a way, though, this false information is indeed based on its training data.
As a computer scientist, I often field complaints that reveal a common misconception about large language models like ChatGPT and its older brethren GPT3 and GPT2: that they are some kind of “super Googles,” or digital versions of a reference librarian, looking up answers to questions from some infinitely large library of facts, or smooshing together pastiches of stories and characters. They don’t do any of that – at least, they were not explicitly designed to.
Sounds good
A language model like ChatGPT, which is more formally known as a “generative pretrained transformer” (that’s what the G, P and T stand for), takes in the current conversation, forms a probability for all of the words in its vocabulary given that conversation, and then chooses one of them as the likely next word. Then it does that again, and again, and again, until it stops.
So it doesn’t have facts, per se. It just knows what word should come next. Put another way, ChatGPT doesn’t try to write sentences that are true. But it does try to write sentences that are plausible.
When talking privately to colleagues about ChatGPT, they often point out how many factually untrue statements it produces and dismiss it. To me, the idea that ChatGPT is a flawed data retrieval system is beside the point. People have been using Google for the past two and a half decades, after all. There’s a pretty good fact-finding service out there already.
In fact, the only way I was able to verify whether all those presidential book titles were accurate was by Googling and then verifying the results. My life would not be that much better if I got those facts in conversation, instead of the way I have been getting them for almost half of my life, by retrieving documents and then doing a critical analysis to see if I can trust the contents.
Improv partner
On the other hand, if I can talk to a bot that will give me plausible responses to things I say, it would be useful in situations where factual accuracy isn’t all that important. A few years ago a student and I tried to create an “improv bot,” one that would respond to whatever you said with a “yes, and” to keep the conversation going. We showed, in a paper, that our bot was better at “yes, and-ing” than other bots at the time, but in AI, two years is ancient history.
I tried out a dialogue with ChatGPT – a science fiction space explorer scenario – that is not unlike what you’d find in a typical improv class. ChatGPT is way better at “yes, and-ing” than what we did, but it didn’t really heighten the drama at all. I felt as if I was doing all the heavy lifting.
After a few tweaks I got it to be a little more involved, and at the end of the day I felt that it was a pretty good exercise for me, who hasn’t done much improv since I graduated from college over 20 years ago.
A space exploration improv scene the author generated with ChatGPT. Screen capture by Jonathan May., CC BY-ND
Sure, I wouldn’t want ChatGPT to appear on “Whose Line Is It Anyway?” and this is not a great “Star Trek” plot (though it’s still less problematic than “Code of Honor”), but how many times have you sat down to write something from scratch and found yourself terrified by the empty page in front of you? Starting with a bad first draft can break through writer’s block and get the creative juices flowing, and ChatGPT and large language models like it seem like the right tools to aid in these exercises.
And for a machine that is designed to produce strings of words that sound as good as possible in response to the words you give it – and not to provide you with information – that seems like the right use for the tool.
The US stock markets continued their rally yesterday. By Thursday’s close, the Dow Jones Index (US30) decreased by 0.11%, while the S&P 500 (US500) gained 1.48%. The NASDAQ Technology Index (US100) jumped by 3.25%.
Investors are investing in tech stocks after the Meta rally. The artificial intelligence technology boom in recent months has forced investors to pour money into technology. The market has also been helped by renewed confidence that the Federal Reserve will stop raising rates sooner than originally planned.
Tesla (TSLA) added another 3% to its recent rally after it was announced that the company would increase production at its Shanghai plant to nearly 20,000 vehicles per week. Apple’s (AAPL) results for the quarter fell short of estimates due to a drop in iPhone revenue. iPhone’s revenue fell about 8% to $65.78 billion amid a difficult macroeconomic environment and significant supply constraints. Apple stock fell by 3% after the report was released. Alphabet (GOOGL) reported lower-than-expected fourth-quarter earnings and revenue as lower spending on online advertising affected results. The company also said its first-quarter results would reflect lower spending related to job cuts. Shares of Alphabet Inc. fell more than 1% on the report. Amazon (AMZN) was also unhappy with the results.
Operating profits continued to fall in the current quarter. Faced with high inflation and a volatile economy, the company has set its sights on cutting costs across various businesses. Shares fell 5% after the market closed. Ford Motor Co (F) said Thursday that fourth-quarter profit fell from a year earlier. The automaker blamed supply chain problems and production “instability, ” leading to higher costs and lower volumes. Ford shares fell more than 6% on the report after the close of the main session.
Stock markets in Europe were mostly up yesterday. Germany’s DAX (DE30) gained 2.16%, France’s CAC 40 (FR40) added 1.26%, Spain’s IBEX 35 index (ES35) jumped by 1.45%, and Britain’s FTSE 100 (UK100) closed Thursday up by 0.76%.
The ECB, as expected, raised its interest rate by 0.5% yesterday. The US Fed is ending its rate hike cycle and will soon talk about ending quantitative easing (QT), with the ECB about halfway through and planning to start QT in March. This situation is good for the euro as the spread between the euro, and the dollar will continue to narrow.
The Bank of England announced another “sharp” interest rate hike on Thursday, saying it was too early to declare victory over inflation. The bank raised its key rate from 3.5% to 4%. Nevertheless, the bank tempered expectations of further rate hikes, dismissing suggestions that it would respond “strongly” to price pressures and implying that future changes would be smaller.
Oil prices fell Thursday as US factory orders fell and the dollar strengthened, making oil more expensive for non-US buyers. This indicates a further slowdown in the economy, especially in manufacturing, which is negatively affecting oil. Investors have become less confident about the strength of the oil outlook. But analysts are still confident in a bullish scenario for the “black gold” due to the rebounding economy of China (the largest oil importer). It is also worth remembering that the ban on Russian oil will come into effect on February 5, which may strike a blow to global supplies.
The unusually warm start to the winter of 2022/23 resulted in a significant reduction in heating demand in the United States and Europe compared to the norm, leaving more gas in storage than originally anticipated. This has led to a drop in natural gas prices over the past two months. But the situation may change dramatically with the onset of cold weather, which weather forecasters predict for the second half of February.
Asian markets traded flat yesterday. Japan’s Nikkei 225 (JP225) gained 0.20%, China’s FTSE China A50 (CHA50) decreased by 0.34%, Hong Kong’s Hang Sengv(HK50) lost 0.52%, India’s NIFTY 50 (IND50) fell by 0.03%, and Australia’s S&P/ASX 200 (AU200) was up by 0.13% on the day.
The mixed economic data released reinforced concerns about China’s rapid recovery after the repeal of the zero COVID-19 policy. While the country’s services sector recovered sharply in January after a four-month slump, a private survey showed that small-scale manufacturing firms still struggle with rising COVID-19 cases and lingering supply chain problems.
Severe flooding in New Zealand’s largest city, Auckland, has increased inflationary pressures and is creating a new cost-of-living headache for Prime Minister Chris Hipkins, who is trying to win back support for his party before the election.
S&P 500 (F) (US500) 4,179.76 +60.55 (+1.47%)
Dow Jones (US30) 34,053.94 −39.02 (−0.11%)
DAX (DE40) 15,509.19 +328.45 (+2.16%)
FTSE 100 (UK100) 7,820.16 +59.05 (+0.76%)
USD Index 101.74 +0.53 (+0.53%)
Important events for today:
– Eurozone Services PMI (m/m) at 11:00 (GMT+2);
– UK Services PMI (m/m) at 11:30 (GMT+2);
– Eurozone Retail Sales (m/m) at 12:00 (GMT+2);
– Eurozone Producer Price Index (m/m) at 12:00 (GMT+2);
This article reflects a personal opinion and should not be interpreted as an investment advice, and/or offer, and/or a persistent request for carrying out financial transactions, and/or a guarantee, and/or a forecast of future events.
These successes could be taken to indicate that computation has no limits. To see if that’s the case, it’s important to understand what makes a computer powerful.
There are two aspects to a computer’s power: the number of operations its hardware can execute per second and the efficiency of the algorithms it runs. The hardware speed is limited by the laws of physics. Algorithms – basically sets of instructions – are written by humans and translated into a sequence of operations that computer hardware can execute. Even if a computer’s speed could reach the physical limit, computational hurdles remain due to the limits of algorithms.
These hurdles include problems that are impossible for computers to solve and problems that are theoretically solvable but in practice are beyond the capabilities of even the most powerful versions of today’s computers imaginable. Mathematicians and computer scientists attempt to determine whether a problem is solvable by trying them out on an imaginary machine.
An imaginary computing machine
The modern notion of an algorithm, known as a Turing machine, was formulated in 1936 by British mathematician Alan Turing. It’s an imaginary device that imitates how arithmetic calculations are carried out with a pencil on paper. The Turing machine is the template all computers today are based on.
To accommodate computations that would need more paper if done manually, the supply of imaginary paper in a Turing machine is assumed to be unlimited. This is equivalent to an imaginary limitless ribbon, or “tape,” of squares, each of which is either blank or contains one symbol.
The machine is controlled by a finite set of rules and starts on an initial sequence of symbols on the tape. The operations the machine can carry out are moving to a neighboring square, erasing a symbol and writing a symbol on a blank square. The machine computes by carrying out a sequence of these operations. When the machine finishes, or “halts,” the symbols remaining on the tape are the output or result.
What is a Turing machine?
Computing is often about decisions with yes or no answers. By analogy, a medical test (type of problem) checks if a patient’s specimen (an instance of the problem) has a certain disease indicator (yes or no answer). The instance, represented in a Turing machine in digital form, is the initial sequence of symbols.
A problem is considered “solvable” if a Turing machine can be designed that halts for every instance whether positive or negative and correctly determines which answer the instance yields.
Not every problem can be solved
Many problems are solvable using a Turing machine and therefore can be solved on a computer, while many others are not. For example, the domino problem, a variation of the tiling problem formulated by Chinese American mathematician Hao Wang in 1961, is not solvable.
The task is to use a set of dominoes to cover an entire grid and, following the rules of most dominoes games, matching the number of pips on the ends of abutting dominoes. It turns out that there is no algorithm that can start with a set of dominoes and determine whether or not the set will completely cover the grid.
Keeping it reasonable
A number of solvable problems can be solved by algorithms that halt in a reasonable amount of time. These “polynomial-time algorithms” are efficient algorithms, meaning it’s practical to use computers to solve instances of them.
Thousands of other solvable problems are not known to have polynomial-time algorithms, despite ongoing intensive efforts to find such algorithms. These include the Traveling Salesman Problem.
The Traveling Salesman Problem asks whether a set of points with some points directly connected, called a graph, has a path that starts from any point and goes through every other point exactly once, and comes back to the original point. Imagine that a salesman wants to find a route that passes all households in a neighborhood exactly once and returns to the starting point.
The Traveling Salesman Problem quickly gets out of hand when you get beyond a few destinations.
These problems, called NP-complete, were independently formulated and shown to exist in the early 1970s by two computer scientists, American Canadian Stephen Cook and Ukrainian American Leonid Levin. Cook, whose work came first, was awarded the 1982 Turing Award, the highest in computer science, for this work.
The cost of knowing exactly
The best-known algorithms for NP-complete problems are essentially searching for a solution from all possible answers. The Traveling Salesman Problem on a graph of a few hundred points would take years to run on a supercomputer. Such algorithms are inefficient, meaning there are no mathematical shortcuts.
Practical algorithms that address these problems in the real world can only offer approximations, though the approximations are improving. Whether there are efficient polynomial-time algorithms that can solve NP-complete problems is among the seven millennium open problems posted by the Clay Mathematics Institute at the turn of the 21st century, each carrying a prize of US$1 million.
Beyond Turing
Could there be a new form of computation beyond Turing’s framework? In 1982, American physicist Richard Feynman, a Nobel laureate, put forward the idea of computation based on quantum mechanics.
What is a quantum computer?
In 1995, Peter Shor, an American applied mathematician, presented a quantum algorithm to factor integers in polynomial time. Mathematicians believe that this is unsolvable by polynomial-time algorithms in Turing’s framework. Factoring an integer means finding a smaller integer greater than 1 that can divide the integer. For example, the integer 688,826,081 is divisible by a smaller integer 25,253, because 688,826,081 = 25,253 x 27,277.
A major algorithm called the RSA algorithm, widely used in securing network communications, is based on the computational difficulty of factoring large integers. Shor’s result suggests that quantum computing, should it become a reality, will change the landscape of cybersecurity.
Can a full-fledged quantum computer be built to factor integers and solve other problems? Some scientists believe it can be. Several groups of scientists around the world are working to build one, and some have already built small-scale quantum computers.
Nevertheless, like all novel technologies invented before, issues with quantum computation are almost certain to arise that would impose new limits.