By InvestMacro
Here are the latest charts and statistics for the Commitment of Traders (COT) reports data published by the Commodities Futures Trading Commission (CFTC).
The latest COT data is updated through Tuesday March 21st and shows a quick view of how large traders (for-profit speculators and commercial entities) were positioned in the futures markets.
* This COT data is fully up-to-date after weeks of delays due to a cybersecurity event that happened in early February to ION Cleared Derivatives (a subsidiary of ION Markets). The hacking incident had disrupted the ability for the CFTC to report large trader positions.
Weekly Speculator Changes led by Corn, Coffee & Wheat
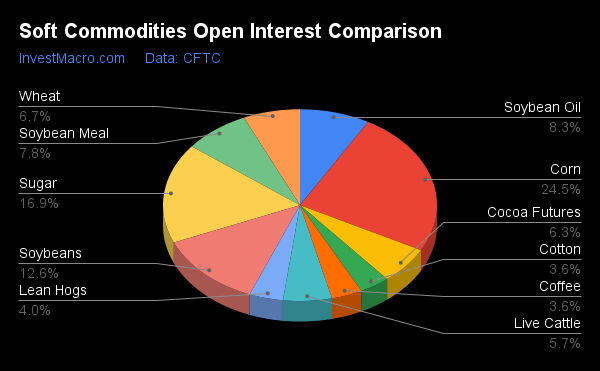
The COT soft commodities markets speculator bets were lower this week as five out of the eleven softs markets we cover had higher positioning while the other six markets had lower speculator contracts.
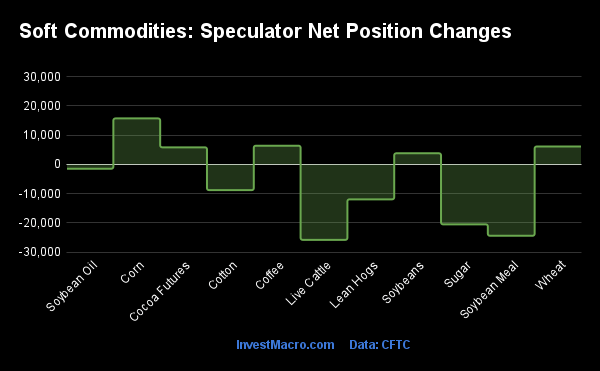
Leading the gains for the softs markets was Corn (15,699 contracts) with Coffee (6,386 contracts), Wheat (6,111 contracts), Cocoa (5,827 contracts) and Soybeans (3,793 contracts) also showing positive weeks.
The markets with the declines in speculator bets this week were Live Cattle (-25,773 contracts) with Soybean Meal (-24,378 contracts), Sugar (-20,487 contracts), Lean Hogs (-11,936 contracts), Cotton (-8,794 contracts) and Soybean Oil (-1,481 contracts) also seeing lower bets on the week.
Highlighting the COT soft commodities data this week is the recent sharp decreases in the Corn speculator’s positioning. The large speculator bets for Corn have been in somewhat of a free-fall over the past five weeks (despite this week’s gain) as Corn bets have dropped for four out of the past five weeks and by a total of -245,236 contracts over that time-frame. The speculator positioning have sharply declined from a total of +304,712 contracts on February 14th to a total of just +59,476 contracts through Tuesday.
The last two weeks marked the first time that net positions have been under +100,000 contracts since September of 2020, a span of about 130 weeks. Corn’s speculator strength score level has dipped to 37.6 percent while its 6-week strength score trend has illuminated its recent weakness with a -28.5 percent trend score.
Corn’s futures price has risen for the past two weeks but is off the lofty heights of 2022 when prices reached highs in the 750-800 range. This week Corn closed out near the 644.00 level after bouncing off of support at the 600 level over the previous few weeks.
| Mar-21-2023 | OI | OI-Index | Spec-Net | Spec-Index | Com-Net | COM-Index | Smalls-Net | Smalls-Index |
|---|
| WTI Crude | 1,791,902 | 35 | 154,341 | 0 | -178,904 | 100 | 24,563 | 40 |
| Gold | 469,874 | 22 | 158,605 | 47 | -183,568 | 53 | 24,963 | 43 |
| Silver | 119,082 | 0 | 3,462 | 23 | -12,681 | 79 | 9,219 | 17 |
| Copper | 201,636 | 44 | -12,351 | 17 | 7,536 | 80 | 4,815 | 49 |
| Palladium | 11,647 | 80 | -7,018 | 1 | 7,369 | 100 | -351 | 21 |
| Platinum | 61,416 | 45 | 9,526 | 38 | -14,141 | 64 | 4,615 | 30 |
| Natural Gas | 1,283,037 | 65 | -144,681 | 14 | 113,440 | 85 | 31,241 | 54 |
| Brent | 149,302 | 11 | -46,349 | 20 | 43,543 | 78 | 2,806 | 47 |
| Heating Oil | 279,105 | 28 | 9,829 | 45 | -22,477 | 60 | 12,648 | 42 |
| Soybeans | 696,280 | 26 | 171,787 | 57 | -141,848 | 48 | -29,939 | 22 |
| Corn | 1,349,372 | 21 | 59,476 | 38 | 3,793 | 72 | -63,269 | 15 |
| Coffee | 201,018 | 13 | 18,696 | 47 | -17,673 | 58 | -1,023 | 0 |
| Sugar | 929,418 | 55 | 210,656 | 66 | -258,522 | 29 | 47,866 | 67 |
| Wheat | 370,297 | 49 | -59,203 | 12 | 59,325 | 89 | -122 | 90 |
Strength Scores led by Soybean Meal & Cocoa
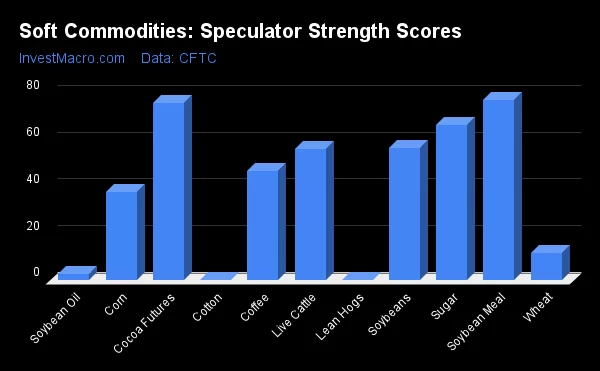
COT Strength Scores (a normalized measure of Speculator positions over a 3-Year range, from 0 to 100 where above 80 is Extreme-Bullish and below 20 is Extreme-Bearish) showed that Soybean Meal (77 percent) and Cocoa (76 percent) lead the softs markets this week. Sugar (66 percent), Soybeans (57 percent) and Live Cattle (56 percent) come in as the next highest in the weekly strength scores.
On the downside, Lean Hogs (0 percent), Cotton (0 percent), Soybean Oil (3 percent) and Wheat (12 percent) come in at the lowest strength levels currently and are all in Extreme-Bearish territory (below 20 percent).
Strength Statistics:
Corn (37.6 percent) vs Corn previous week (35.6 percent)
Sugar (66.3 percent) vs Sugar previous week (73.4 percent)
Coffee (46.6 percent) vs Coffee previous week (40.0 percent)
Soybeans (56.7 percent) vs Soybeans previous week (55.2 percent)
Soybean Oil (2.5 percent) vs Soybean Oil previous week (3.5 percent)
Soybean Meal (77.2 percent) vs Soybean Meal previous week (90.0 percent)
Live Cattle (56.2 percent) vs Live Cattle previous week (85.1 percent)
Lean Hogs (0.0 percent) vs Lean Hogs previous week (11.6 percent)
Cotton (0.0 percent) vs Cotton previous week (6.6 percent)
Cocoa (75.8 percent) vs Cocoa previous week (67.7 percent)
Wheat (11.7 percent) vs Wheat previous week (6.6 percent)
Cocoa & Coffee top the 6-Week Strength Trends
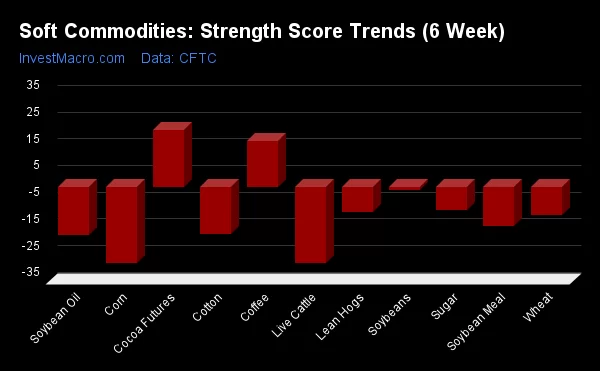
COT Strength Score Trends (or move index, calculates the 6-week changes in strength scores) showed that Cocoa (21 percent) and Coffee (17 percent) lead the past six weeks trends for soft commodities and represent the only two positive movers in the latest trends data.
Live Cattle (-28 percent) leads the downside trend scores currently with Corn (-28 percent), Cotton (-18 percent) and Soybean Oil (-18 percent) following next with lowest trend scores.
Strength Trend Statistics:
Corn (-28.5 percent) vs Corn previous week (-32.3 percent)
Sugar (-8.7 percent) vs Sugar previous week (-5.5 percent)
Coffee (17.0 percent) vs Coffee previous week (14.6 percent)
Soybeans (-1.2 percent) vs Soybeans previous week (-4.1 percent)
Soybean Oil (-17.9 percent) vs Soybean Oil previous week (-21.0 percent)
Soybean Meal (-14.5 percent) vs Soybean Meal previous week (-0.1 percent)
Live Cattle (-28.4 percent) vs Live Cattle previous week (20.5 percent)
Lean Hogs (-9.6 percent) vs Lean Hogs previous week (-2.1 percent)
Cotton (-17.6 percent) vs Cotton previous week (-14.8 percent)
Cocoa (21.3 percent) vs Cocoa previous week (9.5 percent)
Wheat (-10.7 percent) vs Wheat previous week (-21.0 percent)
Individual Soft Commodities Markets:
CORN Futures:
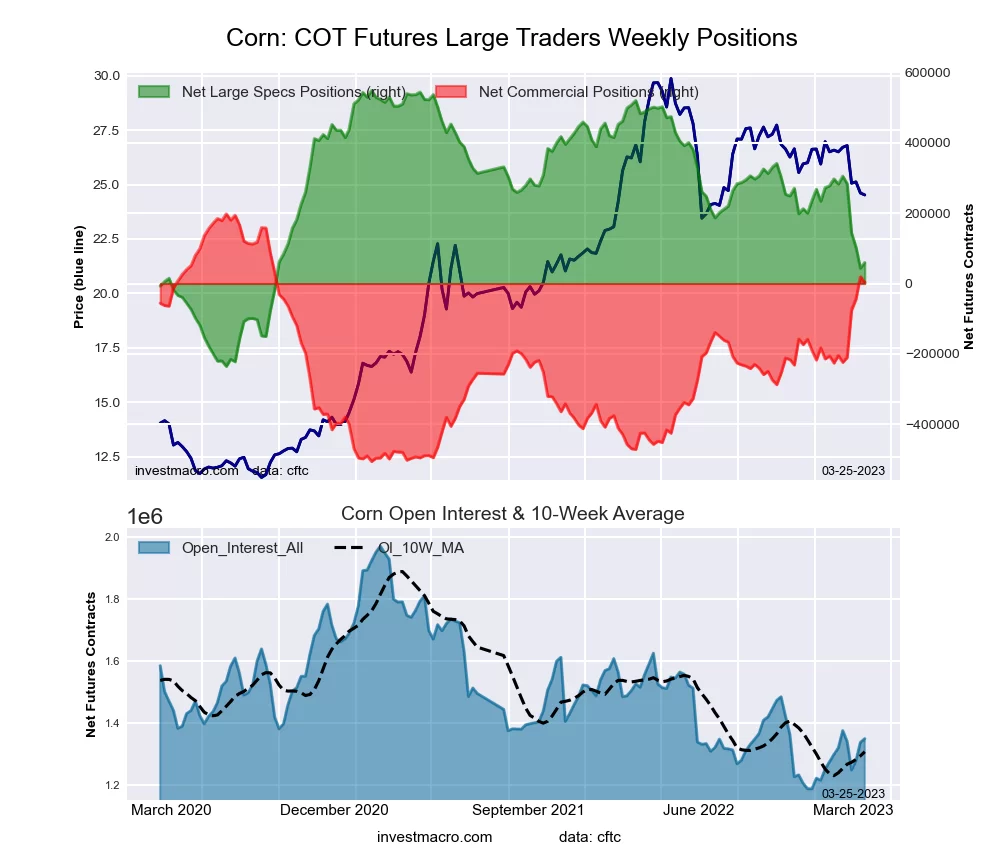 The CORN large speculator standing this week was a net position of 59,476 contracts in the data reported through Tuesday. This was a weekly gain of 15,699 contracts from the previous week which had a total of 43,777 net contracts.
This week’s current strength score (the trader positioning range over the past three years, measured from 0 to 100) shows the speculators are currently Bearish with a score of 37.6 percent. The commercials are Bullish with a score of 72.4 percent and the small traders (not shown in chart) are Bearish-Extreme with a score of 14.7 percent.
| CORN Futures Statistics | SPECULATORS | COMMERCIALS | SMALL TRADERS |
| – Percent of Open Interest Longs: | 24.2 | 49.5 | 8.4 |
| – Percent of Open Interest Shorts: | 19.8 | 49.2 | 13.1 |
| – Net Position: | 59,476 | 3,793 | -63,269 |
| – Gross Longs: | 327,137 | 667,983 | 113,622 |
| – Gross Shorts: | 267,661 | 664,190 | 176,891 |
| – Long to Short Ratio: | 1.2 to 1 | 1.0 to 1 | 0.6 to 1 |
| NET POSITION TREND: | | | |
| – Strength Index Score (3 Year Range Pct): | 37.6 | 72.4 | 14.7 |
| – Strength Index Reading (3 Year Range): | Bearish | Bullish | Bearish-Extreme |
| NET POSITION MOVEMENT INDEX: | | | |
| – 6-Week Change in Strength Index: | -28.5 | 29.6 | 12.0 |
SUGAR Futures:
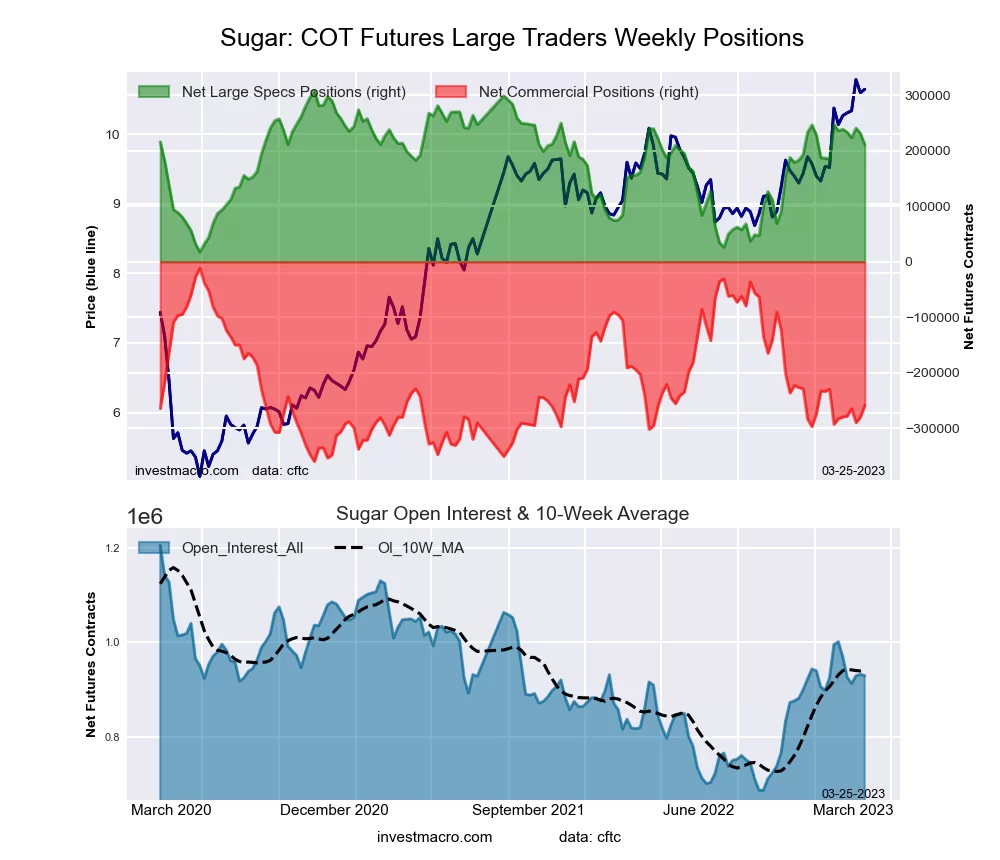 The SUGAR large speculator standing this week was a net position of 210,656 contracts in the data reported through Tuesday. This was a weekly reduction of -20,487 contracts from the previous week which had a total of 231,143 net contracts.
This week’s current strength score (the trader positioning range over the past three years, measured from 0 to 100) shows the speculators are currently Bullish with a score of 66.3 percent. The commercials are Bearish with a score of 29.0 percent and the small traders (not shown in chart) are Bullish with a score of 67.0 percent.
| SUGAR Futures Statistics | SPECULATORS | COMMERCIALS | SMALL TRADERS |
| – Percent of Open Interest Longs: | 32.6 | 38.1 | 10.9 |
| – Percent of Open Interest Shorts: | 9.9 | 65.9 | 5.7 |
| – Net Position: | 210,656 | -258,522 | 47,866 |
| – Gross Longs: | 302,634 | 353,905 | 101,185 |
| – Gross Shorts: | 91,978 | 612,427 | 53,319 |
| – Long to Short Ratio: | 3.3 to 1 | 0.6 to 1 | 1.9 to 1 |
| NET POSITION TREND: | | | |
| – Strength Index Score (3 Year Range Pct): | 66.3 | 29.0 | 67.0 |
| – Strength Index Reading (3 Year Range): | Bullish | Bearish | Bullish |
| NET POSITION MOVEMENT INDEX: | | | |
| – 6-Week Change in Strength Index: | -8.7 | 6.8 | 1.9 |
COFFEE Futures:
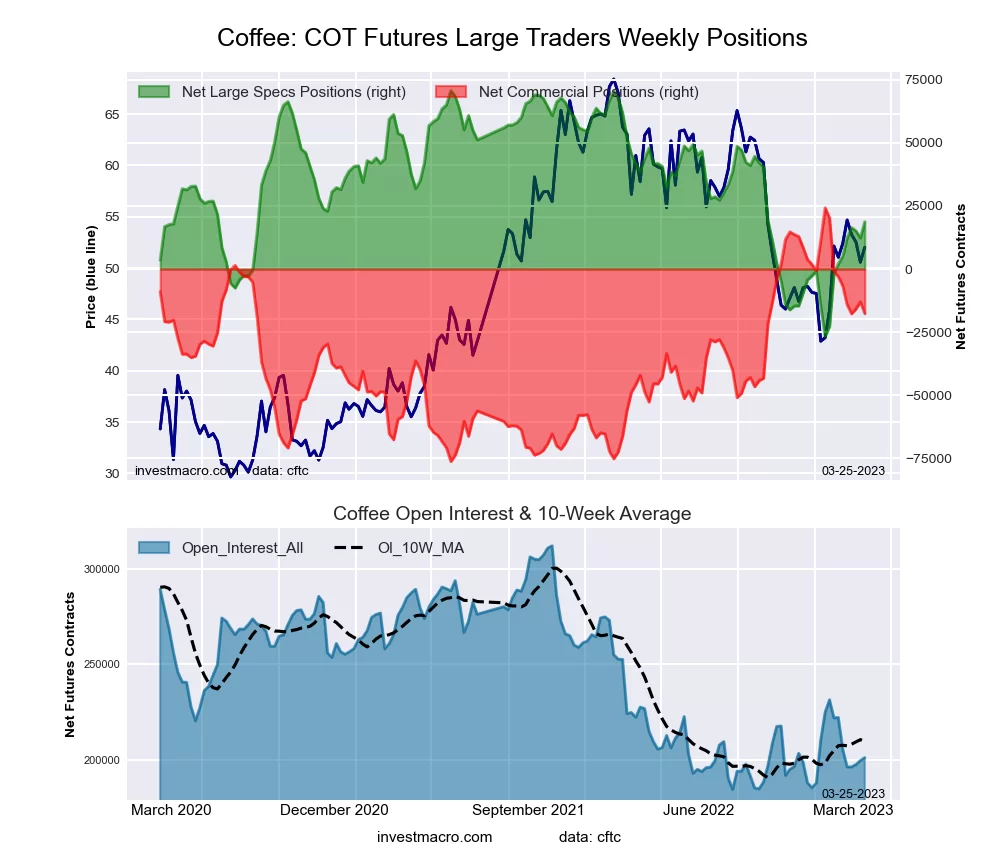 The COFFEE large speculator standing this week was a net position of 18,696 contracts in the data reported through Tuesday. This was a weekly gain of 6,386 contracts from the previous week which had a total of 12,310 net contracts.
This week’s current strength score (the trader positioning range over the past three years, measured from 0 to 100) shows the speculators are currently Bearish with a score of 46.6 percent. The commercials are Bullish with a score of 58.3 percent and the small traders (not shown in chart) are Bearish-Extreme with a score of 0.0 percent.
| COFFEE Futures Statistics | SPECULATORS | COMMERCIALS | SMALL TRADERS |
| – Percent of Open Interest Longs: | 21.4 | 49.6 | 3.7 |
| – Percent of Open Interest Shorts: | 12.1 | 58.3 | 4.2 |
| – Net Position: | 18,696 | -17,673 | -1,023 |
| – Gross Longs: | 43,072 | 99,606 | 7,452 |
| – Gross Shorts: | 24,376 | 117,279 | 8,475 |
| – Long to Short Ratio: | 1.8 to 1 | 0.8 to 1 | 0.9 to 1 |
| NET POSITION TREND: | | | |
| – Strength Index Score (3 Year Range Pct): | 46.6 | 58.3 | 0.0 |
| – Strength Index Reading (3 Year Range): | Bearish | Bullish | Bearish-Extreme |
| NET POSITION MOVEMENT INDEX: | | | |
| – 6-Week Change in Strength Index: | 17.0 | -14.6 | -24.0 |
SOYBEANS Futures:
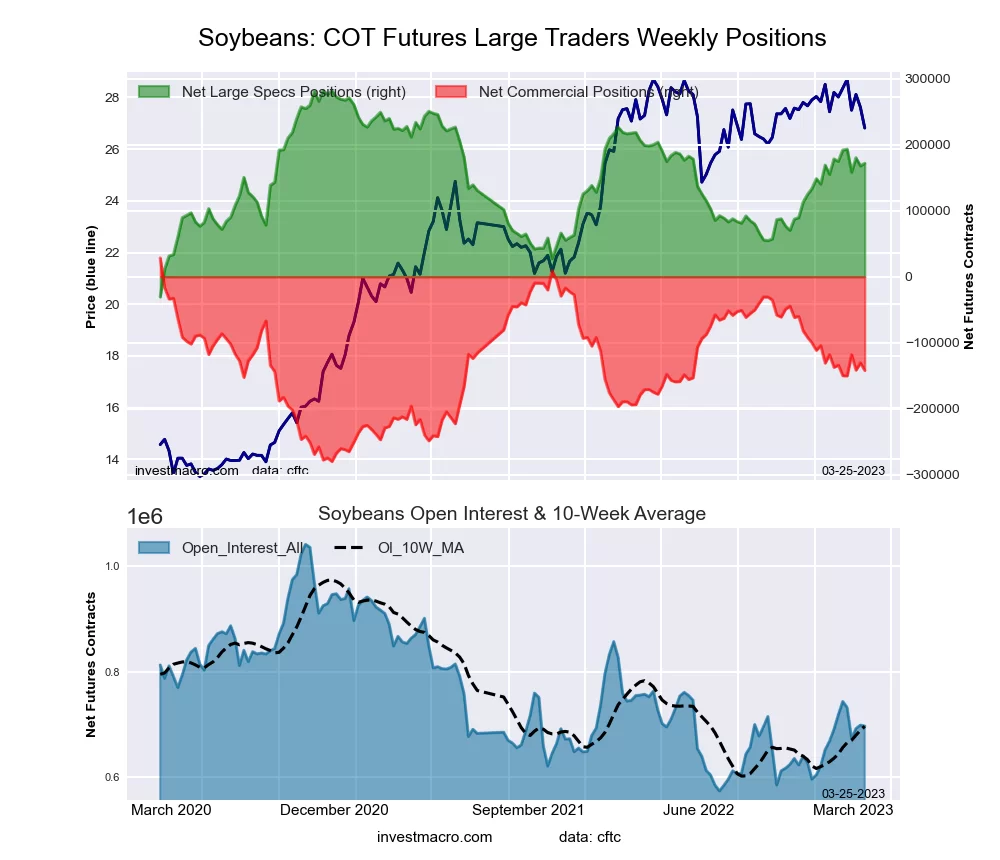 The SOYBEANS large speculator standing this week was a net position of 171,787 contracts in the data reported through Tuesday. This was a weekly lift of 3,793 contracts from the previous week which had a total of 167,994 net contracts.
This week’s current strength score (the trader positioning range over the past three years, measured from 0 to 100) shows the speculators are currently Bullish with a score of 56.7 percent. The commercials are Bearish with a score of 47.7 percent and the small traders (not shown in chart) are Bearish with a score of 21.9 percent.
| SOYBEANS Futures Statistics | SPECULATORS | COMMERCIALS | SMALL TRADERS |
| – Percent of Open Interest Longs: | 30.3 | 44.6 | 6.9 |
| – Percent of Open Interest Shorts: | 5.6 | 64.9 | 11.2 |
| – Net Position: | 171,787 | -141,848 | -29,939 |
| – Gross Longs: | 210,762 | 310,325 | 47,727 |
| – Gross Shorts: | 38,975 | 452,173 | 77,666 |
| – Long to Short Ratio: | 5.4 to 1 | 0.7 to 1 | 0.6 to 1 |
| NET POSITION TREND: | | | |
| – Strength Index Score (3 Year Range Pct): | 56.7 | 47.7 | 21.9 |
| – Strength Index Reading (3 Year Range): | Bullish | Bearish | Bearish |
| NET POSITION MOVEMENT INDEX: | | | |
| – 6-Week Change in Strength Index: | -1.2 | -2.8 | 18.4 |
SOYBEAN OIL Futures:
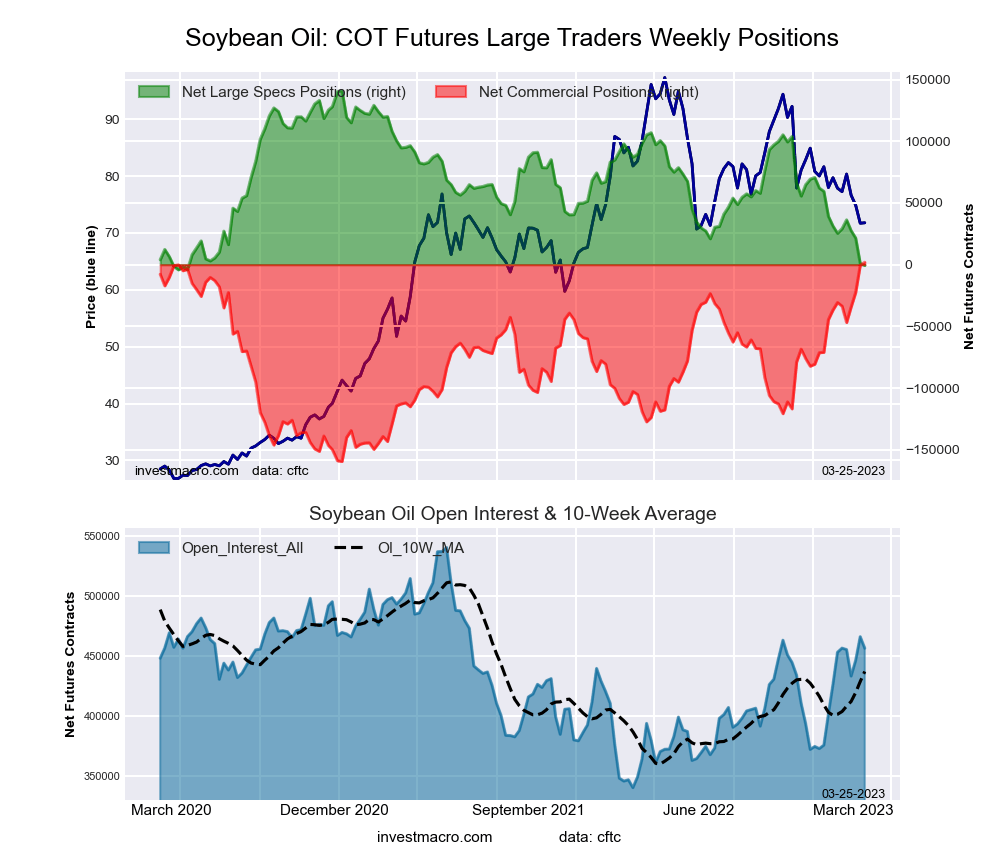 The SOYBEAN OIL large speculator standing this week was a net position of -567 contracts in the data reported through Tuesday. This was a weekly fall of -1,481 contracts from the previous week which had a total of 914 net contracts.
This week’s current strength score (the trader positioning range over the past three years, measured from 0 to 100) shows the speculators are currently Bearish-Extreme with a score of 2.5 percent. The commercials are Bullish-Extreme with a score of 100.0 percent and the small traders (not shown in chart) are Bearish-Extreme with a score of 0.0 percent.
| SOYBEAN OIL Futures Statistics | SPECULATORS | COMMERCIALS | SMALL TRADERS |
| – Percent of Open Interest Longs: | 16.4 | 56.9 | 6.4 |
| – Percent of Open Interest Shorts: | 16.5 | 56.5 | 6.7 |
| – Net Position: | -567 | 1,924 | -1,357 |
| – Gross Longs: | 74,741 | 259,796 | 29,346 |
| – Gross Shorts: | 75,308 | 257,872 | 30,703 |
| – Long to Short Ratio: | 1.0 to 1 | 1.0 to 1 | 1.0 to 1 |
| NET POSITION TREND: | | | |
| – Strength Index Score (3 Year Range Pct): | 2.5 | 100.0 | 0.0 |
| – Strength Index Reading (3 Year Range): | Bearish-Extreme | Bullish-Extreme | Bearish-Extreme |
| NET POSITION MOVEMENT INDEX: | | | |
| – 6-Week Change in Strength Index: | -17.9 | 20.2 | -26.9 |
SOYBEAN MEAL Futures:
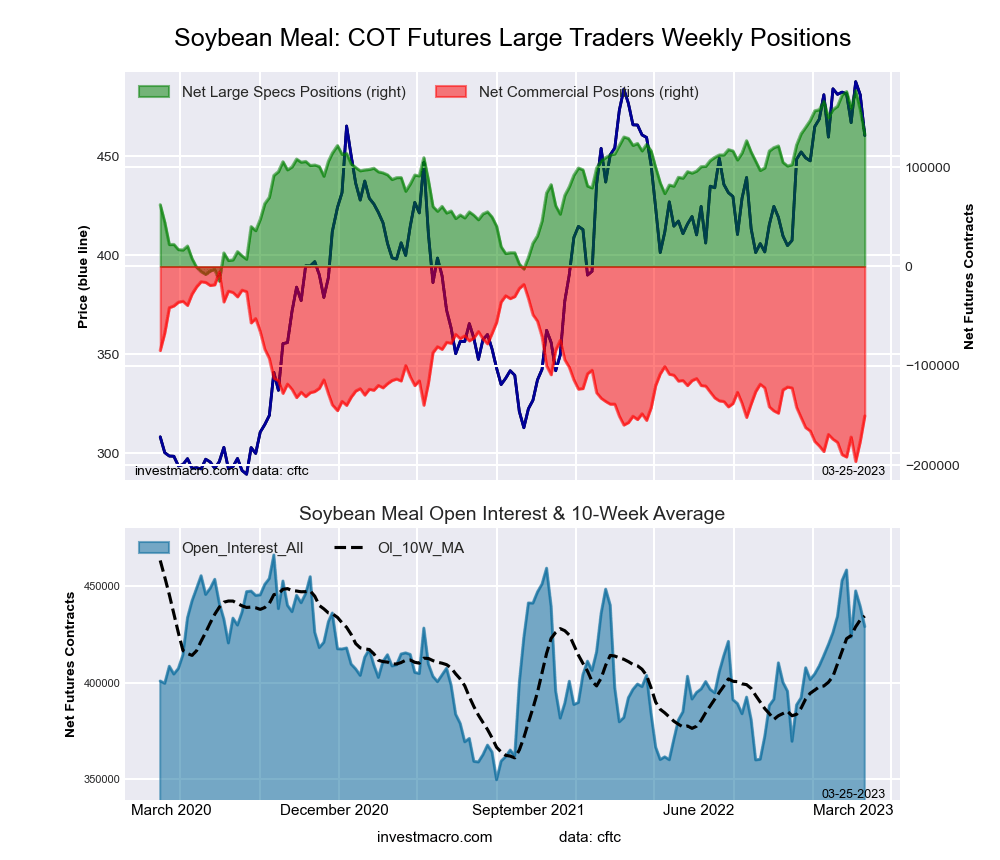 The SOYBEAN MEAL large speculator standing this week was a net position of 133,343 contracts in the data reported through Tuesday. This was a weekly decline of -24,378 contracts from the previous week which had a total of 157,721 net contracts.
This week’s current strength score (the trader positioning range over the past three years, measured from 0 to 100) shows the speculators are currently Bullish with a score of 77.2 percent. The commercials are Bearish with a score of 24.0 percent and the small traders (not shown in chart) are Bearish with a score of 24.0 percent.
| SOYBEAN MEAL Futures Statistics | SPECULATORS | COMMERCIALS | SMALL TRADERS |
| – Percent of Open Interest Longs: | 36.3 | 36.8 | 10.8 |
| – Percent of Open Interest Shorts: | 5.2 | 71.8 | 6.8 |
| – Net Position: | 133,343 | -150,414 | 17,071 |
| – Gross Longs: | 155,660 | 157,931 | 46,260 |
| – Gross Shorts: | 22,317 | 308,345 | 29,189 |
| – Long to Short Ratio: | 7.0 to 1 | 0.5 to 1 | 1.6 to 1 |
| NET POSITION TREND: | | | |
| – Strength Index Score (3 Year Range Pct): | 77.2 | 24.0 | 24.0 |
| – Strength Index Reading (3 Year Range): | Bullish | Bearish | Bearish |
| NET POSITION MOVEMENT INDEX: | | | |
| – 6-Week Change in Strength Index: | -14.5 | 13.9 | 6.6 |
LIVE CATTLE Futures:
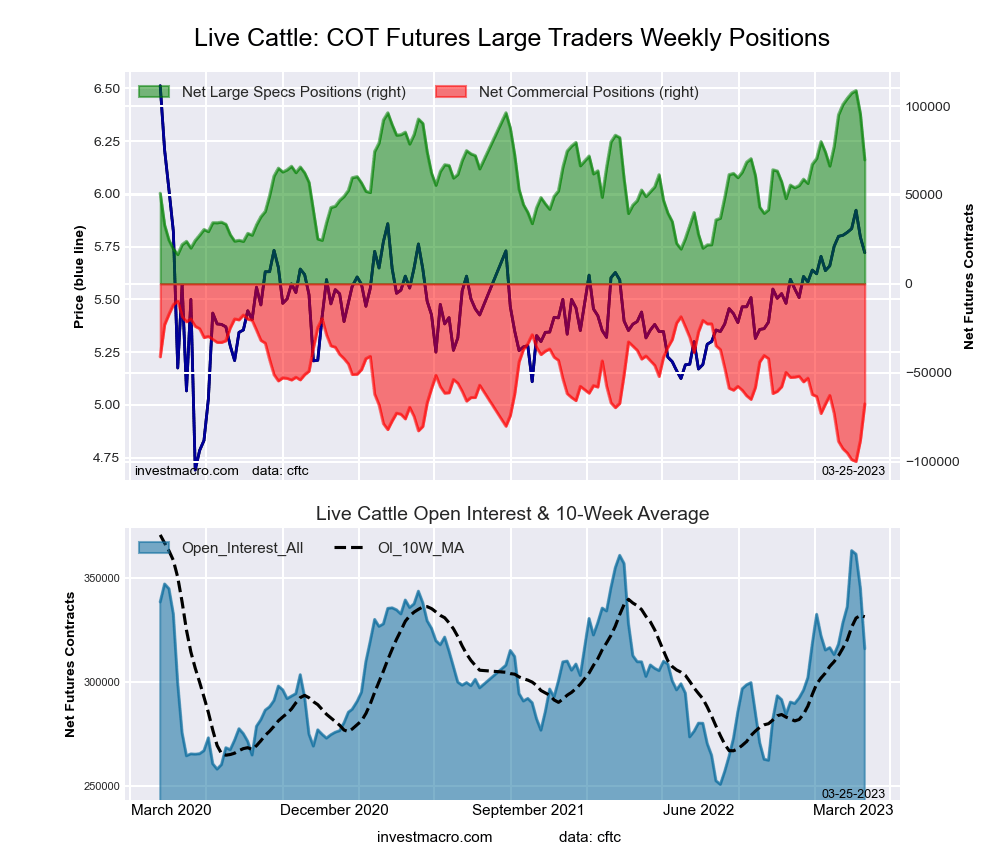 The LIVE CATTLE large speculator standing this week was a net position of 69,700 contracts in the data reported through Tuesday. This was a weekly reduction of -25,773 contracts from the previous week which had a total of 95,473 net contracts.
This week’s current strength score (the trader positioning range over the past three years, measured from 0 to 100) shows the speculators are currently Bullish with a score of 56.2 percent. The commercials are Bearish with a score of 39.2 percent and the small traders (not shown in chart) are Bullish with a score of 77.9 percent.
| LIVE CATTLE Futures Statistics | SPECULATORS | COMMERCIALS | SMALL TRADERS |
| – Percent of Open Interest Longs: | 37.5 | 28.0 | 11.8 |
| – Percent of Open Interest Shorts: | 15.4 | 49.4 | 12.4 |
| – Net Position: | 69,700 | -67,647 | -2,053 |
| – Gross Longs: | 118,518 | 88,370 | 37,174 |
| – Gross Shorts: | 48,818 | 156,017 | 39,227 |
| – Long to Short Ratio: | 2.4 to 1 | 0.6 to 1 | 0.9 to 1 |
| NET POSITION TREND: | | | |
| – Strength Index Score (3 Year Range Pct): | 56.2 | 39.2 | 77.9 |
| – Strength Index Reading (3 Year Range): | Bullish | Bearish | Bullish |
| NET POSITION MOVEMENT INDEX: | | | |
| – 6-Week Change in Strength Index: | -28.4 | 25.5 | 23.9 |
LEAN HOGS Futures:
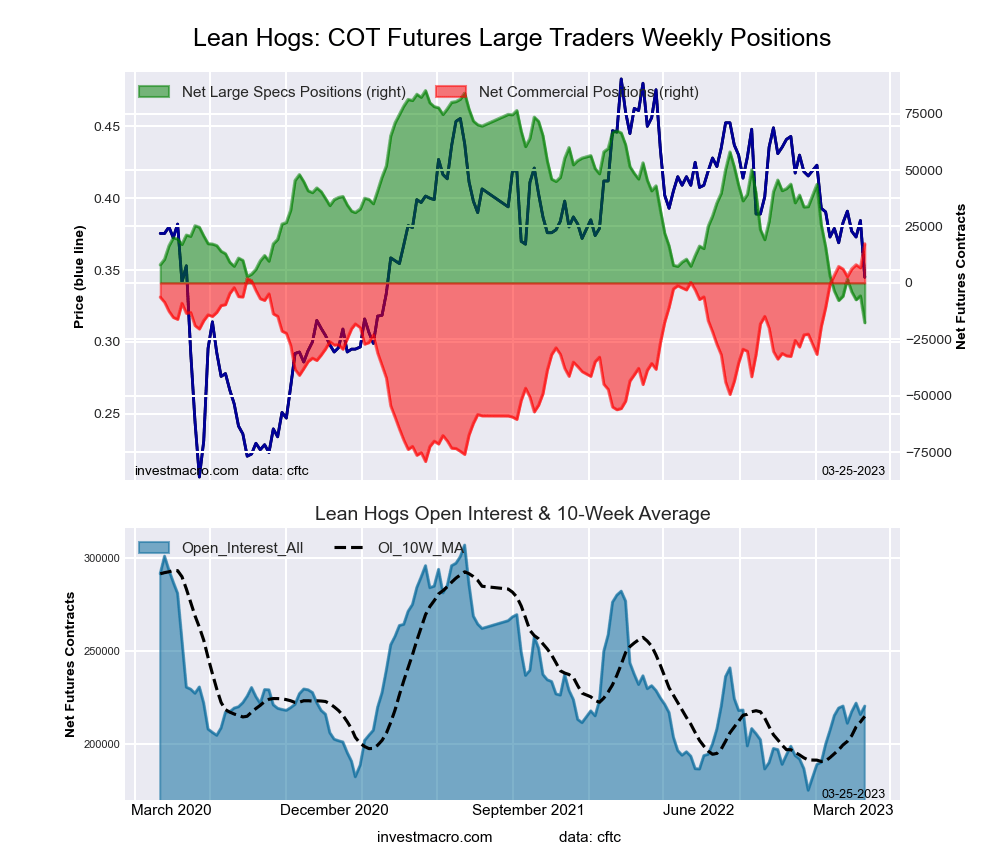 The LEAN HOGS large speculator standing this week was a net position of -17,653 contracts in the data reported through Tuesday. This was a weekly fall of -11,936 contracts from the previous week which had a total of -5,717 net contracts.
This week’s current strength score (the trader positioning range over the past three years, measured from 0 to 100) shows the speculators are currently Bearish-Extreme with a score of 0.0 percent. The commercials are Bullish-Extreme with a score of 100.0 percent and the small traders (not shown in chart) are Bullish-Extreme with a score of 99.0 percent.
| LEAN HOGS Futures Statistics | SPECULATORS | COMMERCIALS | SMALL TRADERS |
| – Percent of Open Interest Longs: | 28.8 | 36.6 | 11.4 |
| – Percent of Open Interest Shorts: | 36.8 | 28.8 | 11.3 |
| – Net Position: | -17,653 | 17,350 | 303 |
| – Gross Longs: | 63,404 | 80,723 | 25,180 |
| – Gross Shorts: | 81,057 | 63,373 | 24,877 |
| – Long to Short Ratio: | 0.8 to 1 | 1.3 to 1 | 1.0 to 1 |
| NET POSITION TREND: | | | |
| – Strength Index Score (3 Year Range Pct): | 0.0 | 100.0 | 99.0 |
| – Strength Index Reading (3 Year Range): | Bearish-Extreme | Bullish-Extreme | Bullish-Extreme |
| NET POSITION MOVEMENT INDEX: | | | |
| – 6-Week Change in Strength Index: | -9.6 | 10.4 | -1.0 |
COTTON Futures:
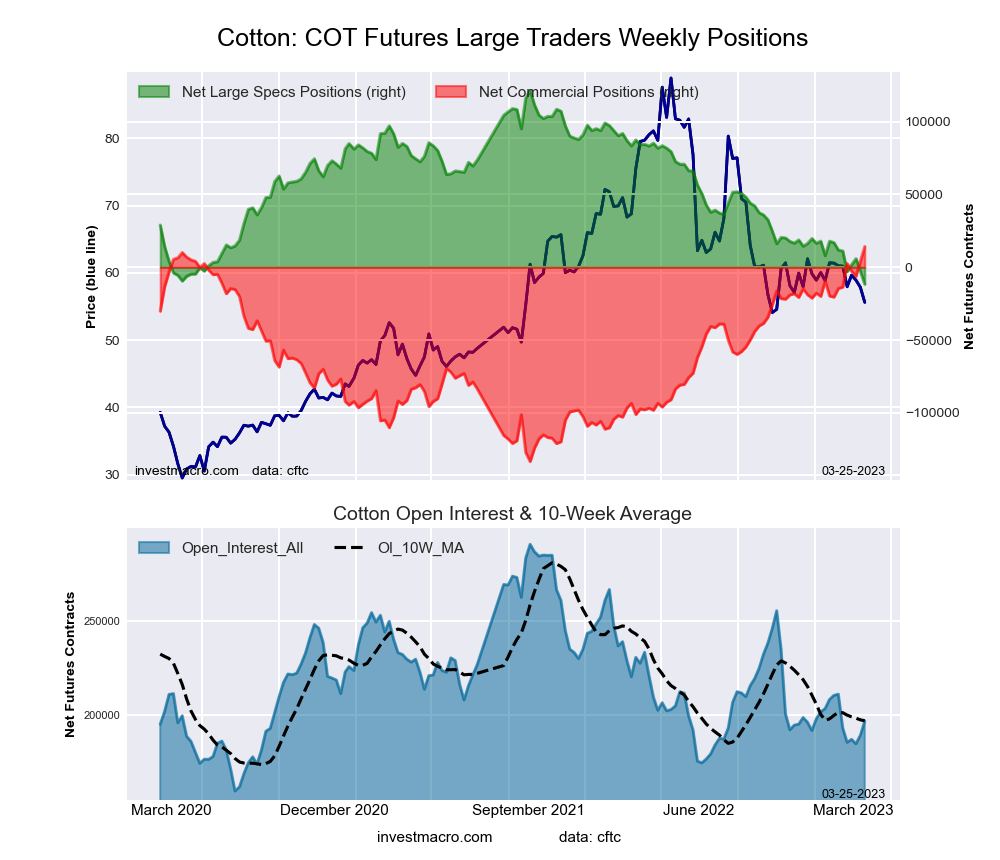 The COTTON large speculator standing this week was a net position of -11,582 contracts in the data reported through Tuesday. This was a weekly decline of -8,794 contracts from the previous week which had a total of -2,788 net contracts.
This week’s current strength score (the trader positioning range over the past three years, measured from 0 to 100) shows the speculators are currently Bearish-Extreme with a score of 0.0 percent. The commercials are Bullish-Extreme with a score of 100.0 percent and the small traders (not shown in chart) are Bearish-Extreme with a score of 0.0 percent.
| COTTON Futures Statistics | SPECULATORS | COMMERCIALS | SMALL TRADERS |
| – Percent of Open Interest Longs: | 26.1 | 50.7 | 5.9 |
| – Percent of Open Interest Shorts: | 32.0 | 43.4 | 7.2 |
| – Net Position: | -11,582 | 14,226 | -2,644 |
| – Gross Longs: | 51,426 | 99,630 | 11,525 |
| – Gross Shorts: | 63,008 | 85,404 | 14,169 |
| – Long to Short Ratio: | 0.8 to 1 | 1.2 to 1 | 0.8 to 1 |
| NET POSITION TREND: | | | |
| – Strength Index Score (3 Year Range Pct): | 0.0 | 100.0 | 0.0 |
| – Strength Index Reading (3 Year Range): | Bearish-Extreme | Bullish-Extreme | Bearish-Extreme |
| NET POSITION MOVEMENT INDEX: | | | |
| – 6-Week Change in Strength Index: | -17.6 | 19.5 | -32.6 |
COCOA Futures:
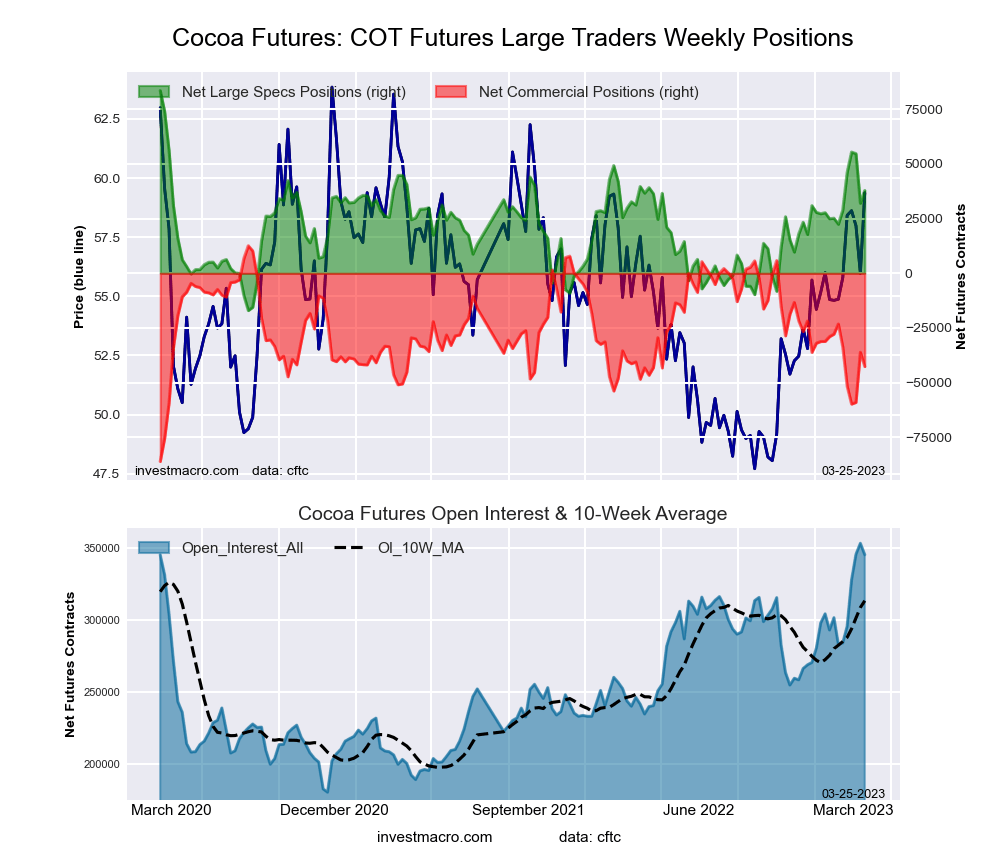 The COCOA large speculator standing this week was a net position of 37,846 contracts in the data reported through Tuesday. This was a weekly lift of 5,827 contracts from the previous week which had a total of 32,019 net contracts.
This week’s current strength score (the trader positioning range over the past three years, measured from 0 to 100) shows the speculators are currently Bullish with a score of 75.8 percent. The commercials are Bearish with a score of 23.7 percent and the small traders (not shown in chart) are Bearish with a score of 44.5 percent.
| COCOA Futures Statistics | SPECULATORS | COMMERCIALS | SMALL TRADERS |
| – Percent of Open Interest Longs: | 28.0 | 41.5 | 4.5 |
| – Percent of Open Interest Shorts: | 17.1 | 53.8 | 3.1 |
| – Net Position: | 37,846 | -42,636 | 4,790 |
| – Gross Longs: | 96,676 | 143,115 | 15,642 |
| – Gross Shorts: | 58,830 | 185,751 | 10,852 |
| – Long to Short Ratio: | 1.6 to 1 | 0.8 to 1 | 1.4 to 1 |
| NET POSITION TREND: | | | |
| – Strength Index Score (3 Year Range Pct): | 75.8 | 23.7 | 44.5 |
| – Strength Index Reading (3 Year Range): | Bullish | Bearish | Bearish |
| NET POSITION MOVEMENT INDEX: | | | |
| – 6-Week Change in Strength Index: | 21.3 | -26.8 | 40.4 |
WHEAT Futures:
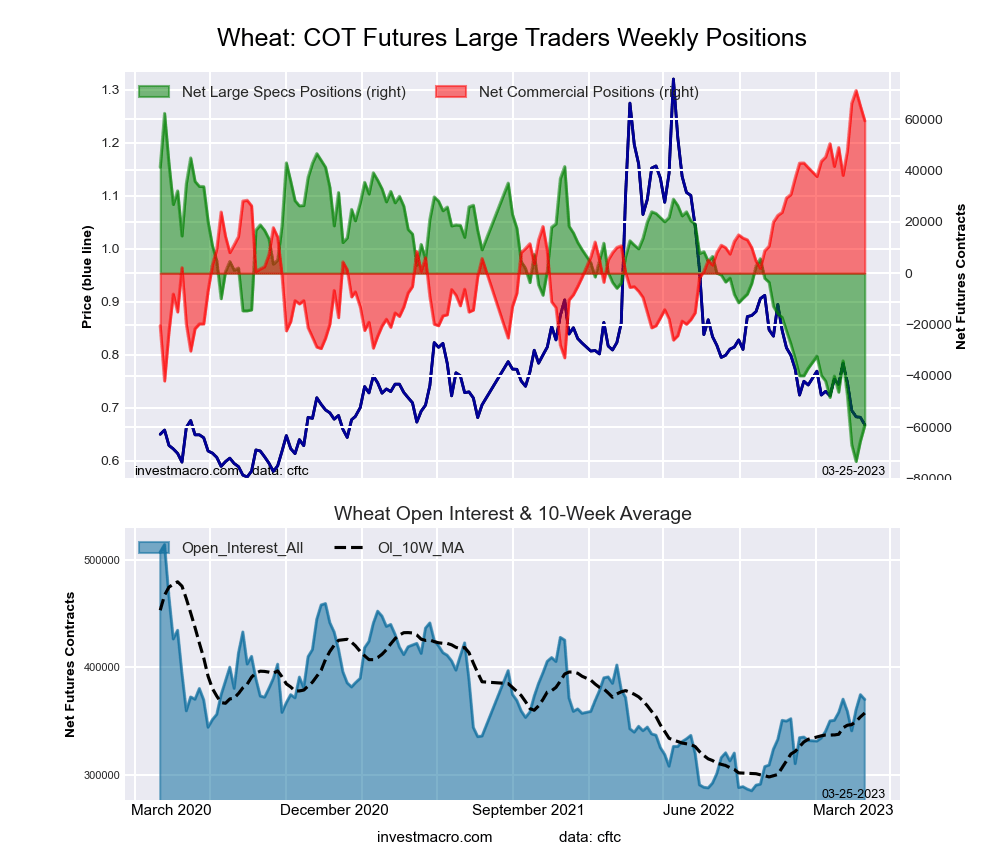 The WHEAT large speculator standing this week was a net position of -59,203 contracts in the data reported through Tuesday. This was a weekly gain of 6,111 contracts from the previous week which had a total of -65,314 net contracts.
This week’s current strength score (the trader positioning range over the past three years, measured from 0 to 100) shows the speculators are currently Bearish-Extreme with a score of 11.7 percent. The commercials are Bullish-Extreme with a score of 89.0 percent and the small traders (not shown in chart) are Bullish-Extreme with a score of 90.2 percent.
| WHEAT Futures Statistics | SPECULATORS | COMMERCIALS | SMALL TRADERS |
| – Percent of Open Interest Longs: | 28.4 | 35.9 | 9.7 |
| – Percent of Open Interest Shorts: | 44.4 | 19.9 | 9.8 |
| – Net Position: | -59,203 | 59,325 | -122 |
| – Gross Longs: | 105,293 | 133,069 | 35,982 |
| – Gross Shorts: | 164,496 | 73,744 | 36,104 |
| – Long to Short Ratio: | 0.6 to 1 | 1.8 to 1 | 1.0 to 1 |
| NET POSITION TREND: | | | |
| – Strength Index Score (3 Year Range Pct): | 11.7 | 89.0 | 90.2 |
| – Strength Index Reading (3 Year Range): | Bearish-Extreme | Bullish-Extreme | Bullish-Extreme |
| NET POSITION MOVEMENT INDEX: | | | |
| – 6-Week Change in Strength Index: | -10.7 | 9.7 | 10.6 |
Article By InvestMacro – Receive our weekly COT Newsletter
*COT Report: The COT data, released weekly to the public each Friday, is updated through the most recent Tuesday (data is 3 days old) and shows a quick view of how large speculators or non-commercials (for-profit traders) were positioned in the futures markets.
The CFTC categorizes trader positions according to commercial hedgers (traders who use futures contracts for hedging as part of the business), non-commercials (large traders who speculate to realize trading profits) and nonreportable traders (usually small traders/speculators) as well as their open interest (contracts open in the market at time of reporting). See CFTC criteria here.


