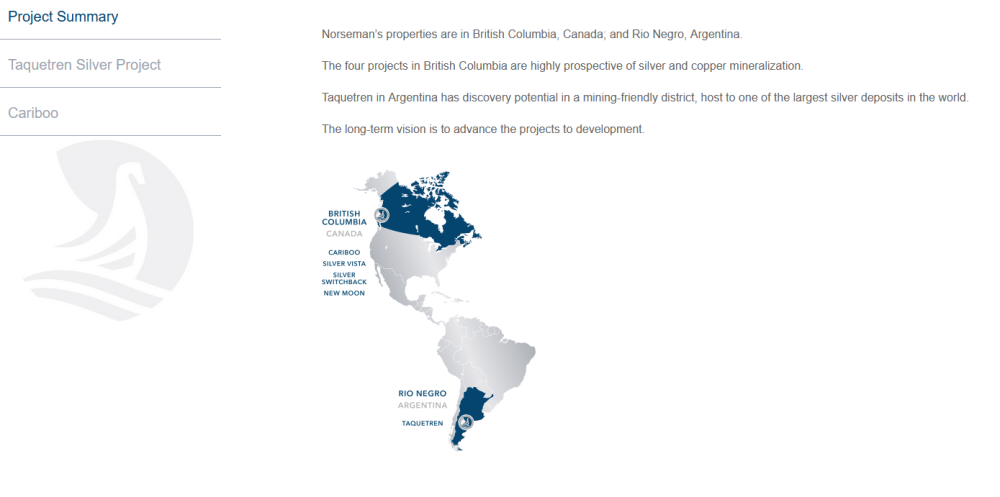
Source: Streetwise Reports (10/19/23)
An improved tellurium-based thermoelectric generator being tested in Canada could increase the efficiency of electric vehicles, solar power, and combustible engines. Researchers say the markets are expanding.
First Tellurium Corp. (FTEL:CSE; FSTTF:OTCQB) announced an improved tellurium-based thermoelectric generator that could increase the efficiency of electric vehicles (EVs), solar power generation, and combustible engines.
The prototype was developed in the United States by First Tellurium’s 51%-owned thermoelectric-focused research and development company, 1406975 BC Ltd.
The generator is being delivered to Vancouver for further testing, the company said.
“Tellurium’s advantages for heat-to-energy conversion have long been recognized and understood,” said First Tellurium President and Chief Executive Officer Tyrone Docherty. “With the pressing need to increase the efficiency of alternative energy sources and both electric and combustion vehicles, we are in a strategic position to advance tellurium’s thermoelectric applications and contribute to the worldwide shift away from fossil fuels.”
The research company aims to explore new uses for tellurium and develop improved thermoelectric generators for the renewable and automotive industries.
“Completion of this prototype marks the next step of many towards what we believe will be innovative and valuable thermoelectric applications for tellurium,” Docherty said. “The generator, in its initial testing and development, has demonstrated potentially significant improvements in the conversion of heat to energy. We look forward to advancing the technology through further testing and research.”
The global market for thermoelectric generators was valued at US$472.5 million in 2020, according to Allied Market Research. It is forecasted to grow to more than US$1.4 billion by 2030, growing at a compound annual growth rate (CAGR) of 11.8% from 2021 to 2030.
“Increase in demand for fuel-efficient vehicles and implementation of stringent government regulations to curb the emission of carbon dioxide act as the key driving forces of the global thermoelectric generator market,” Allied Market Research noted.
The Catalyst: Finding New Ways to Generate Power for Green Economy
Tellurium (Te) is one of the least common elements on Earth, according to the U.S. Geological Survey. In addition to thermoelectric applications, it’s also used in solar photovoltaic (solar PV) panels, lithium batteries, vulcanizing rubber, tinting glass, and manufacturing rewritable CDs and DVDs.
The element’s role as a semiconductor has increased its use in solar PV panels, the company said.
Recent International Energy Agency (IEA) forecasts show that solar PV technology will generate more power by 2027 than any other source. The market for Te is expected to grow by about 60 metric tons (about 10% of current production) from 2020 to 2024, according to research by Technavio.
“Factors such as increasing urban population, rise in disposable income, strong supply chain, and high internet penetration are driving the growth of the global consumer electronics market,” the research firm said in a release. “The increase in demand for consumer electronics will, in turn, drive the demand for tellurium over the forecast period.”
Technical Analyst Clive Maund recently named First Tellurium as a part of his 8 Stocks that are Rated Immediate Buys list.
First Solar is spending big to increase its module capacity, which is sure to strain the tellurium market. According to researchers at the Institute of Environmental Science and Technology at the Autonomous University of Barcelona, annual demand for the mineral could jump 70%.
First Tellurium’s Deer Horn site in British Columbia is known to have the only positive preliminary economic assessment (PEA) for a tellurium project in North America and was named a world-class project by solar panel maker First Solar Inc. (FSLR:NYSE)
In addition, the company’s Klondike tellurium project in Colorado is considered America’s top tellurium exploration project and was previously owned by First Solar as a potential source of raw tellurium for its solar panels.
Technical Analyst Clive Maund recently named First Tellurium as a part of his 8 Stocks that are Rated Immediate Buys list.
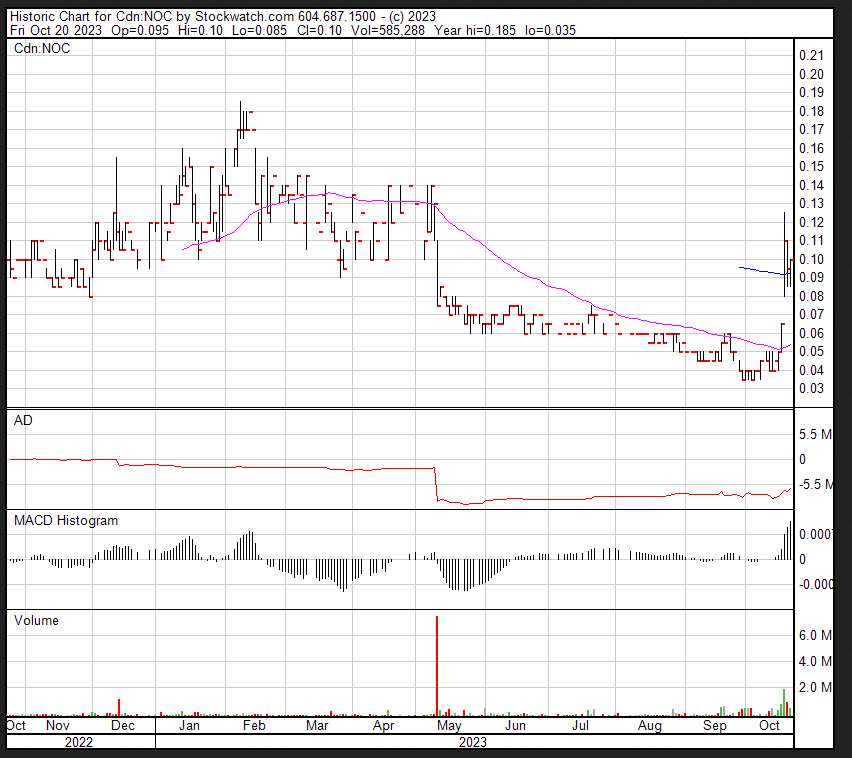
“First Tellurium has been bumping along the bottom in recent months with heavy buying late in May and again late last month, that drove the Accumulation line sharply higher, suggesting that it is readying to advance,” Maund wrote. “Longer-term charts show big support in the (CA$0.10) area, from which it has repeatedly rallied, underpinning the price, and with it still only at 12 cents, it looks like a Strong Speculative Buy here. Even if it only makes it up to the top of the trading range of the past 18 months, it will double from here.”
Mineralized Systems Connected
An induced polarization (IP) geophysical survey last month followed upsampling, prospecting, and mapping at Deer Horn in 2022 and 2023 to extend the mineralized zone of the copper-gold porphyry and gold-silver-tellurium vein systems there to more than 17 kilometers, the company said.
The company will use the information and work from the previous two years to formulate a much larger drilling program next year.
Streetwise Ownership Overview*
First Tellurium Corp. (FTEL:CSE; FSTTF:OTCQB)
| Retail: 89% | |
| Management/Insiders: 11% |
“Our prospecting, mapping, and sampling over the past two years has given us an extensive base of information to support the drilling and IP survey,” Docherty said. “What we have learned is that both the copper-gold porphyry target and gold-silver-tellurium vein system extend much farther than we first understood. Even more important is the discovery last month that the two mineralized systems are connected, supporting the premise that the property could support a large copper-gold porphyry across ground that has never been explored.”
Ownership and Share Structure
According to the company, 11% of First Tellurium is owned by management and insiders.
Docherty owns 10.6% or 7.7 million shares, Director Josef Anthony Steve Fogarassy has 1.38% or 1 million shares, and Director Lyle Allen Schwabe has 0.73% or 0.53 million shares. There are no institutional investors, and the rest is retail.
The company has a market cap of CA$8.66 million, with about 73 million shares outstanding and 63.3 million free-floating. It trades in a 52-week range of CA$0.245 and CA$0.085.
Important Disclosures:
- First Tellurium Corp. has a consulting relationship with an affiliate of Streetwise Reports, and pays a monthly consulting fee between US$8,000 and US$20,000.
- As of the date of this article, officers and/or employees of Streetwise Reports LLC (including members of their household) own securities of First Tellurium Corp.
- Steve Sobek wrote this article for Streetwise Reports LLC and provides services to Streetwise Reports as an employee.
- The article does not constitute investment advice. Each reader is encouraged to consult with his or her individual financial professional. By opening this page, each reader accepts and agrees to Streetwise Reports’ terms of use and full legal disclaimer. This article is not a solicitation for investment. Streetwise Reports does not render general or specific investment advice and the information on Streetwise Reports should not be considered a recommendation to buy or sell any security. Streetwise Reports does not endorse or recommend the business, products, services or securities of any company mentioned on Streetwise Reports.
For additional disclosures, please click here.