COVID-19 Potential for Severe Secondary Waves in Asia

By Dan Steinbock

– Since the secondary virus waves started far earlier than expected and could be compounded by an adverse mutation, a new potential threat looms over Asia – as heralded by recent discoveries in Quezon City and Malaysia.

In the absence of deceleration, the accumulated confirmed cases worldwide could soar to 50-60 million and deaths to 1.5 to 1.7 million by the year-end. If Asian countries fail to “bend the curve” – that is, slow down the rapid acceleration of new COVID-19 cases – what we have seen in the past half a year could be a prelude to worse across the region.

In April, my first COVID-19 report focused on the outbreak in China and the belated mobilization and containment failure in the United States and Western Europe. My new report The Tragedy of More Missed Opportunities focuses on the estimated COVID-19 human costs and economic damage in the largest world economies, particularly in emerging and developing countries.

Since the anticipated ‘secondary waves’ began months earlier than expected, the coming months will test the public health systems of all nations. But some countries have better starting points.

Asia’s COVID-19 vulnerable countries – including the Philippines

Some countries will face the secondary waves from a position of resilience. They are countries that have managed to bend the curve,” with decelerating cumulative cases and lower positivity rates (the percentage of people who test positive for the virus of those overall who have been tested).

Other countries must struggle with the new waves from a position of vulnerability. They are countries that have failed to bend the curve, with accelerating cumulative cases and higher positivity rates.

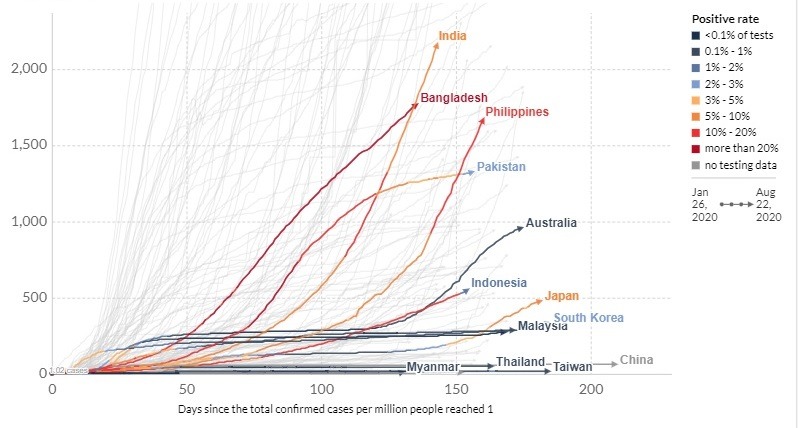
In emerging and developing South, Southeast and East Asia, several countries are at risk. To gain a more realistic picture, let’s use population-adjusted data, linear scale and focus on those economies in which cases are still accelerating and positivity rate remains high (Figure 1).

Figure 1 Cumulative Confirmed COVID-19 Cases (Per 1 Million)
Source: European CDC, Difference Group, Aug 22, 2020

In this view, the primary risk group involves most of South Asia; that is, India, Bangladesh and Pakistan in which the number of cases continues to accelerate and positivity rate remains very high (around 5/10-20%).

The primary risk group also features Southeast Asia’s big growth engines, the Philippines and Indonesia, where numbers continue to accelerate alarmingly and positivity rates are as high as in South Asia.

However, these numbers significantly downplay effective realities in Pakistan where the current testing capacity is only half of that in India and the Philippines. The underassessments are likely to be even broader in Indonesia and Bangladesh, where the comparable capacity is barely a third relative to India and the Philippines.

In East Asia, case numbers continue to accelerate in Australia and Japan. Neither mobilized against the virus in time and effectively. However, unlike Australia, Japan’s testing capacity is very low for an advanced economy (only half relative to the Philippines) and thus likely disguises the true damage.

A new mutation, severe regional consequences

Recently, a “more infectious” COVID-19 strain was found in tested samples in Quezon City and in Malaysia. In the latter, the cases were discovered in clusters linked to cases imported from India and the Philippines.

This is a kind of development that was projected in my new report. It requires more research and aggressive vigilance. Here’s why: Not so long ago, a mutation was discovered in the protein that permits SARS-CoV-2 to enter cells possibly making it easier for the virus to spread.

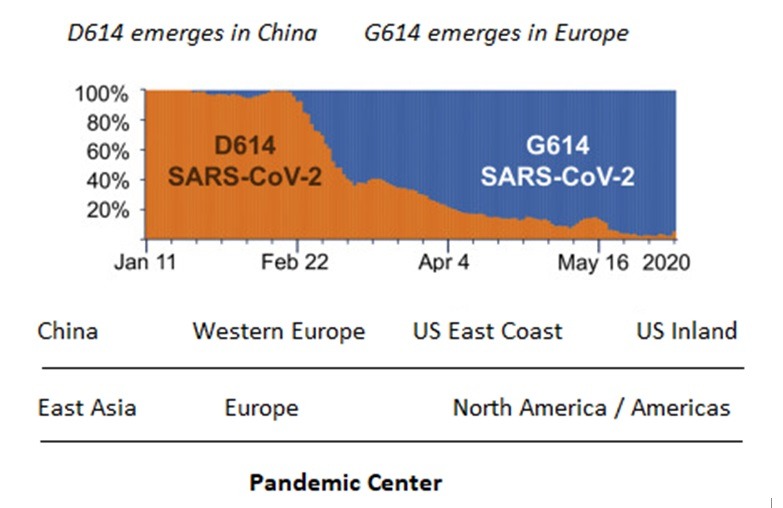
Now, the original samples of the novel coronavirus out of Wuhan, China, were a variation that scientists call the “D” clade. Before March 1, over 90% of viral samples taken from patients were from D variation. Since March, however, a new “G” variation has been dominant (Figure).

Figure 2 Potential Transition of the Dominant Pandemic Form
Source: Korber, Bette et al. 2020. “Tracking Changes in SARS-CoV-2 Spike.” Cell, July 3; Steinbock, Dan. 2020. The Tragedy of More Missed Opportunities, Aug 7.

Though not conclusive yet, current evidence suggests there has been a global transition from the D to the G variation. Worse, the latter appears to increase COVID-19 infectivity.

Virulent implications?

If, as the researchers hypothesize, the G variation accelerated in Europe, it benefited from the global transportation hubs migrating across the Atlantic to New York City, which then seeded many of the outbreaks in the rest of the US, including locations where it is now running unchecked – as some investigative journalists also discovered by April.

There is a distressing implication associated with the presumed global transition from D to G variation. It could make the pandemic burden of emerging and developing economies more challenging than currently anticipated, particularly after normalization in the US and Europe, when quarantines, lockdowns and travel restrictions are phased out in the West.

Due to proximity and regional spillovers from the US, the G has been dominant in South America since March-April. Perhaps for similar reasons – proximity with Europe – it has also dominated infectivity in Africa.

In Asia and Oceania, the less-infective D was more dominant until recently. However, continued case acceleration and G variation dominance in several countries, coupled with the proliferation of secondary waves could change the status quo – for the worse.

Predecents matter

Historical precedents are instructive. Between 1918 and 1920, the Spanish flu is estimated to have infected 500 million people; every third person in the world at the time, while the death toll has been estimated at 17 to 50 million.

Yet, it was the second wave that proved far more deadly than the first. Facilitated by troop movements and logistical hubs during World War I, it spread over to North America, then Central and South America, and eventually to Africa Russia and Asia.

Today, the precedent of the Spanish flu should underscore the importance of proactive vigilance until effective vaccines, therapies or both are widely available.

If we still haven’t learned the “lesson of the second wave,” we will be forced to learn it over a major crisis – a more protracted pandemic and a multiyear global depression.

About the Author:

Dr. Dan Steinbock is an internationally recognized strategist of the multipolar world and the founder of Difference Group. He has served at the India, China and America Institute (USA), Shanghai Institutes for International Studies (China) and the EU Center (Singapore). For more, see https://www.differencegroup.net/ 

Based on Dr Steinbock’s briefing of Aug 21 and his new report The Tragedy of More Missed Opportunities (https://www.differencegroup.net/covid19-report2)

 

OATS Analysis: Higher demand for Canadian exports bullish for oats

By IFCMarkets.com

Higher demand for Canadian exports bullish for oats

Canada’s oats exports are higher in the new crop year indicating higher demand for the cereal considered a healthy grain. Oats export from Canada in the first two weeks of August 2020 were recorded at 58.2 thousand tons -more than triple the volume of exports for the same period last year, according to Government of Alberta, Canada Weekly Market Review. The review also projected a 5.1% increase for exports by year end. Canada is the top world exporter of oats – Canadian oats exports accounted for 52% ($379 million) of the world exports in 2018. Higher demand as evidenced by higher exports is bullish for oats price.

IndicatorVALUESignal
RSINeutral
MACDBuy
Donchian ChannelNeutral
MA(200)Sell
FractalsBuy
Parabolic SARBuy


Summary of technical analysis

OrderBuy
Buy stopAbove 217.7
Stop lossBelow 256.1


Market Analysis provided by IFCMarkets.com

Ichimoku Cloud Analysis 27.08.2020 (EURJPY, NZDUSD, NZDCAD)

Article By RoboForex.com

EURJPY, “Euro vs Japanese Yen”

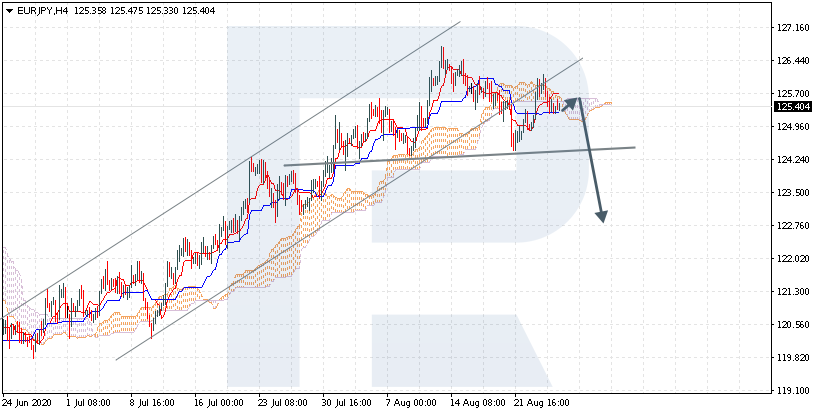
EURJPY is trading at 125.40; the instrument is moving below Ichimoku Cloud, thus indicating a descending tendency. The markets could indicate that the price may test the cloud’s upside border at 125.65 and then resume moving downwards to reach 122.75. Another signal in favor of further downtrend will be the formation of a Head & Shoulders reversal pattern. However, the bearish scenario may no longer be valid if the price breaks the cloud’s upside border and fixes above 126.45. In this case, the pair may continue growing towards 127.35. To confirm further decline, the asset must break the support area and fix below 124.15.

EURJPY_H4
Risk Warning: the result of previous trading operations do not guarantee the same results in the future

NZDUSD, “New Zealand Dollar vs US Dollar”

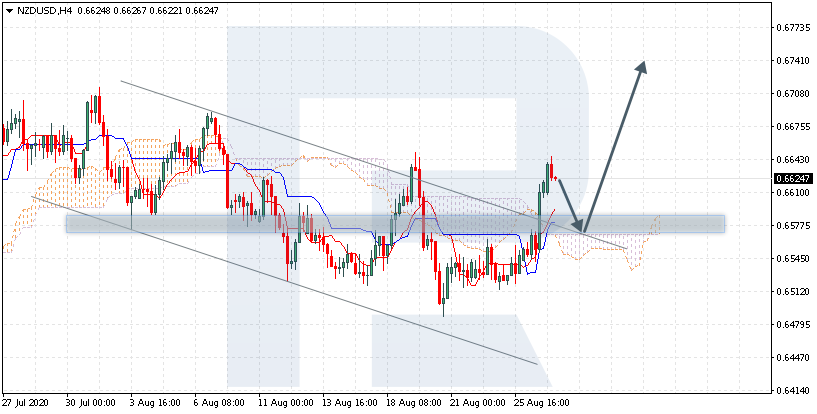
NZDUSD is trading at 0.6624; the instrument is moving above Ichimoku Cloud, thus indicating an ascending tendency. The markets could indicate that the price may test the cloud’s upside border at 0.6580 and then resume moving upwards to reach 0.6740. Another signal in favor of further uptrend will be a rebound from the descending channel’s upside border. However, the bullish scenario may be canceled if the price breaks the cloud’s downside border and fixes below 0.6515. In this case, the pair may continue falling towards 0.6435.

NZDUSD_H4
Risk Warning: the result of previous trading operations do not guarantee the same results in the future

NZDCAD, “New Zealand Dollar vs Canadian Dollar”

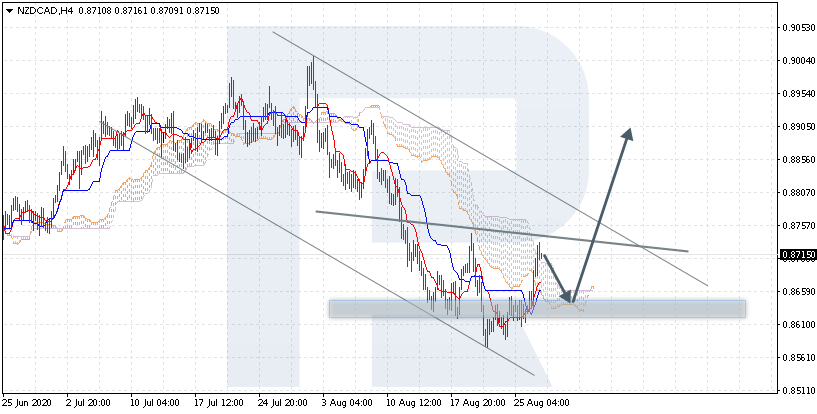
NZDCAD is trading at 0.8715; the instrument is moving above Ichimoku Cloud, thus indicating an ascending tendency. The markets could indicate that the price may test the cloud’s downside border at 0.8625 and then resume moving upwards to reach 0.8905. Another signal in favor of further uptrend will be a rebound from the formation of a reversal pattern. However, the bullish scenario may no longer be valid if the price breaks the cloud’s downside border and fixes below 0.8595. In this case, the pair may continue falling towards 0.8505. To confirm further growth, the asset must break the descending channel’s upside border and fix above 0.8765.

NZDCAD

Article By RoboForex.com

Attention!
Forecasts presented in this section only reflect the author’s private opinion and should not be considered as guidance for trading. RoboForex LP bears no responsibility for trading results based on trading recommendations described in these analytical reviews.

Fed’s announcement will fuel stocks – but there’s a warning for investors

By George Prior

The Fed’s landmark monetary policy statement will trigger investors to pile further into equities – but beware of the lack of balance in the markets, warns the boss of one of the world’s largest independent financial advisory organizations.

The warning from Nigel Green, the CEO and founder of deVere Group, which has more than $12bn under advisement, comes after the U.S. Federal Reserve chair Jerome Powell set out a major policy shift at the central bank’s annual summit in Jackson Hole, Wyoming.

Mr Green says: “The Fed chief has just outlined a highly-anticipated shake-up of the monetary policy of the world’s de facto central bank.

“The Fed will keep interest rates at almost zero for the foreseeable future, possibly for more than five years, and it will take a more casual approach toward inflation, even championing a modest rise above their 2% target.”

He continues: “This will add fuel to global equities which are already on fire, having hit a record high on Wednesday.

“In this climate, holding bonds and sitting on cash will simply not provide the returns investors seek.

“Against this backdrop, many more will pile further into equities, which appear to be on a winning streak. But investors must beware of the lack of balance in the stock markets.

“A failure to recognise how unevenly distributed the gains are could prove to be a costly mistake.

“Not all stocks represent the same opportunities as others.  Investors must bear this imbalance in mind.

“Indeed, the equities boom is driven by a handful of companies, mainly in Big Tech, which are accounting for a significant and disproportionate level of the capitalisation of stock indexes, including the benchmark S&P500 index.”

Therefore, buying an exchange-traded fund, or ETF, which are investment funds traded on stock exchanges, could, says the deVere CEO, expose investors unnecessarily.

Nigel Green concludes: “The Fed’s announcement could provide investors with lucrative rewards – but in these unusual times, serious and joined-up planning is required to take full advantage of the opportunities. Working with an experienced fund manager will best-position them to capitalize on these and also to mitigate potential risks of uneven markets.”

About:

deVere Group is one of the world’s largest independent advisors of specialist global financial solutions to international, local mass affluent, and high-net-worth clients.  It has a network of more than 70 offices across the world, over 80,000 clients and $12bn under advisement.

Murrey Math Lines 27.08.2020 (USDCHF, GOLD)

Article By RoboForex.com

USDCHF, “US Dollar vs Swiss Franc”

As we can see in the H4 chart, USDCHF is moving between 0/8 and 1/8. In this case, the price is expected to break 1/8 and then continue growing to reach the resistance at 3/8. However, this scenario may no longer be valid if the price breaks 0/8 to the downside. After that, the instrument may continue falling towards the support at -1/8.

USDCHF_H4
Risk Warning: the result of previous trading operations do not guarantee the same results in the future

In the M15 chart, the pair may break the upside line of the VoltyChannel indicator and, as a result, continue the ascending tendency.

USDCHF_M15
Risk Warning: the result of previous trading operations do not guarantee the same results in the future

XAUUSD, “Gold vs US Dollar”

In the H4 chart, after breaking 7/8, XAUUSD is moving above it. In this case, the price is expected to continue growing to reach the next resistance at 8/8. However, this scenario may no longer be valid if the price breaks the support at 7/8 to the downside. After that, the instrument may continue falling towards the support at 6/8.

GOLD_H4
Risk Warning: the result of previous trading operations do not guarantee the same results in the future

As we can see in the M15 chart, the pair has broken the upside line of the VoltyChannel indicator and, as a result, may continue trading upwards.

GOLD_M15

Article By RoboForex.com

Attention!
Forecasts presented in this section only reflect the author’s private opinion and should not be considered as guidance for trading. RoboForex LP bears no responsibility for trading results based on trading recommendations described in these analytical reviews.

Over to you, Mr. Powell

By Han Tan, Market Analyst, ForexTime

The stage is set (or bedroom and bookshelf) for the Fed Chair’s keynote speech at the annual Jackson Hole pow-wow for central bankers, which is scheduled for 14.10 London time.  This (virtual) conference is notoriously one of the potential policy-defining events of the year and 2020 may well be no different, even if the market is somewhat exhausted by the alphabet soup of measures announced during the Covid-19 crisis.

In fact that soup remains on the menu with AIT (Average Inflation Targeting), YCC (Yield Curve Control) and MMT (Modern Monetary Theory) all mooted as policy levers ready to be used by the Fed and to be announced in the review of its monetary policy framework in the upcoming FOMC September meeting. YCC a-la- Japan certainly seems to be off the table having not been mentioned in the latest meeting minutes, so traders are expecting a policy move to allow inflation to overshoot the 2% target and make up for the undershoots, in order to achieve two percent on average.

What does this mean for markets? As we have seen for some time, AIT would cement the prospects of low US real rates for the foreseeable future and keep the Dollar on the back foot. Going forward, the Fed would hope to see higher inflation and long-term yields which would at some point result in a slightly stronger dollar. Whether this will actually work is a question for another time, but the Fed’s credibility may rest on its ability to convince the market that it can achieve these goals.

DXY already priced?

With dovish-leaning comments expected from Powell and the Dollar taking another hit yesterday with cyclical G10 currencies rallying, anything else today will see a strong reversal in this trend and an equity market sell-off. The EUR did lag the other majors in Wednesday’s move, but we remind ourselves that long EUR speculative positioning is very stretched.

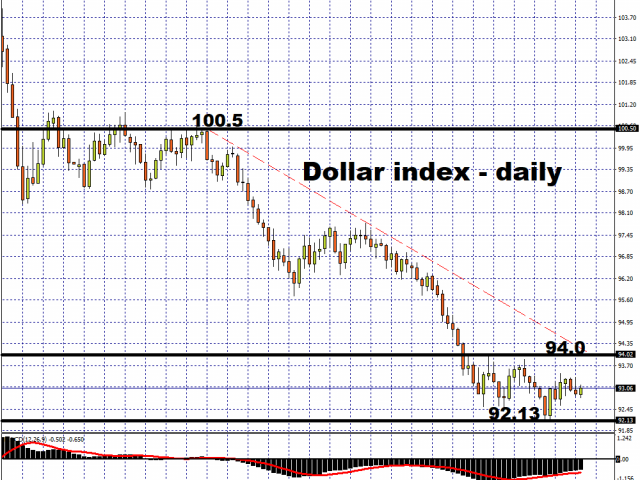
DXY prices are still oscillating around, but just under the long-term trendline from May 2011 so this appears to represent quite a barrier to any upside. Otherwise, the bearish trendline from the May highs this year may cap any dollar strength with strong resistance around 94.00. The August lows at 92.13 are the first target for sellers if we see the index continue its bearish momentum.


Disclaimer: The content in this article comprises personal opinions and should not be construed as containing personal and/or other investment advice and/or an offer of and/or solicitation for any transactions in financial instruments and/or a guarantee and/or prediction of future performance. ForexTime (FXTM), its affiliates, agents, directors, officers or employees do not guarantee the accuracy, validity, timeliness or completeness, of any information or data made available and assume no liability as to any loss arising from any investment based on the same.


Forex-Time-LogoArticle by ForexTime

ForexTime Ltd (FXTM) is an award winning international online forex broker regulated by CySEC 185/12 www.forextime.com

Look For Platinum To Rally – Following Gold

By TheTechnicalTraders 

– RESEARCH HIGHLIGHTS:

  • Incredible Opportunities In Precious Metals Right Now
  • Platinum Sets Up For A Big Breakout
  • Gold Poised To Continue Rally
  • Silver Is Still In The “Super-Hero” Setup
  • Rally Hinges On The Platinum Breakout Above $1,050.50

Platinum may be setting up in a technical pattern that is similar to the end of 2001/early 2002.  At that time, Gold had already begun to rally above $340 and Platinum had rallied to levels above $600.  Then, while Gold continued to rally, Platinum contracted to price levels near $400 on diminishing volume.  Once that contraction was complete, Platinum began and upside price move with stronger volume levels which lasted almost seven years – reaching a peak above $2,300.  Could the same setup be happening right now?

PLATINUM MIRRORING GOLD – JUST LIKE IT DID IN 2003

The upside price move in Gold may be the key to understanding the potential for an upside price move in Platinum.  Gold has already rallied from $1,340 to over $1,000 over the past 12+ months while Platinum has moved lower from $2,000 to $800 and has recently started forming a rounded bottom formation.  The deep price decline in Platinum in March 2020 setup a very deep low near $562.  We believe the diminishing volume and deep low bottom setup in Platinum are mirroring the 2002 deep bottom setup and starting a potentially strong rally for Platinum.

This Platinum Monthly chart below shows the 2000 to 2010 rally, including the 2002 deep bottom setup and volume setup, suggests that once Platinum rallied above the previous high price level near $641, the opportunity for a continued upside price rally was consistent.  We believe the basis for this move was the continued upside price rally in Gold.  As Gold began to appreciate, Platinum continued to appreciate and trend higher – following Gold’s lead.

The current Platinum/Gold Monthly chart, below, shows a strong rounded bottom formation in Gold (the BLUE line on this chart) and the upside breakout in Gold that took place back in May 2019. Meanwhile, Platinum has extended a rounded bottom formation and recently set up a very deep spike price low with the COVID-19 price collapse.

Be sure to opt-in to our free market trend signals before closing this page so you don’t miss our next special report!

My team and I believe once Platinum breaks above the $1,050.50 level on increasing trading volume while Gold continues to rally, a larger upside price trend will setup in both Gold and Platinum that could mirror what happened from 2004 through 2010.  This would suggest Gold could rally more than 400% from current levels and Platinum could rally more than 300% from current levels.

The following Weekly Platinum chart highlights the setup in Platinum we believe may prompt a big upside breakout move soon.  The diminishing volume throughout a downside price trend – followed by increasing volume throughout a recovery, and eventual breakout of the resistance level near $1,050.50. We would watch for Gold to continue to rally over the next 12+ weeks, while the volume levels increase in Platinum as it attempts to close in on the $1,050.50 price level.  Once that level is breached to the upside, we would expect volume levels to continue to increase (on average) as both Gold and Platinum are considered as a “pair of fear hedge metals” and continue to rally up to a peak.

If we are correct in our interpretation of the pattern, then a 400% rally in Gold from the breakout level in Platinum would put the Gold peak price level somewhere above $7,500 or higher.  This would put the Platinum peak level somewhere near $3,450 or higher.

As many of you may already know, we love the metals and we love to apply our technical analysis skills and pattern research onto these charts.  Could you imagine the scope of the rally that is setting up in Platinum mirrors the 2003 to 2010 price rally – just waiting for this breakout pattern to complete?

Get ready because this could be one over the biggest upside price moves in precious metals that anyone has ever seen since the 2003 to 2010 rally.  This might push Gold above $7,500 an ounce and may push Platinum above $3,400 per ounce.  Guess where Silver prices should be at those levels?? (we’ll give you a hint: somewhere north of $125 per ounce).

If you found this informative, then sign up now to get a pre-market video every day before the opening bell that walks you through the charts and my proprietary technical analysis of all of the major assets classes. You will also receive my easy-to-follow ETF swing trades that always include an entry price, a stop, two exit targets, as well as a recommended position sizing. Visit my Active ETF Trading Newsletter to learn more.

While many of you have trading accounts, our most important accounts are long-term buy-and-hold investment accounts. Our signals can help you preserve and even grow your long term capital. If you have any type of long-term investment or retirement account and are looking for signals as to when to own equities, bonds, or cash, be sure to become a member of my Long-Term Investing Signals, which includes a weekly market update and trade alerts.

Chris Vermeulen
Chief Market Strategist
Founder of Technical Traders Ltd.

NOTICE: Our free research does not constitute a trade recommendation or solicitation for our readers to take any action regarding this research.  It is provided for educational purposes only.  Visit our web site (TheTechnicalTraders.com) to learn how to take advantage of our members-only research and trading signals.


The Analytical Overview of the Main Currency Pairs on 2020.08.27

by JustForex

The EUR/USD currency pair

Technical indicators of the currency pair:
  • Prev Open: 1.18333
  • Open: 1.18285
  • % chg. over the last day: -0.03
  • Day’s range: 1.18166 – 1.18498
  • 52 wk range: 1.0637 – 1.1967

Since the beginning of this week, the greenback has shown ambiguous results against its main competitors. The EUR/USD currency pair is being traded in a flat. Financial market participants are focused on today’s speech by the Fed Chairman. Today, Jerome Powell will speak at the annual Jackson Hole symposium. During his speech, he will talk about the revision of the monetary policy by the Fed. Trading activity and volatility may increase significantly. At the moment, the key range is 1.1785-1.1845. We recommend opening positions from these marks.

The news feed on 2020.08.27:
  • – Data on US GDP at 15:30 (GMT+3:00);
  • – Initial jobless claims in the US at 15:30 (GMT+3:00);
  • – Speech by the Fed Chairman at 16:10 (GMT+3:00);
  • – Pending home sales in the US at 17:00 (GMT+3:00).
EUR/USD

Indicators do not give accurate signals: the price has crossed the 50 MA and 100 MA.

The MACD histogram is near the 0 mark.

Stochastic Oscillator is in the neutral zone, the %K line has crossed the %D line. There are no signals at the moment.

Trading recommendations
  • Support levels: 1.1785, 1.1755
  • Resistance levels: 1.1845, 1.1885, 1.1920

If the price fixes above 1.1845, EUR/USD quotes are expected to grow. The movement is tending to 1.1885-1.1920.

An alternative may be a decline in the EUR/USD currency pair to 1.1755-1.1720.

The GBP/USD currency pair

Technical indicators of the currency pair:
  • Prev Open: 1.31429
  • Open: 1.31988
  • % chg. over the last day: +0.44
  • Day’s range: 1.31937 – 1.32295
  • 52 wk range: 1.1409 – 1.3516

The bullish sentiment prevails on the GBP/USD currency pair. The British pound has reached key extremes. At the moment, GBP/USD quotes are consolidating. Local support and resistance levels are 1.3185 and 1.3230, respectively. Investors expect a speech by the Fed Chairman. Further growth of the trading instrument is possible. Positions should be opened from key levels.

The news feed on the UK economy is calm.

GBP/USD

Indicators signal the power of buyers: the price has fixed above 50 MA and 100 MA.

The MACD histogram is in the positive zone, but below the signal line, which gives a weak signal to buy GBP/USD.

Stochastic Oscillator is in the neutral zone, the %K line is above the %D line, which indicates the bullish sentiment.

Trading recommendations
  • Support levels: 1.3185, 1.3160, 1.3115
  • Resistance levels: 1.3230, 1.3260

If the price fixes above 1.3230, GBP/USD quotes are expected to grow. The movement is tending to 1.3260-1.3300.

An alternative could be a decline in the GBP/USD currency pair to 1.3150-1.3120.

The USD/CAD currency pair

Technical indicators of the currency pair:
  • Prev Open: 1.31689
  • Open: 1.31413
  • % chg. over the last day: -0.22
  • Day’s range: 1.31361 – 1.31664
  • 52 wk range: 1.2949 – 1.4669

The technical pattern on the USD/CAD currency pair is still ambiguous. The loonie is still being traded in a flat with a quite wide range. At the moment, the local support and resistance levels are 1.3135 and 1.3165, respectively. The trading instrument is tending to decline. We recommend paying attention to the news feed on the US economy. Positions should be opened from key levels.

Important economic releases from Canada are not planned to be published.

USD/CAD

Indicators signal the power of sellers: the price has fixed below 50 MA and 100 MA.

The MACD histogram is in the negative zone, but above the signal line, which gives a weak signal to sell USD/CAD.

Stochastic Oscillator is in the neutral zone, the %K line is below the %D line, which indicates the bearish sentiment.

Trading recommendations
  • Support levels: 1.3135, 1.3100
  • Resistance levels: 1.3165, 1.3190, 1.3205

If the price fixes below 1.3135, USD/CAD sales should be considered. The movement is tending to 1.3100-1.3070.

An alternative could be the growth of the USD/CAD currency pair to 1.3190-1.3220.

The USD/JPY currency pair

Technical indicators of the currency pair:
  • Prev Open: 106.362
  • Open: 105.982
  • % chg. over the last day: -0.36
  • Day’s range: 105.803 – 106.076
  • 52 wk range: 101.19 – 112.41

The USD/JPY currency pair has moved away from local highs. At the moment, the trading instrument is consolidating. Local support and resistance levels are 105.80 and 106.15, respectively. Financial market participants expect a speech by the Fed Chairman. We also recommend paying attention to the dynamics of US government bonds yield. Positions should be opened from key levels.

The publication of important economic releases from Japan is not planned.

USD/JPY

Indicators do not give accurate signals: the price has crossed the 100 MA.

The MACD histogram is in the negative zone, but above the signal line, which gives a weak signal to sell USD/JPY.

Stochastic Oscillator is in the neutral zone, the %K line has crossed the %D line. There are no signals at the moment.

Trading recommendations
  • Support levels: 105.80, 105.45, 105.15
  • Resistance levels: 106.15, 106.40, 106.55

If the price fixes below 105.80, a further drop in USD/JPY quotes is expected. The movement is tending to 105.50-105.20.

An alternative could be the growth of the USD/JPY currency pair to 106.50-106.80.

by JustForex

Investors awaiting Fed’s Powell speech before making their next move

By Hussein Sayed, Chief Market Strategist (Gulf & MENA), ForexTime

Traders and investors across all asset classes are all ears to what the Federal Reserve Chair Jerome Powell has to say today at the annual Jackson Hole meeting. Inflation is the keyword and the policy framework to target it will determine whether we see more upside to risk assets in the months to come.

So far, we have only seen rising prices in asset classes such as stocks in particular, but throughout the past decade, the consumer price index has averaged around 1.5% so missing the Fed’s 2% inflation target. The FOMC’s dual mandate has been to maximise sustainable employment and keep prices stable and while they have been successful in the former (prior to the pandemic), they have failed miserably on consistently hitting their price target.

‘Average inflation targeting’ is the new formula expected to be endorsed by Powell today. It’s a policy framework that allows inflation to run above or below the 2% target, but given that inflation has been running below target for several years, the objective would be to allow price rises to overshoot for more extended periods before tightening policy.

However, the idea of allowing inflation to run above target for extended periods is hard to sell to politicians, so it will be interesting to see how Powell is likely to package the new policy framework.

The positive sentiment in US equities continued yesterday with the S&P 500 and Nasdaq hitting new record highs ahead of this week’s key risk event. It seems expectations may be too high as Powell will need to be overly dovish to meet these expectations. No one believes that he will disappoint the markets but given the scale of the latest rally in stocks, chances of a pullback are high before bulls resume their march higher.

Disclaimer: The content in this article comprises personal opinions and should not be construed as containing personal and/or other investment advice and/or an offer of and/or solicitation for any transactions in financial instruments and/or a guarantee and/or prediction of future performance. ForexTime (FXTM), its affiliates, agents, directors, officers or employees do not guarantee the accuracy, validity, timeliness or completeness, of any information or data made available and assume no liability as to any loss arising from any investment based on the same.


Forex-Time-LogoArticle by ForexTime

ForexTime Ltd (FXTM) is an award winning international online forex broker regulated by CySEC 185/12 www.forextime.com

The US Currency Is Still Moving in a Flat. The Speech by the Fed Chairman Is in the Spotlight

by JustForex

The US dollar continues to consolidate against a basket of currency majors. The US dollar index (#DX) closed yesterday’s trading with a slight decline (-0.02%). Investors have taken a wait-and-see attitude before today’s speech by the Fed Chairman Jerome Powell at Jackson Hole. Experts expect hints from the official that the regulator will adjust its approach to monetary policy. Powell is also expected to begin formulating a new strategy for the US Federal Reserve aimed at achieving stability and employment. Trading activity and volatility may increase significantly.

Investors will also assess a number of important statistics on the US economy. Relations between Washington and Beijing have worsened again. On Wednesday, China fired four ballistic missiles into the disputed South China Sea, while the United States imposed sanctions on 24 Chinese companies.

The “black gold” prices are consolidating. At the moment, futures for the WTI crude oil are testing the $43.30 mark per barrel.

Market indicators

Yesterday, there was the bullish sentiment in the US stock market: #SPY (+1.00%), #DIA (+0.29%), #QQQ (+2.13%).

The 10-year US government bonds yield is consolidating. At the moment, the indicator is at the level of 0.67-0.68%.

The news feed for 2020.08.27:
  • – Data on US GDP at 15:30 (GMT+3:00);
  • – Initial jobless claims in the US at 15:30 (GMT+3:00);
  • – Speech by the Fed Chairman at 16:10 (GMT+3:00);
  • – Pending home sales in the US at 17:00 (GMT+3:00).

by JustForex