In gold we trust: why bullion is still a safe haven in times of crisis

By Dirk Baur, University of Western Australia and Allan Trench, University of Western Australia

“Gold” said famed investor Warren Buffett in 1998, “gets dug out of the ground in Africa or someplace, then we melt it down, dig another hole, bury it again and pay people to stand around guarding it. It has no utility. Anyone watching from Mars would be scratching their head.”

Yet for all that, we remain in love with gold – especially in times of uncertainty.
With the COVID-19 crisis, interest in gold has soared, driving its price to historic highs (eclipsing its past record set back in August 2011).

Even Buffett seems to have softened his longstanding antipathy, with his company Berkshire Hathaway acquiring a US$565 million stake in the world’s second-largest gold miner, Canada’s Barrick Gold Corporation.

Owning shares in a gold-mining company, though, is not the same thing as owning actual gold. Since gold shares are linked both to gold prices and to the broader share market, they tend to move with the market when it falls sharply. That deprives gold shares of a key feature of gold bullion – its safe haven property.

What is a safe haven?

A safe haven is an asset that holds its value in extreme, unexpected events.

It is different from a “safe asset” that provides a guaranteed return, such as government bonds. In buying such a bond you effectively lend money to the government in return for a promise it will repay that money (with interest) in the future.

Safe assets, in other words, are “fixed income” assets, and their prices are relatively stable.

The price of a safe haven asset, on the other hand, will fluctuate, rising in periods of heightened uncertainty, when other investments suffer extreme losses, but may also fall when the uncertainty reverts to more normal levels.

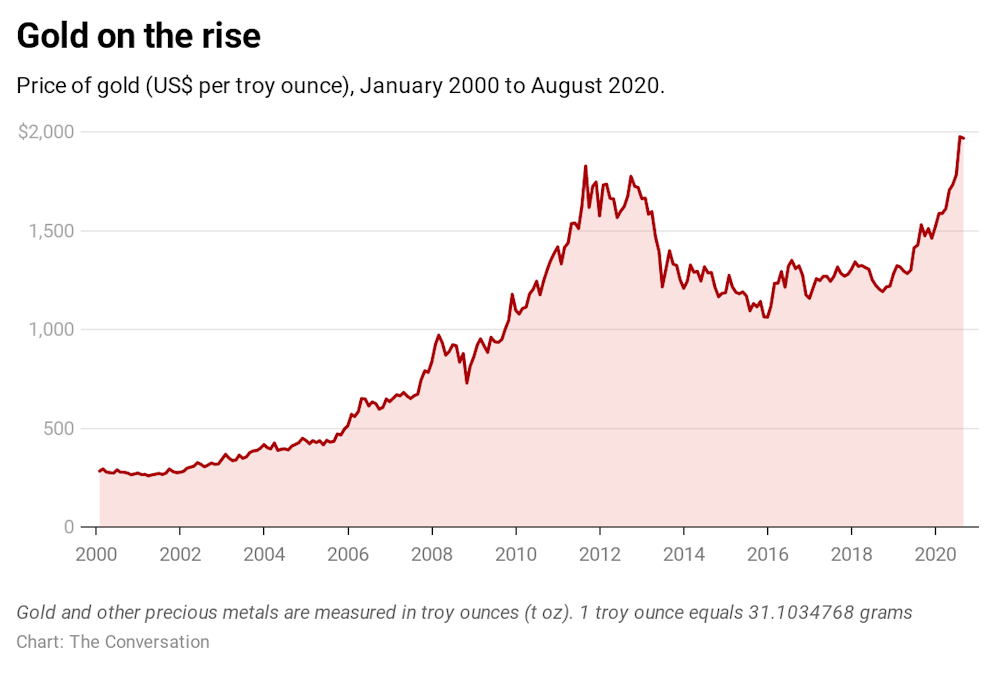
We can see this in the price of gold over the past two decades, both in the wake of the Global Financial Crisis beginning in 2008 and now with the COVID-19 crisis.

CC BY-SA

The only deviation from gold’s traditional role as a safe haven asset was a price fall over March, as global stock markets crashed. This deviation underlines the uncertainty that gripped investors that month, with some gold owners presumably selling bullion to cover losses or to increase cash holdings.


Why is gold a safe haven?

The simple answer is that it has worked in the past. Based on past experience in a crisis, people believe in the safe haven feature of gold and it works because they believe in it.

Gold has been used since ancient times as a store of value. Helping it achieve this status is its aesthetic appeal, malleability (with a relatively low melting point making it easy to produce coins or jewellery), virtual indestructibility (almost all the gold that has ever been found or mined is still around) and, most importantly, rarity. Though hundreds of thousands have dug and panned for it over history, the amount of gold mined has never been enough to devalue it.

Because of these features, gold became the basis for money and played a formal monetary role during the gold standard, which required nations to hold gold reserves as a backing of their currency.

Central banks still hold huge gold reserves. Of 197,576 tonnes of gold mined throughout history, the World Gold Council says 17.2% is held (as bullion or coins) by governments and central banks, 21.6% by private investors, about 47% as jewellery, and 14.2% has gone to other uses (such as in electronics).

So while gold, silver, palladium and platinum are all “precious metals” the latter three are not commonly accepted safe havens because they played a different monetary and investment role in the past.

‘Nobody understands gold prices’

Gold may also be a safe haven because it is simple and well-known, the first thing that comes to mind when investors are faced with extreme uncertainty.

This apparent simplicity, paradoxically, does not mean easy-to-understand gold prices.

Some factors influencing its price are tangible, such as physical supply and demand.

But many factors influencing gold’s price are less tangible, such as changing perceptions, preferences and market sentiment.

As then US Federal Reserve chairman Ben Bernanke said in 2013: “”Nobody understands gold prices, and I do not pretend to understand it either.”The Conversation

About the Author:

Dirk Baur, Professor of Finance, University of Western Australia and Allan Trench, Professor, University of Western Australia

This article is republished from The Conversation under a Creative Commons license. Read the original article.

 

Risk-on as Markets Await FOMC

By Lukman Otunuga, Research Analyst, ForexTime

Stock markets are powering higher this afternoon with the S&P500 opening up over 1% and endeavouring to break higher through its recent period of consolidation. The 50-day Moving Average has acted as good support over the last few sessions, while vaccine hopes and the earlier Chinese data have injected the markets with a strong bout of positivity.

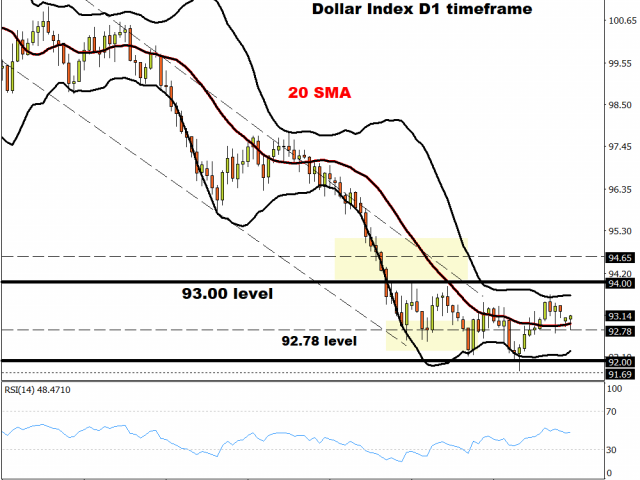
The Dollar has found intra-day support around 92.78 but bears are aiming to close below Thursday’s low last week at 92.70 to push any bulls out of the picture, which could then see the DXY roll over towards 92.00.

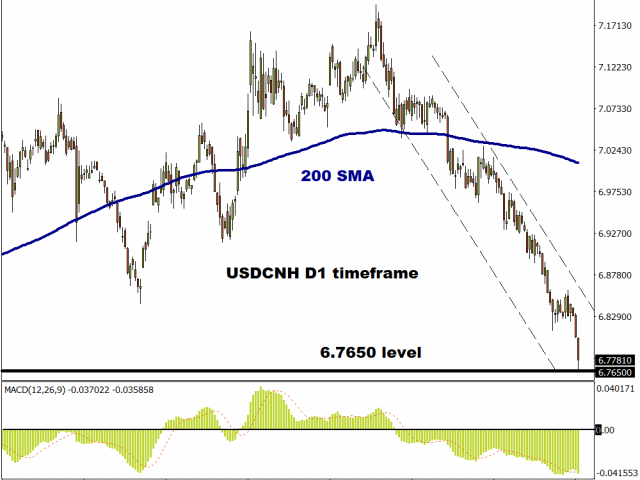
Interestingly, the Chinese Yuan has hit its highest level since May 2019, scything through the 200-day MA this morning as rising retail sales are now narrowing the gap in growth trajectories between the industrial and service sectors.

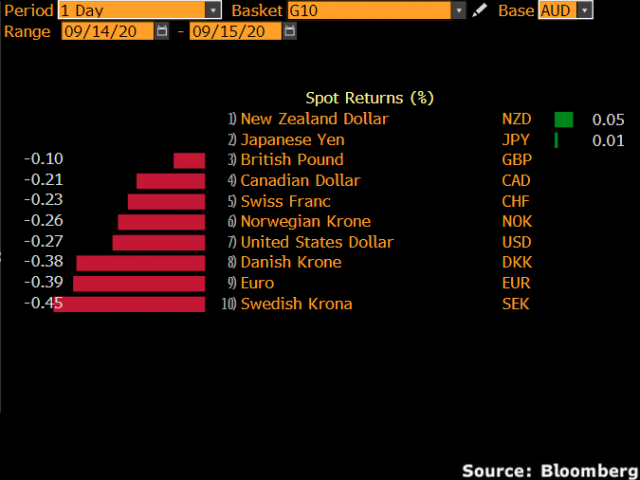
The Aussie is one of the leaders of the pack in the G10 space today getting a double boost from the China data as well as the RBA Minutes which did little to suggest there was more easing in the pipeline. GBP is following the broad market mood despite another round of weak jobs figures. Unemployment ticked up to 4.1% and jobless claims rose with concern about the end-of-furlough cliff edge approaching fast. The Bank of England estimates the jobless rate will climb to 7.5% by the end of the year.

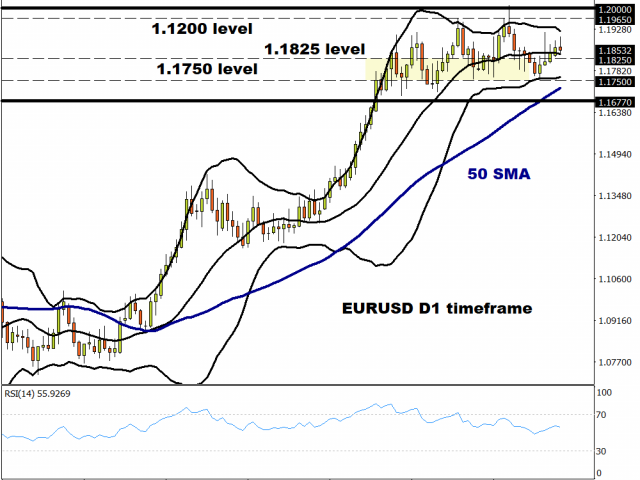
EUR grinding higher within the range

Recent comments by ECB officials regarding the strength of the currency seem to be holding back EUR gains today. The general risk-on theme has tended to see the single currency underperform as traders take more a liking to bidding up high-beta / commodity currencies. Better-than-expected German business survey data has not even helped that much but the broad anti-USD tone is, as markets look to tomorrow’s Fed meeting.

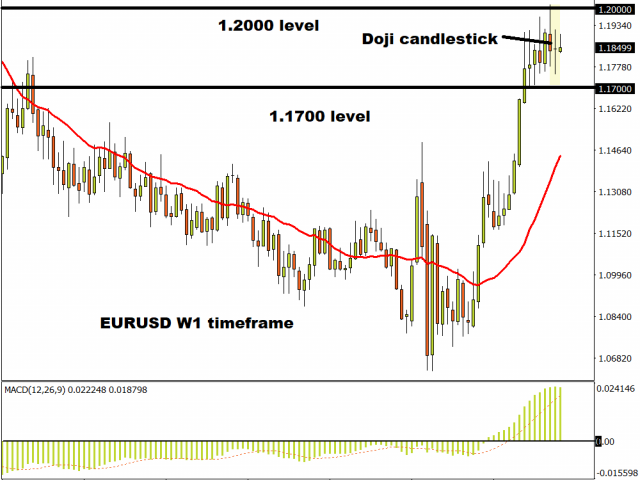
EUR/USD is still being supported by the bullish trendline from May, even if gains are slower than expected after the ECB meeting. Last week’s ‘doji’ candlestick shows some indecision in the ranks, but while activity data around the globe comes in positive, the cyclical rebound favours the Euro.

RBA has no easing bias

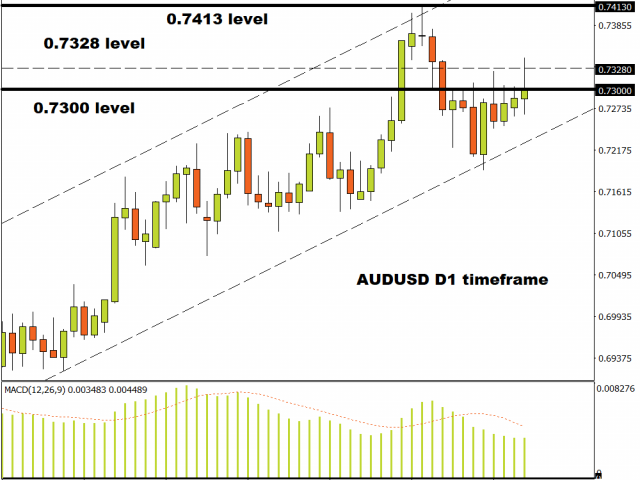
The Aussie jumped higher on the release of the RBA Minutes overnight pushing through 0.73 and previous short-term resistance. A close above 0.7328 will be keenly watched by the bulls who will then look to expose the key barrier at 0.7413, the two-year high posted on 1 September.

Disclaimer: The content in this article comprises personal opinions and should not be construed as containing personal and/or other investment advice and/or an offer of and/or solicitation for any transactions in financial instruments and/or a guarantee and/or prediction of future performance. ForexTime (FXTM), its affiliates, agents, directors, officers or employees do not guarantee the accuracy, validity, timeliness or completeness, of any information or data made available and assume no liability as to any loss arising from any investment based on the same.


Forex-Time-LogoArticle by ForexTime

ForexTime Ltd (FXTM) is an award winning international online forex broker regulated by CySEC 185/12 www.forextime.com

Mongolia cuts rate 3rd time in 2020 to support recovery

By CentralBankNews.info

Mongolia’s central bank cut its policy rate for the third time this year, saying this should help it meet its inflation target, ease the economic slowdown and support the economic recovery.

    The Central Bank of Mongolia (Mongolbank) lowered its policy rate by another 100 basis points to 8.0 percent and has now cut it 300 points this year following earlier cuts in March and April.
    The bank said in a statement from Sept. 14 the rate cut was aimed at increasing the amount of loans provided by the banking sector to the  real economy and reduce interest rates, reflecting the current state of the economy and financial markets, future prospects, and uncertainties and risk in the domestic and international environment.
     Mongolia’s inflation rate dropped to 2.1 percent in August from 3.4 percent in July but Mongolbank said it expects inflation to rise in coming months due to the comparison with last year though it will still remain around its current level and not exceed its target in coming years.
    Mongolbank targets inflation of 8 percent, plus/minus 2 percentage points, this year and 6 percent in the medium term.
     Mongolia’s economy contracted 9.7 percent year-on-year in the second quarter, up from a 10.7 percent fall in the first quarter, the sharpest decline in economic output in 20 years.
     However, the bank said monetary and fiscal stimulus, along with a recovery of the external environment, should help the economic downturn to subside in the second half of this year before returning to “normal” in 2021.
     “Global economic activity has been volatile since the second half of this year due to the COVID-19 pandemic but is expected to improve,” Mongolbank said, adding it would continue to support the liquidity of banks, households and businesses and take measures to prevent any disruption to credit in the banking system.
     On Aug. 7 the bank’s monetary policy committee decided at an unscheduled meeting to extend its measures to restructure and extend the maturity of consumer loans for lenders experiencing difficulties due to the current economic circumstances to the end of this year.
     Under its original decision from April, loans for some 76,000 borrowers have been amended covering consumer loans of 663 billion tughrik.

GB100 Analysis: Improving data bullish for GB100

By IFCMarkets.com

Improving data bullish for GB100

UK economic data in the last couple of weeks were not as bad as feared on balance. While trade surplus declined a bit more than expected in July, the declines in both industrial and manufacturing production were less than forecast. And the GDP growth was in line with expectations. Thus, the trade surplus declined to £1.1 billion in July from £3.9 when a decline to £1.2 billion was expected. And the industrial and manufacturing productions declined 7.8% and 9.4% over year in July when 8.7% and 10.8% drops where forecast. At the same time the UK economy grew by 6.6% in July 2020, the third consecutive monthly increase. Improving data are bullish for GB100.

IndicatorVALUESignal
RSINeutral
MACDBuy
Donchian ChannelBuy
MA(100)Sell
FractalsNeutral
Parabolic SARBuy


Summary of technical analysis

OrderBuy
Buy stopAbove 6081.11
Stop lossBelow 5780.24

Market Analysis provided by IFCMarkets.com

Dollar starts to weaken ahead of Fed meeting

By Orbex

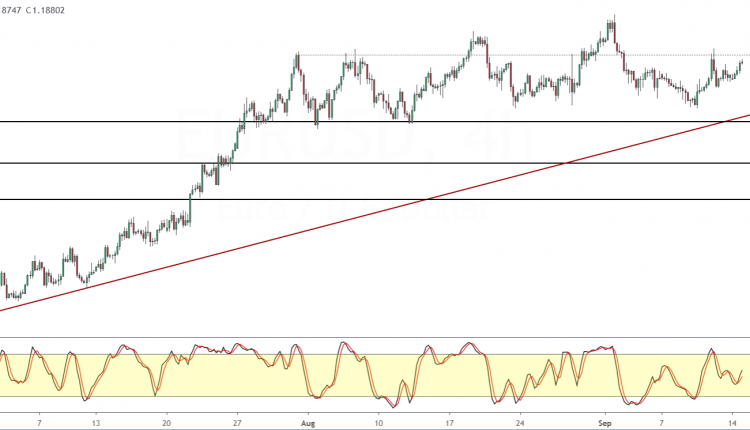
EURUSD Supported Above 1.1800

The euro currency has been trading higher for the most part since the markets opened on Monday.

Price action is on track, inching closer to Friday’s highs. But a close above 1.1900 could confirm further upside in prices.

To the downside, the euro is well supported above the 1.1800 handle.

Temporary support also resides near last week’s lower close of 1.1762.

For the moment, as EURUSD approaches the 1.1900 handle, it will be critical.

Further gains can come only if there is a strong close above this level.

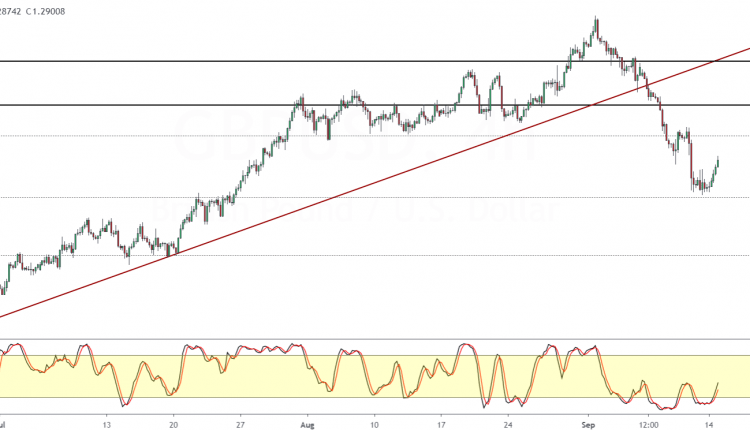
GBPUSD Pares Losses As Price Approaches 1.3000

The British pound sterling is holding a steady pace of gains since last week’s reversal, just near the 1.2800 handle.

With the current bullish momentum, price action could be reaching for the 1.3000 handle next.

But if resistance puts a lid on the gains, then we expect the cable to enter a sideways range within the said levels.

To the upside, a strong close above 1.3000 is required to confirm further gains.

The main key risk for the GBPUSD will be the data-heavy week alongside the BoE meeting later on Thursday.

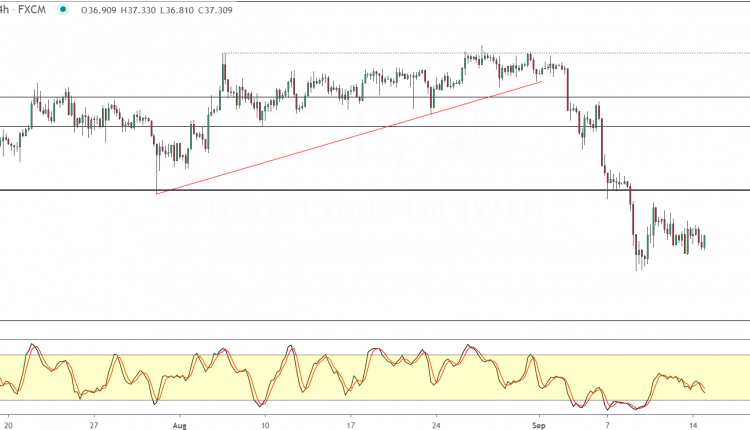
Crude Oil Consolidates Near 37.00

Oil prices are trading soft with price action attempting to pare losses from last week.

Still, prices are hovering near the 37.00 handle.

To the upside, the main resistance is seen at 38.83, while to the downside, last week’s lows near 36.44 forms the line in the sand.

A breakout from either of these two levels could trigger the gains or declines accordingly.

For the moment, a weaker USD is likely helping to keep oil prices supported to the upside.

However, we need to see stronger evidence of higher lows to confirm further gains in the commodity.

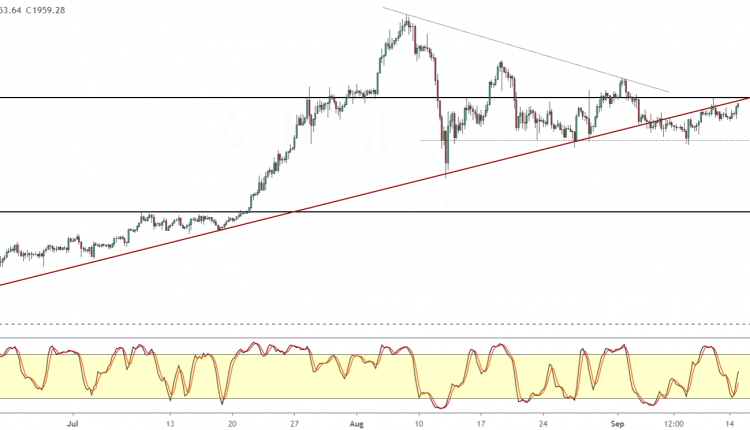
Gold Prices Back Near 1967 Resistance

The precious metal is trading stronger on Monday, with gains driven by a weaker USD and the Fed meeting.

Price action is a few points away from the 1967 level which held up as resistance earlier on.

A breakout above this level could give way to further gains, with the next challenge near the 2000 handle.

To the downside, prices are well supported near the 1911.50 region.

The confluence of the trend line and the horizontal resistance could, however, pose a challenge for gold prices in the short term.

By Orbex


Ichimoku Cloud Analysis 15.09.2020 (USDJPY, USDCHF, XAUUSD)

Article By RoboForex.com

USDJPY, “US Dollar vs Japanese Yen”

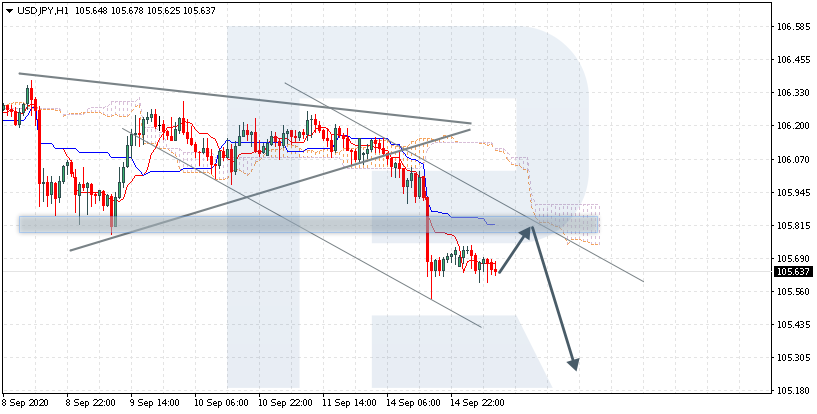
USDJPY is trading at 105.63; the instrument is moving below Ichimoku Cloud, thus indicating a descending tendency. The markets could indicate that the price may test Tenkan-Sen and Kijun-Sen at 105.75 and then resume moving downwards to reach 105.25. Another signal in favor of further downtrend will be a rebound from the descending channel’s upside border. However, the bearish scenario may no longer be valid if the price breaks the cloud’s upside border and fixes above 106.05. In this case, the pair may continue growing towards 107.15.

USDJPY
Risk Warning: the result of previous trading operations do not guarantee the same results in the future

USDCHF, “US Dollar vs Swiss Franc”

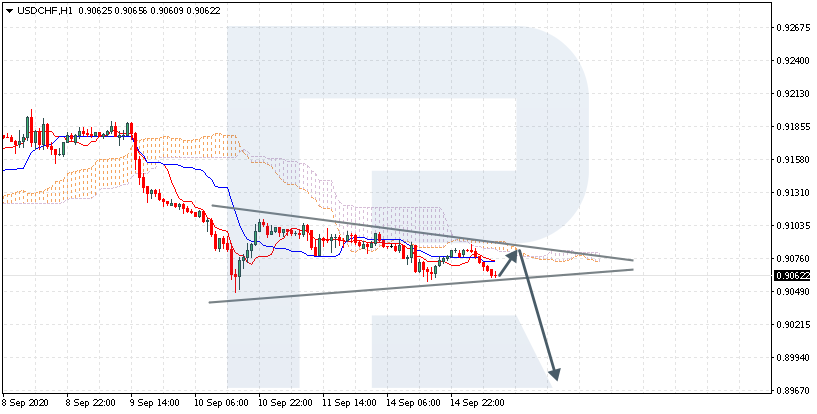
USDCHF is trading at 0.9062; the instrument is moving below Ichimoku Cloud, thus indicating a descending tendency. The markets could indicate that the price may test the cloud’s upside border at 0.9080 and then resume moving downwards to reach 0.8985. Another signal in favor of further downtrend will be a rebound from the upside border of the Triangle pattern. However, the bearish scenario may no longer be valid if the price breaks the cloud’s upside border and fixes above 0.9105. In this case, the pair may continue growing towards 0.9210. To confirm further decline, the asset must break the downside border of the Triangle pattern and fix below 0.9020.

USDCHF
Risk Warning: the result of previous trading operations do not guarantee the same results in the future

XAUUSD, “Gold vs US Dollar”

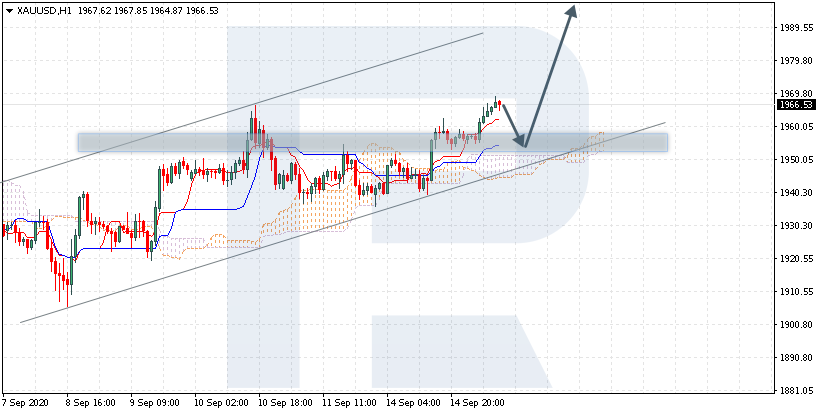
XAUUSD is trading at 1966.00; the instrument is moving above Ichimoku Cloud, thus indicating an ascending tendency. The markets could indicate that the price may test Tenkan-Sen and Kijun-Sen at 1955.00 and then resume moving upwards to reach 2005.00. Another signal in favor of further uptrend will be a rebound from the rising channel’s downside border. However, the bullish scenario may no longer be valid if the price breaks the cloud’s downside border and fixes below 1935.00. In this case, the pair may continue falling towards 1910.00.

XAUUSD

Article By RoboForex.com

Attention!
Forecasts presented in this section only reflect the author’s private opinion and should not be considered as guidance for trading. RoboForex LP bears no responsibility for trading results based on trading recommendations described in these analytical reviews.

Murrey Math Lines 15.09.2020 (AUDUSD, NZDUSD)

Article By RoboForex.com

AUDUSD, “Australian Dollar vs US Dollar”

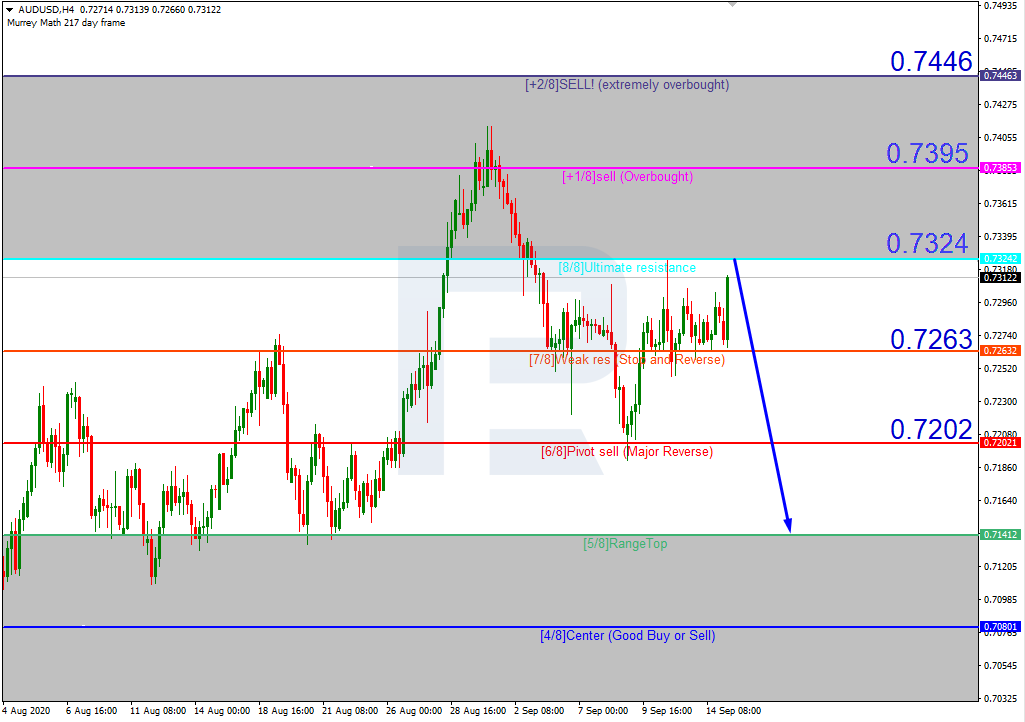
As we can see in the H4 chart, AUDUSD is moving not far from the “overbought area”. In this case, the pair is expected to rebound from 8/8 and resume falling to reach the support at 5/8. However, this scenario may be canceled if the price breaks 8/8 to the upside. After that, the instrument may continue growing towards the resistance at +1/8.

AUDUSD_H4
Risk Warning: the result of previous trading operations do not guarantee the same results in the future

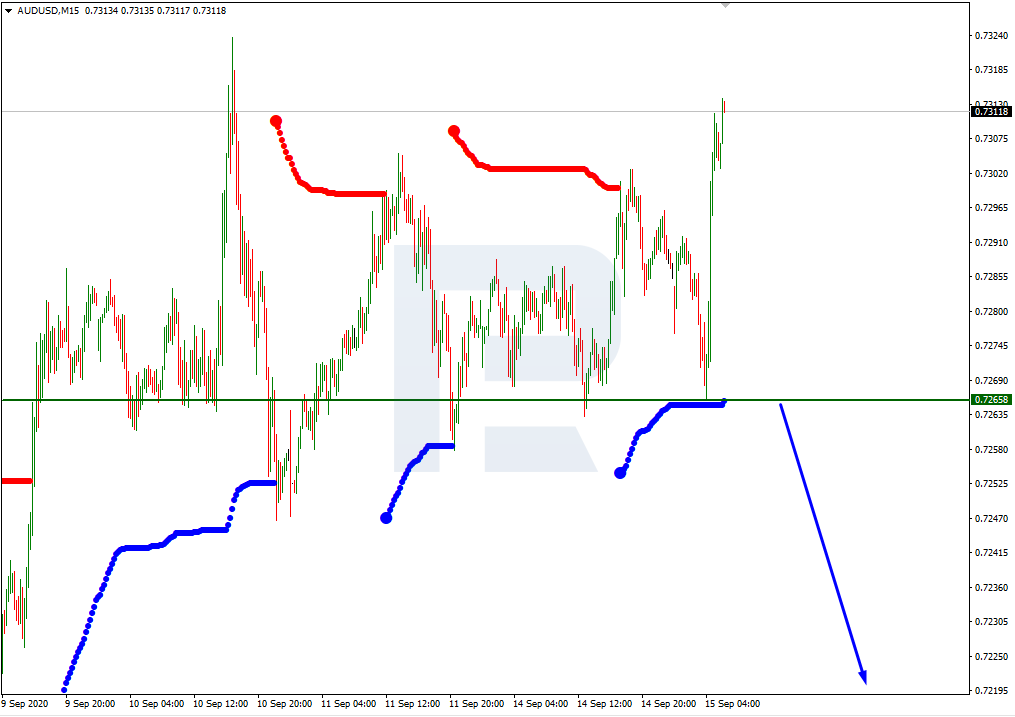
In the M15 chart, the pair may break the downside line of the VoltyChannel indicator and, as a result, continue trading downwards.

AUDUSD_M15
Risk Warning: the result of previous trading operations do not guarantee the same results in the future

NZDUSD, “New Zealand Dollar vs US Dollar”

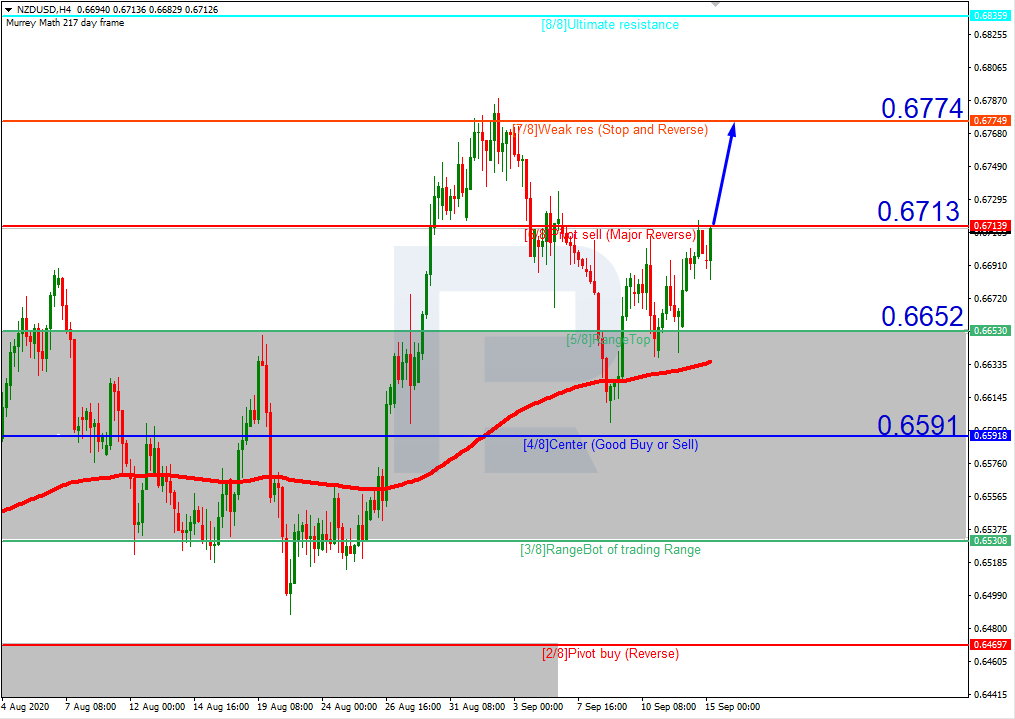
In the H4 chart, after rebounding from 5/8, NZDUSD is expected to continue trading upwards to reach the resistance at 7/8. However, this scenario may no longer be valid if the price breaks 5/8 to the downside. After that, the instrument may continue falling towards the support at 4/8.

NZDUSD_H4
Risk Warning: the result of previous trading operations do not guarantee the same results in the future

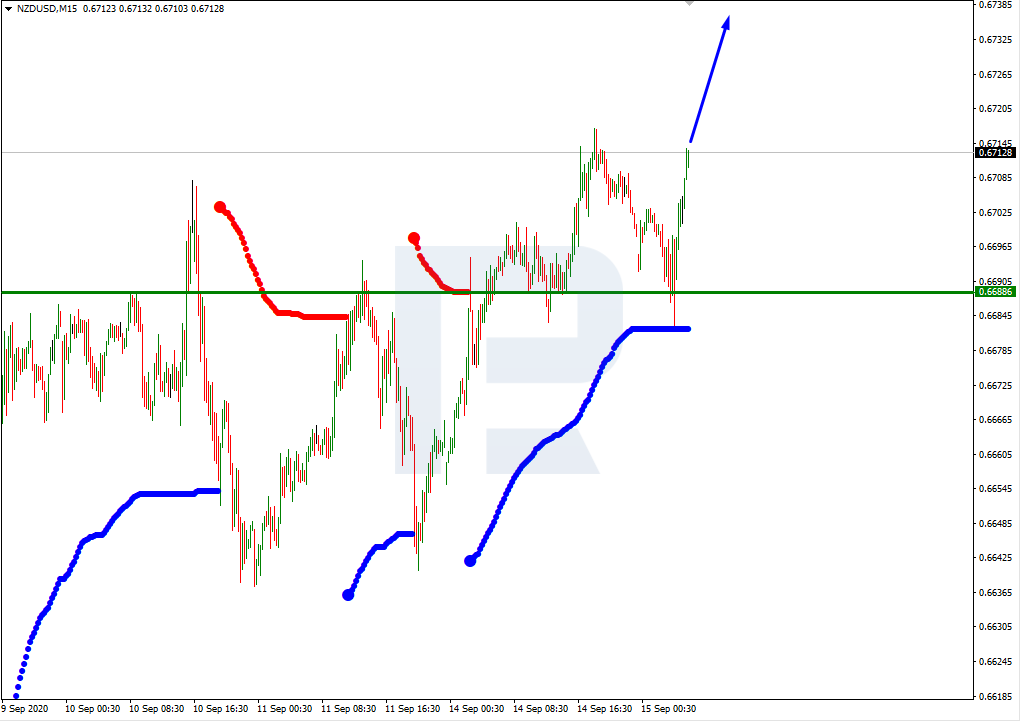
As we can see in the M15 chart, the pair has broken the upside line of the VoltyChannel indicator and, as a result, may continue moving upwards to reach 7/8 from the H4 chart.

NZDUSD_M15

Article By RoboForex.com

Attention!
Forecasts presented in this section only reflect the author’s private opinion and should not be considered as guidance for trading. RoboForex LP bears no responsibility for trading results based on trading recommendations described in these analytical reviews.

The Analytical Overview of the Main Currency Pairs on 2020.09.15

by JustForex

The EUR/USD currency pair

Technical indicators of the currency pair:
  • Prev Open: 1.18356
  • Open: 1.18604
  • % chg. over the last day: +0.23
  • Day’s range: 1.18843 – 1.18995
  • 52 wk range: 1.0637 – 1.2012

The EUR/USD currency pair has been growing during yesterday’s and today’s trades. Demand for the US currency has declined amid growing interest for risk following positive news about a potential COVID-19 vaccine. AstraZeneca has resumed its latest vaccine trials. However, investors will be cautious before the Fed meeting. At the moment, the key support is the level of 1.1870, the key resistance level is 1.1900. We recommend opening positions from these levels.

The news feed on 2020.09.15:
  • – German ZEW economic sentiment index at 12:00 (GMT+3:00).
EUR/USD

Indicators point to the power of buyers: the price has fixed above 50 MA and 100 MA.

The MACD histogram is in the positive zone and above the signal line, which also gives a signal to buy EUR/USD.

Stochastic Oscillator is in the overbought zone, the %K line is below the %D line, which gives a weak signal to sell EUR/USD.

Trading recommendations
  • Support levels: 1.1870, 1.1835, 1.1800
  • Resistance levels: 1.1900, 1.1935

If the price fixes above the round level of 1.1900, further growth of EUR/USD quotes is expected. The movement is tending to the level of 1.1935-1.1950.

An alternative could be the decline in the EUR/USD currency pair to 1.1835-1.1800.

The GBP/USD currency pair

Technical indicators of the currency pair:
  • Prev Open: 1.27753
  • Open: 1.28241
  • % chg. over the last day: +0.28
  • Day’s range: 1.28440 – 1.28635
  • 52 wk range: 1.1409 – 1.3516

During yesterday’s trading session, GBP/USD quotes have increased slightly. Today, investors expect the publication of data on the UK labor market. Vote on the Brexit bill, which could violate all EU agreements, is also in the spotlight. At the moment, the key support and resistance levels are 1.2815 and 1.2880, respectively. Positions should be opened from these levels.

The news feed on the UK economy for 2020.09.15:
  • – Average earnings index including + Bonus at 09:00 (GMT+3:00);
  • – Claimant count change at 09:00 (GMT+3:00).
GBP/USD

Indicators do not give accurate signals: the price is being traded between 50 MA and 100 MA.

The MACD histogram is near the 0 mark.

Stochastic Oscillator is in the overbought zone, the %K line has crossed the %D line. There are no signals at the moment.

Trading recommendations
  • Support levels: 1.2815, 1.2750
  • Resistance levels: 1.2880, 1.2940, 1.3000

If the price fixes above the round level of 1.2880, GBP/USD quotes are expected to grow. The movement is tending to 1.2940-1.2950.

If the price fixes below the key support level of 1.2815, GBP/USD quotes are expected to decline to 1.2750-1.2730.

The USD/CAD currency pair

Technical indicators of the currency pair:
  • Prev Open: 1.31779
  • Open: 1.31737
  • % chg. over the last day: -0.06
  • Day’s range: 1.31459 – 1.31621
  • 52 wk range: 1.2949 – 1.4669

The USD/CAD currency pair is being traded without significant changes. There is no defined trend. Investors expect additional drivers. At the moment, the key support and resistance levels are 1.3150 and 1.3190, respectively. We recommend paying attention to the dynamics of “black gold” prices. Positions should be opened from key support and resistance levels.

Today, the news feed in Canada is calm.

USD/CAD

Indicators point to the bearish sentiment: the price is being traded below 50 MA and 100 MA.

The MACD histogram is in the negative zone, which gives a signal to sell USD/CAD.

Stochastic Oscillator is in the neutral zone, the %K line is above the %D line, which gives a signal to buy USD/CAD.

Trading recommendations
  • Support levels: 1.3140, 1.3100, 1.3060
  • Resistance levels: 1.3180, 1.3220, 1.3260

If the price fixes below 1.3140, USD/CAD quotes are expected to decline. The movement is tending to 1.3100-1.3080.

An alternative could be the growth of the USD/CAD currency pair to 1.3220-1.3250.

The USD/JPY currency pair

Technical indicators of the currency pair:
  • Prev Open: 106.066
  • Open: 105.697
  • % chg. over the last day: -0.41
  • Day’s range: 105.731 – 105.747
  • 52 wk range: 101.19 – 112.41

During yesterday’s trading session, the USD/JPY currency pair dropped sharply amid growing interest for risky assets. The drop in quotes has exceeded 60 quotes. At the moment, local support and resistance levels are 105.65 and 105.90, respectively. A further decline in the trading instrument is possible. Positions should be opened from key support and resistance levels.

The publication of important economic news from Japan is not expected today.

USD/JPY

Indicators point to the power of sellers: the price is being traded below 50 MA and 100 MA.

The MACD histogram is in the negative zone, but above the signal line, which also gives a weak signal to sell USD/JPY.

Stochastic Oscillator is near the overbought zone, the %K line is above the %D line, which gives a weak signal to buy USD/JPY.

Trading recommendations
  • Support levels: 105.65, 105.35
  • Resistance levels: 105.90, 106.15, 106.45

If the price fixes below 105.65, a further decline in USD/JPY quotes is expected. The movement is tending to 105.35-105.10.

An alternative could be the correction of the USD/JPY currency pair to 106.15-106.30.

by JustForex


This article reflects a personal opinion and should not be interpreted as an investment advice, and/or offer, and/or a persistent request for carrying out financial transactions, and/or a guarantee, and/or a forecast of future events.

Dollar slips as market mood improves

By Lukman Otunuga, Research Analyst, ForexTime

The not so mighty Dollar remains on the back foot early this morning thanks to fresh hopes around a coronavirus vaccine, encouraging data from China and weakness in U.S Treasury yields.

It is starting to feel like any vaccine news is good news for investors and this euphoria continues to reflected across global stocks, currency and commodity markets! A major breakthrough in the fight against COVID-19 that produces a cure could inject global markets with a potent dosage of positivity while elevating investor confidence to a new level. Such a development could see the tired Dollar crumble across the board as market players rush to riskier assets at the expense of safe-havens.

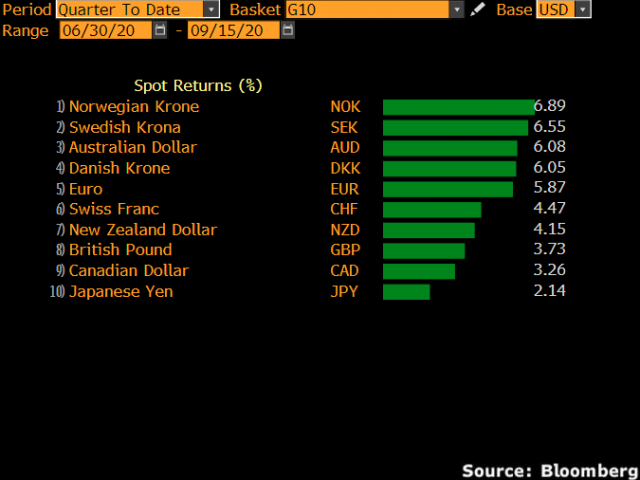
The past few months have been rough for the Greenback. It has depreciated against every single G10 currency since the start of Q3.

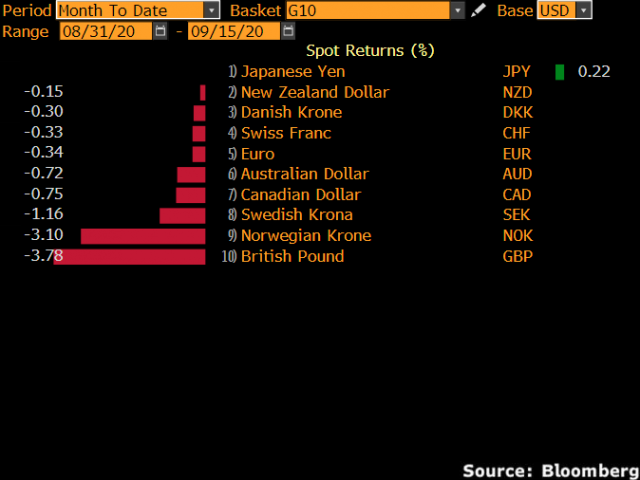
Although the Dollar’s performance in September thus far has offered some hope to bulls, this could be a technical rebound before bears jump back into the driver’s seat in Q4.

Fundamentally, the Greenback remains pressured by rising coronavirus cases in the United States, repeated rate cuts from the Fed which have eroded differentials between the US and other developed economies and risk of inflation surpassing 2% next year. However, given the Dollar’s safe-haven status and title and world’s reserve currency, it will be interesting to how low the currency falls before a bottom is formed.

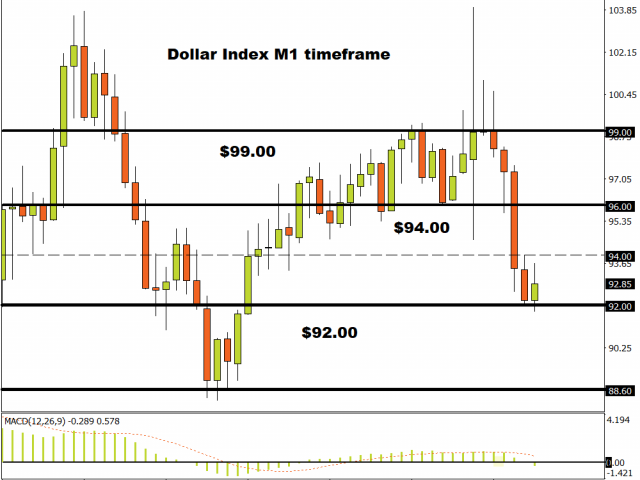
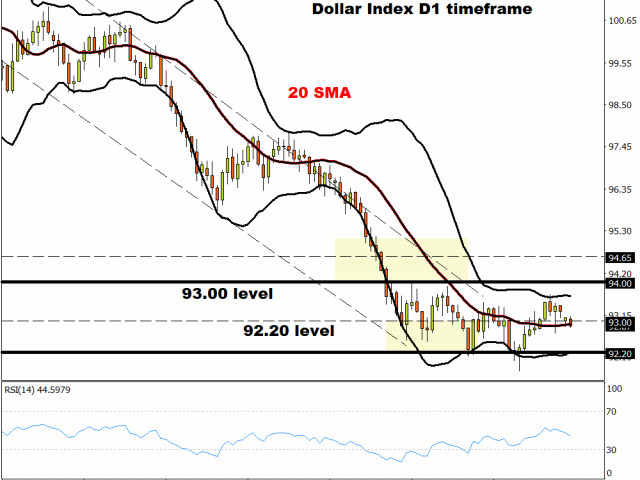
Looking at the charts, the Dollar Index is turning increasingly bearish on the monthly with a breakdown below 92.00 opening a path towards 88.60.

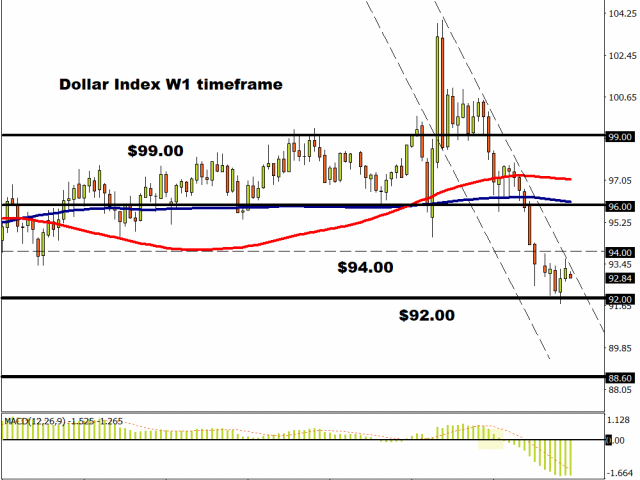
We see a similar theme on the weekly charts with prices respecting a bearish channel. The consistently lower lows and lows highs reconfirm the trend, while lagging indicators such as the MACD and moving averages reinforce the bearish setup.

Zooming into the daily, support can be found around 92.20 while there is resistance at 94.00. A breakout/down setup could be in play with 93.00 acting as pivotal level. Weakness below 93.00 may trigger a drop towards 92.20. If 92.20 is breach, the next key level of interest will be found around 91.70.

Disclaimer: The content in this article comprises personal opinions and should not be construed as containing personal and/or other investment advice and/or an offer of and/or solicitation for any transactions in financial instruments and/or a guarantee and/or prediction of future performance. ForexTime (FXTM), its affiliates, agents, directors, officers or employees do not guarantee the accuracy, validity, timeliness or completeness, of any information or data made available and assume no liability as to any loss arising from any investment based on the same.


Forex-Time-LogoArticle by ForexTime

ForexTime Ltd (FXTM) is an award winning international online forex broker regulated by CySEC 185/12 www.forextime.com

Demand for Risky Assets Has Been Increased due to the Resumption of COVID-19 Vaccine Trials

by JustForex

The US currency is declining against a basket of currency majors. The US dollar index closed in the red zone (-0.44%) yesterday. News that AstraZeneca has resumed clinical trials of a COVID-19 vaccine after the suspension has boosted demand for risky assets. At the same time, Pfizer and BioNTech SE have offered to extend the trial phase of their vaccine to 44,000 volunteers.

Also, the demand for the US dollar has been declined before the Fed meeting. On September 15-16, a Fed meeting will take place, during which it is assumed that the American Central Bank will keep a “dovish” attitude since the US economy still needs support. The key interest rate is expected to remain unchanged at 0.25% per annum.

The British pound is still under pressure after the EU last week called on the UK to urgently abandon its intentions to violate the terms of the agreement to leave the bloc. However, yesterday British Prime Minister Boris Johnson criticized the EU’s actions, having received preliminary approval from Parliament for a plan to violate the agreement on Britain’s exit from the bloc. Johnson said it was necessary because the EU did not want to compromise in trade negotiations.

Today, during the Asian trading session, quite optimistic data from China have been published. Thus, fixed asset investments (y/y) decreased by 0.3% in August, while experts forecasted a decline by 0.4%; industrial production (y/y) grew by 5.6% in August instead of 5.1%.

The “black gold” prices are falling due to reduced demand. At the moment, futures for the WTI crude oil are testing the $37.65 mark per barrel. At 23:30 (GMT+3:00), API weekly crude oil stock will be published.

Market indicators

Yesterday, there was the bullish sentiment in the US stock market: #SPY (+1.32%), #DIA (+1.24%), #QQQ (+1.74%).

The 10-year US government bonds yield is consolidating. The indicator has reached 0.67-0.68%.

The news feed for 2020.09.15:
  • – UK labor market data at 09:00 (GMT+3:00);
  • – German ZEW economic sentiment index at 12:00 (GMT+3:00).

by JustForex


This article reflects a personal opinion and should not be interpreted as an investment advice, and/or offer, and/or a persistent request for carrying out financial transactions, and/or a guarantee, and/or a forecast of future events.