Gloomy start to the trading week

By Han Tan, Market Analyst,ForexTime

Stock markets are tumbling around the world today with the sharp rises in coronavirus cases signalling fears of new and extended local and national lockdowns. S&P 500 futures are marked down nearly 1.7% while European bourses have fallen over 3% on the day so far. This risk-off mood has given safe haven currencies a bid with the Yen and Dollar leading the G10 charts.

The likely halt in US fiscal support until after the election in November is adding more fuel to the equity fire, but it is the slowing pace of recovery over the next several quarters in most major economies which is grabbing traders attention. With this comes the prospect of near-zero or even negative interest rates for an extended period of time, as highlighted last week by both the Fed and the Bank of England.

This has hurt bank stocks this morning, especially after the publication by several media outlets alleging suspicious transfers worth more than $2trillion. The European banking sector is having its worst session in six months with HSBC touching level not seen in London for 20 years. Scandals always have a habit of coming out when fear is growing more intense.

Yen, the go-to haven currency

The surge in infection numbers is eroding confidence in economic performance in quick time. Second-round shutdowns plus US election risk mean traders are flocking to the hedge of choice in these uncertain times. Negative real US yields can only help USD/JPY as well, as when rates head lower, bond prices rise which hurts the Dollar and puts pressure on the pair.

USD/JPY is on course for six straight days of declines and has taken out the July low around 104.18. Oversold conditions suggest a sustained decline below here is unlikely, but bears will be keen to test the next level of support at 103.80. Only a break of 105.20 would show that the negative phase has run its course.


Sterling awaiting more Brexit headlines

Stricter lockdowns across the UK, including in London, cast a shadow over any GBP gains. The market continues to await plans on further furlough payments in October, while there has been little new on the Brexit front over the weekend with the Internal Market Bill due to get saddled with amendments and delays in both Houses.

The 55-day Moving Average has capped the upside in GBP/USD over the last few days with resistance just above 1.30. Expect some consolidation around 1.28-1.31, with very strong support at 1.2728 where the long-term Moving Averages reside.


Disclaimer: The content in this article comprises personal opinions and should not be construed as containing personal and/or other investment advice and/or an offer of and/or solicitation for any transactions in financial instruments and/or a guarantee and/or prediction of future performance. ForexTime (FXTM), its affiliates, agents, directors, officers or employees do not guarantee the accuracy, validity, timeliness or completeness, of any information or data made available and assume no liability as to any loss arising from any investment based on the same.


Forex-Time-LogoArticle by ForexTime

ForexTime Ltd (FXTM) is an award winning international online forex broker regulated by CySEC 185/12 www.forextime.com


UK banks to ditch clients across Europe

By George Prior

UK banks are “outrageously failing” many tens of thousands of clients across Europe as they plot to shut their accounts and cancel credit cards within weeks due to post-Brexit rules.

This is the damning assessment of Nigel Green, the CEO and founder of deVere Group, one of the world’s largest financial advisory and fintech organizations, as most of Britain’s biggest banks send letters to customers in the EU warning them that all services are to be scrapped unless they have a UK address.

Mr Green says: “Most of the UK’s main street banks are plotting to unceremoniously abandon their customers across Europe within weeks.

“Accounts will be shut and debit and credit cards voided – regardless of how much or how little you have in those accounts or how long you have been a client – as it becomes illegal for UK banks to service British customers living in the EU without applying for new banking licences.”

He continues: “Once again, traditional banks are outrageously failing their clients who now need to take urgent steps to continue to be able to access, use, and manage their money.

“The move by these banks will be a major inconvenience to many tens of thousands of Brits living in the EU.”

Before post-Brexit rules come into effect, those affected are being urged to find alternatives to avoid potentially serious financial disruption.

“I would urge expats to now seek a financial services provider that already operates under pan-European rules,” says the deVere Group CEO.

In 2017 the firm launched deVere Vault.  deVere Vault provides borderless global services with a ground-breaking e-money app and a single card, multi currency service designed with those with an international lifestyle in mind.

“You’re able to open a deVere Vault account in around five minutes, withdraw money from any cash machine worldwide, get real-time notifications with all your transactions, spend money on the card wherever Mastercard is accepted, and send and receive money in most major currencies,” notes Mr Green.

He concludes: “deVere Vault meets a growing need in an increasingly globalised world for our clients to have borderless access to and use of their money.

“Agile, tech-driven challenger banks and fintech firms are ready to fill the void left by traditional banks who are now having to routinely ditch their customers.”

About:

deVere Group is one of the world’s largest independent advisors of specialist global financial solutions to international, local mass affluent, and high-net-worth clients.  It has a network of more than 70 offices across the world, over 80,000 clients and $12bn under advisement.

Fibonacci Retracements Analysis 21.09.2020 (GOLD, USDCHF)

Article By RoboForex.com

XAUUSD, “Gold vs US Dollar”

As we can see in the H4 chart, XAUUSD is still correcting within the Triangle pattern around 23.6% fibo after the divergence. In this case, the pair has equal chances of breaking the pattern both upwards and downwards. If the price starts a new descending wave, the targets will be 38.2% and 50.0% fibo at 1836.50 and 1763.30 respectively. However, if the pair breaks the pattern to the upside, the instrument may form a new ascending impulse to reach the resistance at the high at 2074.75.

GOLD_H4
Risk Warning: the result of previous trading operations do not guarantee the same results in the future

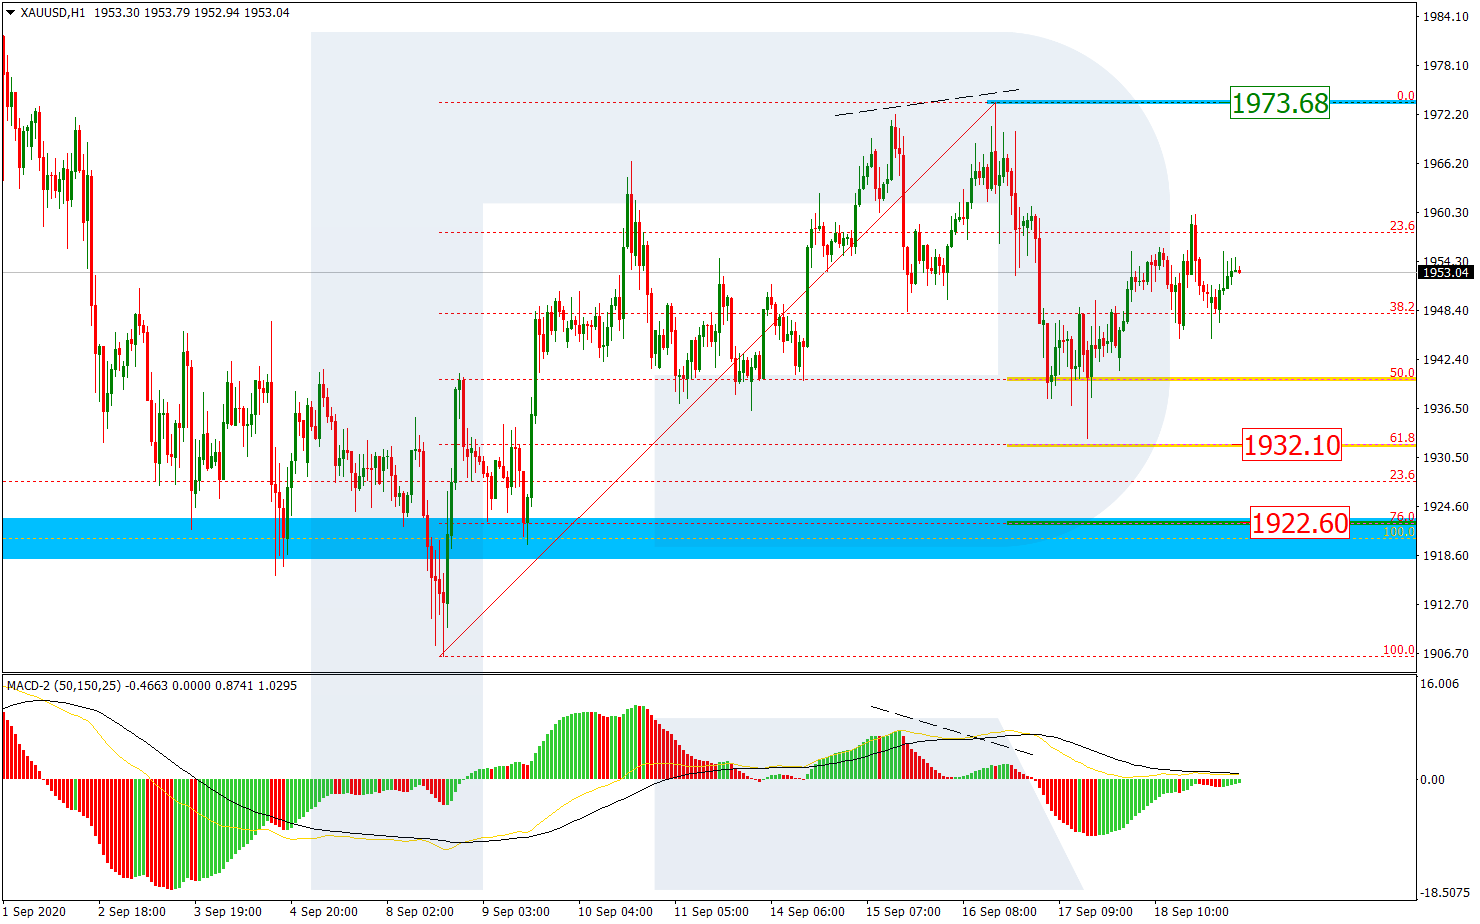
In the H1 chart, the local divergence made XAUUSD fall to reach 61.8% fibo at 1932.10. At the moment, the pair is trying to resume trading upwards to reach the local high at 1973.68 but one shouldn’t exclude a possibility of another descending wave, which may be heading towards 76.0% fibo at 1922.60.

GOLD_H1
Risk Warning: the result of previous trading operations do not guarantee the same results in the future

USDCHF, “US Dollar vs Swiss Franc”

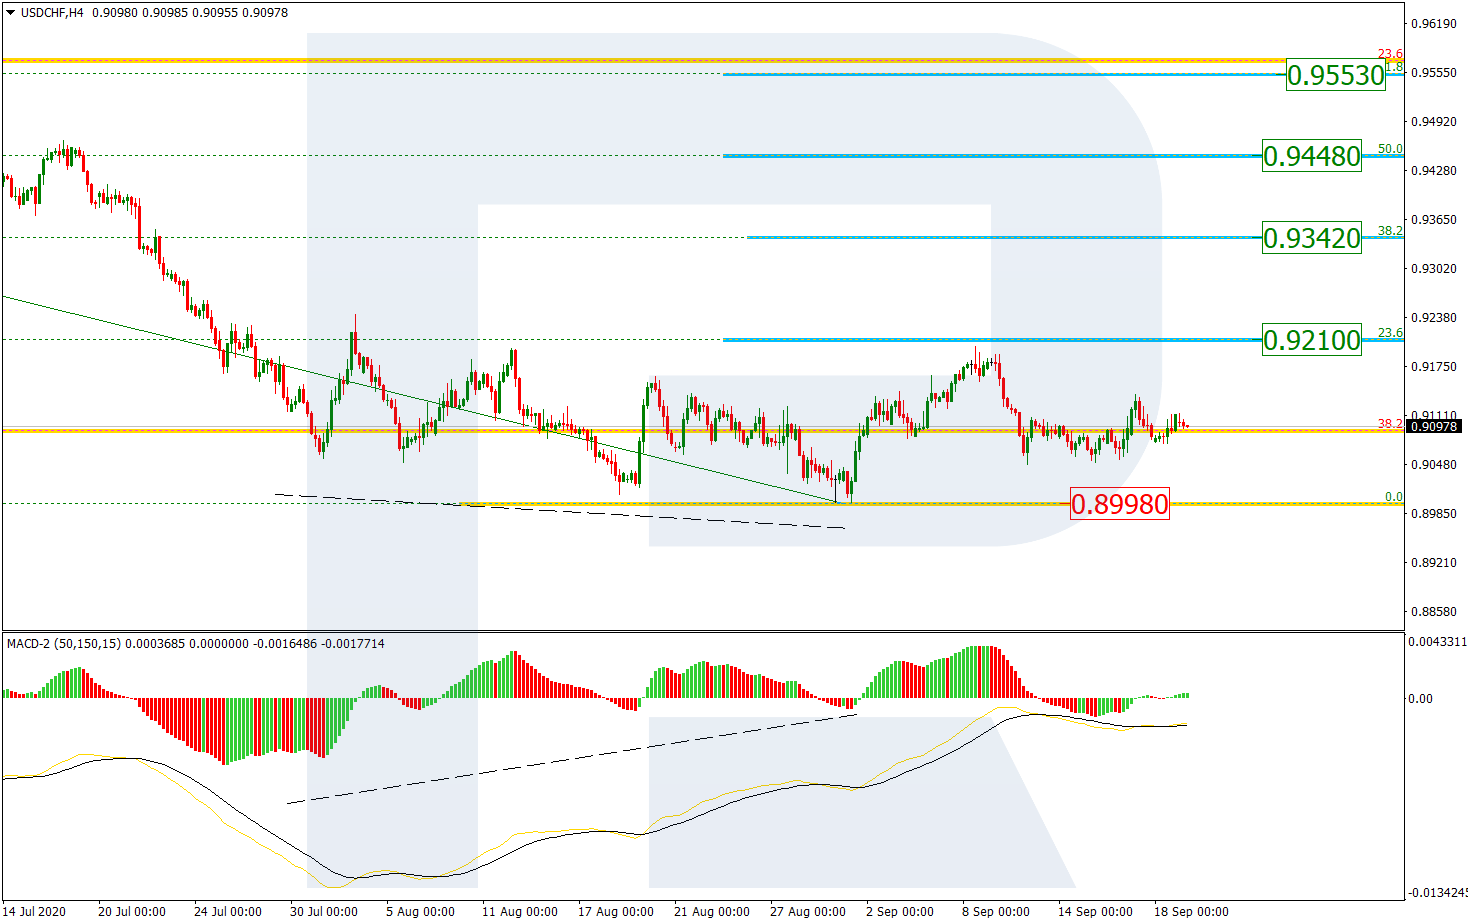
As we can see in the H4 chart, the convergence made USDCHF complete the descending wave at the long-term 38.2% fibo and start a new correction to the upside, which has already reached 23.6% fibo at 0.9210 and may later continue moving towards 38.2%, 50.0%, and 61.8% fibo at 0.9342, 0.9448, and 0.9553 respectively. After finishing the correction, the instrument may resume falling to break the support at 0.8998 and then reach the long-term 50.0% fibo at 0.8706.

USDCHF_H4
Risk Warning: the result of previous trading operations do not guarantee the same results in the future

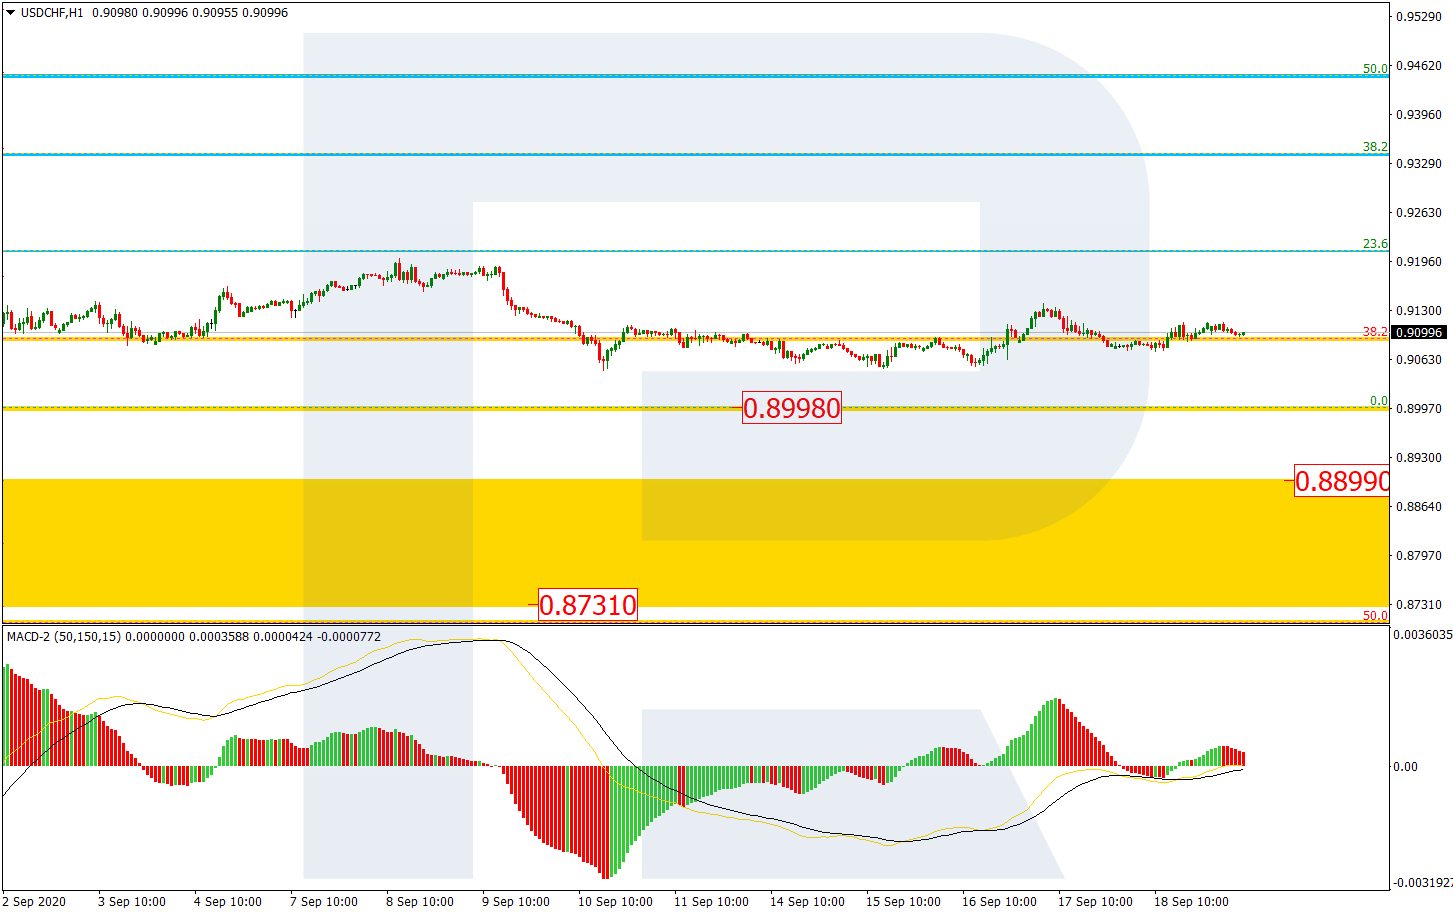
In the H1 chart, the asset is consolidating. Possibly, the price may break the low at 0.8998 and then continue falling towards the post-correctional extension area between 138.2% and 161.8% fibo at 0.8899 and 0.8731 respectively.

USDCHF_H1

Article By RoboForex.com

Attention!
Forecasts presented in this section only reflect the author’s private opinion and should not be considered as guidance for trading. RoboForex LP bears no responsibility for trading results based on trading recommendations described in these analytical reviews.

Platinum And Palladium Set To Surge As Gold Breaks Higher

By TheTechnicalTraders 

– RESEARCH HIGHLIGHTS:

  • Gold will target the $2,250 level before stalling and attempting another upside price rally targeting $2,500 or higher.
  • Silver will target the $33 price level when the current upside move builds enough momentum, then target $38 or higher.
  • Our next upside price target for platinum is $1,410, representing a +52.4% upside price target.
  • Palladium bottom in March 2020 was near $1,357. We expect a new upside price target for Palladium near $3,663 once it has broken out past current resistance levels.

If you have been following my research for a while, you are already aware of past research posts suggesting Gold and Silver will advance in multiple upside price legs over the next 90+ days. Gold will target the $2,250 level before stalling and attempting another upside price rally targeting $2,500 or higher.  Silver will target the $33 price level when the current upside move builds enough momentum, then target $38 or higher.

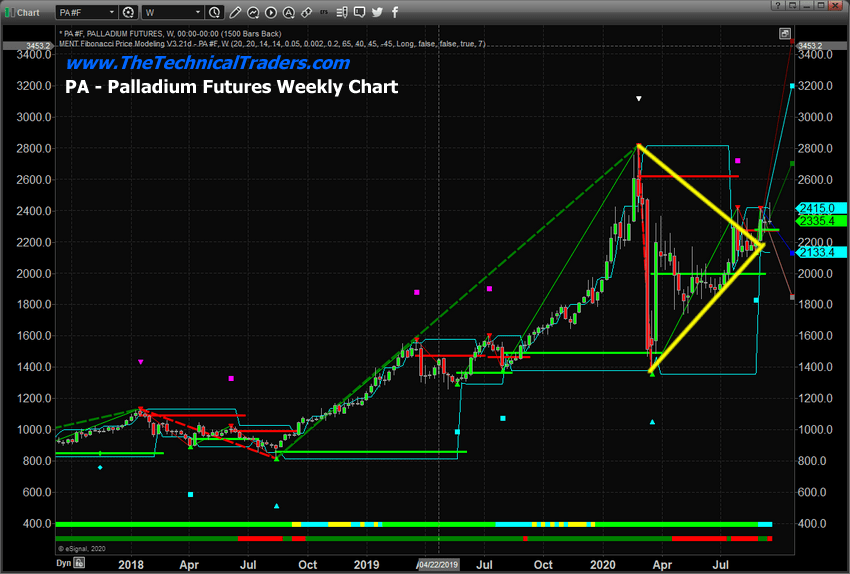
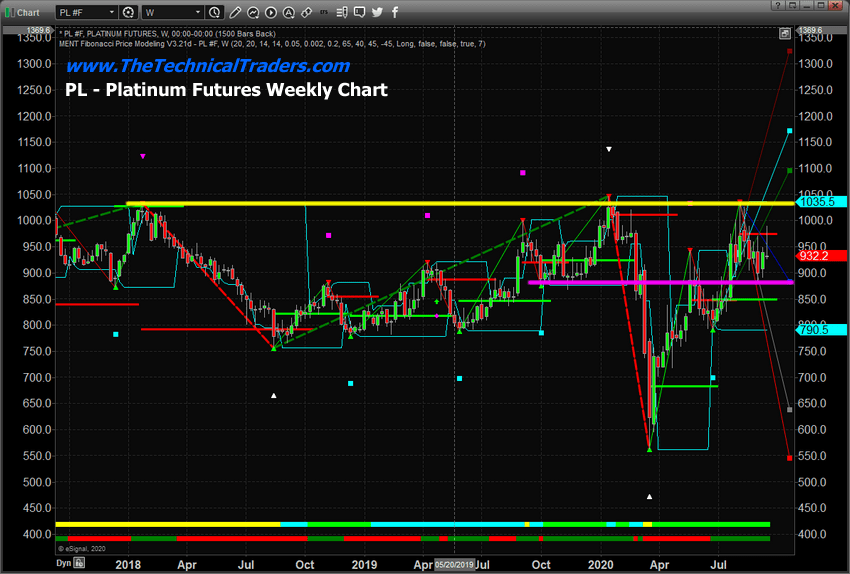
What you may not be aware of is the incredible opportunities setting up in Platinum and Palladium.  Platinum has set up a very deep COVID-19 low near $550 and rallied back to briefly touch resistance near $1,035 as we can see in the Palladium Weekly chart below. Since that move, Platinum has stalled below $1,000 waiting for momentum to start another upside price leg.  Using a simple 100% Fibonacci Measured move technique, we can easily identify the $485 price swing from the $1,035 highs to the $550 lows.  All we need to do is find a support level near what we believe will be the Momentum Base level, then add that $485 to the Momentum Base level to find the next upside target in Platinum.

Let us assume the Momentum Base will happen near $925. This would result in the next upside price target for Platinum will be $1,410.  Of course, Platinum would have to rally above the $1,035 level to confirm this upside breakout trend and for the $1,410 target level to become valid.  That $1,410 target level represents a +52.4% upside price target.

Palladium presents an even broader price rotation.   The peak just before the COVID-19 collapse was near $2,820.  The bottom in March 2020 was near $1,357.  This creates a range of $1,463.  We can clearly see the Flag/Pennant formation on the Palladium Weekly chart (below) highlighted in YELLOW.  We want you to pay close attention to what already appears to be a moderate upside price move after the apex of the Flag/Pennant formation.

If we add the $1,463 range to the Flag/Pennant Apex level, near $2,200, then we end up with a new upside price target for Palladium near $3,663.  This represents a +66.5% upside price target for Palladium.

Something else we want to point out is the relationship of Platinum and Palladium to Gold and Silver.  If Platinum and Palladium rally towards the targets we have suggested (+52% and/or +65%) from the Momentum Base levels, could Gold and Silver rally a similar amount?  A 55% rally in Gold from current levels would target the $3,038 level.  A 55% rally in Silver would target the $42 level. These new upside target levels are well beyond our “Measured Move” suggested targets – these higher target levels may be broader upside Fibonacci expansion levels?  Still, they suggest a much bigger move in precious metals is pending.

Watch how Platinum, Palladium, Gold and Silver react over the next 6+ weeks.  We believe there is a very strong possibility that a bigger upside price move is just waiting to breakout as the markets deal with incredible levels of uncertainty over the next 60 to 90+ days.

Isn’t it time you learned how I can help you better understand technical analysis as well as find and execute better trades?  If you look back at past research, you will see that my incredible team and our proprietary technical analysis tools have shown you what to expect from the markets in the future.  Do you want to learn how to profit from these expected moves?  If so, sign up for my Active ETF Swing Trade Signals today!

If you have a buy-and-hold or retirement account and are looking for long-term technical signals for when to buy and sell equities, bonds, precious metals, or sit in cash then be sure to subscribe to my Passive Long-Term ETF Investing Signals to stay ahead of the market and protect your wealth!

Chris Vermeulen
Chief Market Strategist
Technical Traders Ltd.

NOTICE AND DISCLAIMER: Our free research does not constitute a trade recommendation or solicitation for our readers to take any action regarding this research.  It is provided for educational purposes only – read our FULL DISCLAIMER here. Visit TheTechnicalTraders.com to learn how to take advantage of our members-only research and trading signals.


Forex Technical Analysis & Forecast 21.09.2020

Article By RoboForex.com

EURUSD, “Euro vs US Dollar”

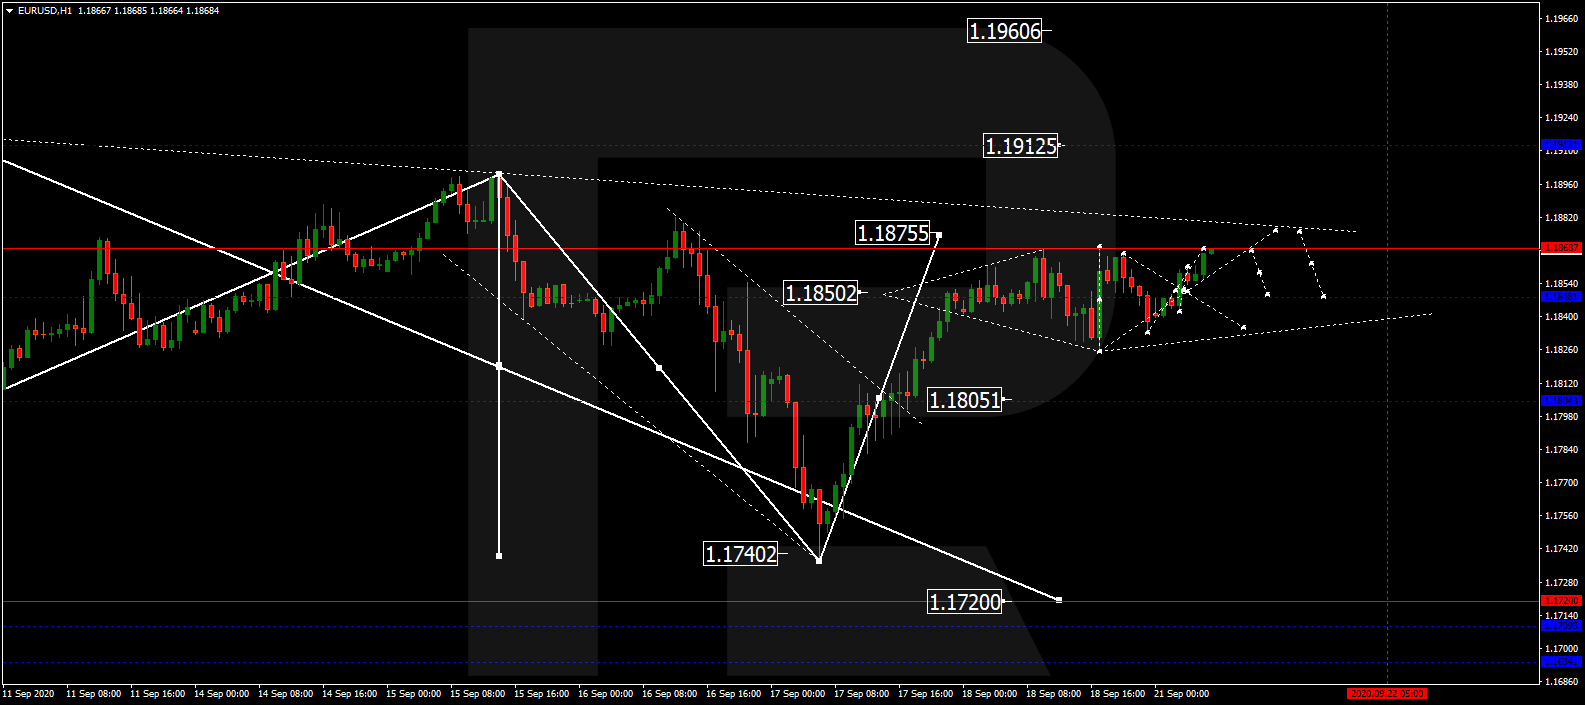
After finishing the descending structure at 1.1740, rebounding from this level, and then breaking 1.1805 to the upside, EURUSD has completed the ascending structure towards 1.1866 and may continue growing with the target at 1.1875. Today, the pair may fall to test 1.1850 from below and then resume moving upwards to reach the above-mentioned target. Later, the market may break 1.1875 upwards and continue trading within the uptrend towards 1.1910.

EURUSD
Risk Warning: the result of previous trading operations do not guarantee the same results in the future

GBPUSD, “Great Britain Pound vs US Dollar”

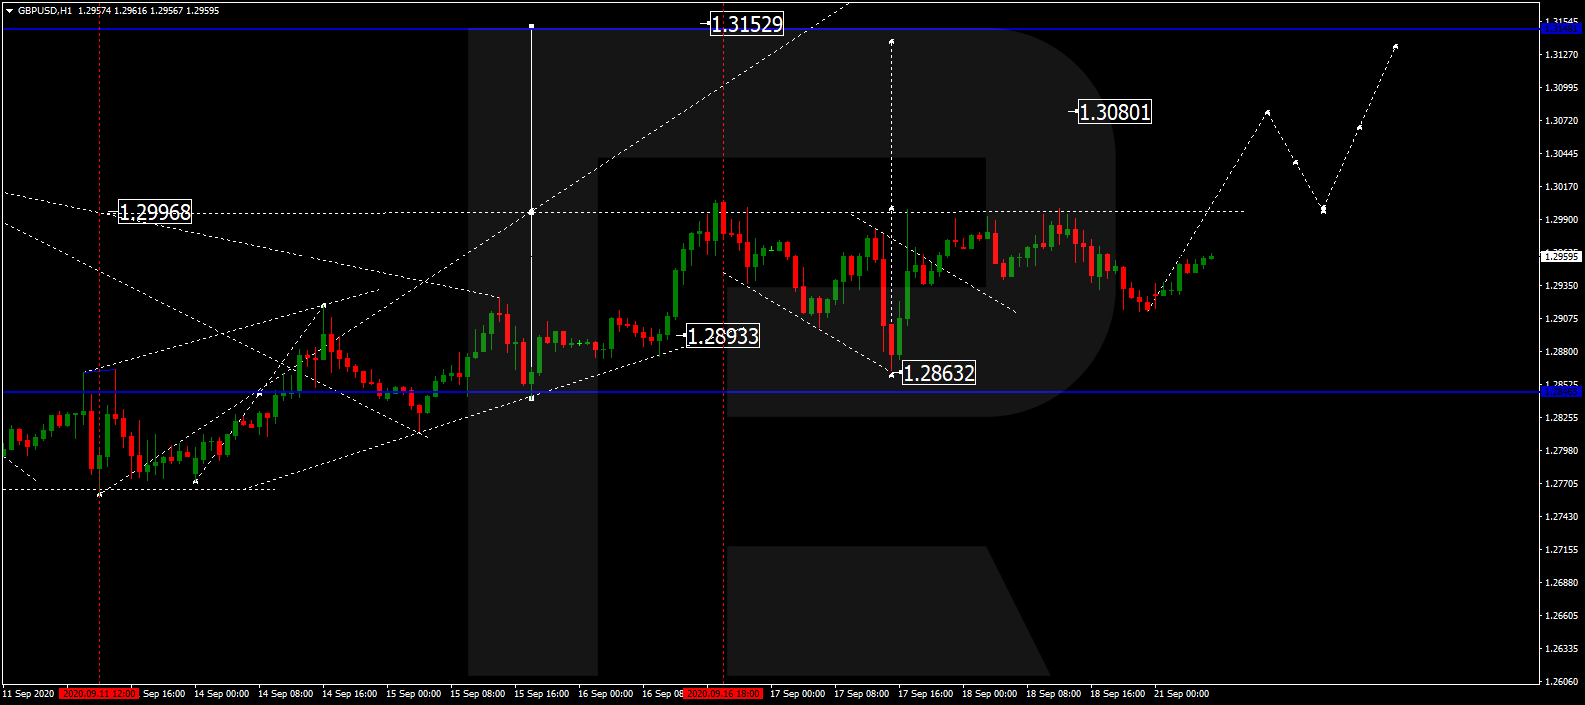
After completing the correction at 1.2864, GBPUSD is forming another ascending structure to reach 1.2990. Possibly, the pair may break this level upwards and continue growing with the short-term target at 1.3080. After that, the instrument may correct to test 1.1990 from above.

GBPUSD
Risk Warning: the result of previous trading operations do not guarantee the same results in the future

USDRUB, “US Dollar vs Russian Ruble”

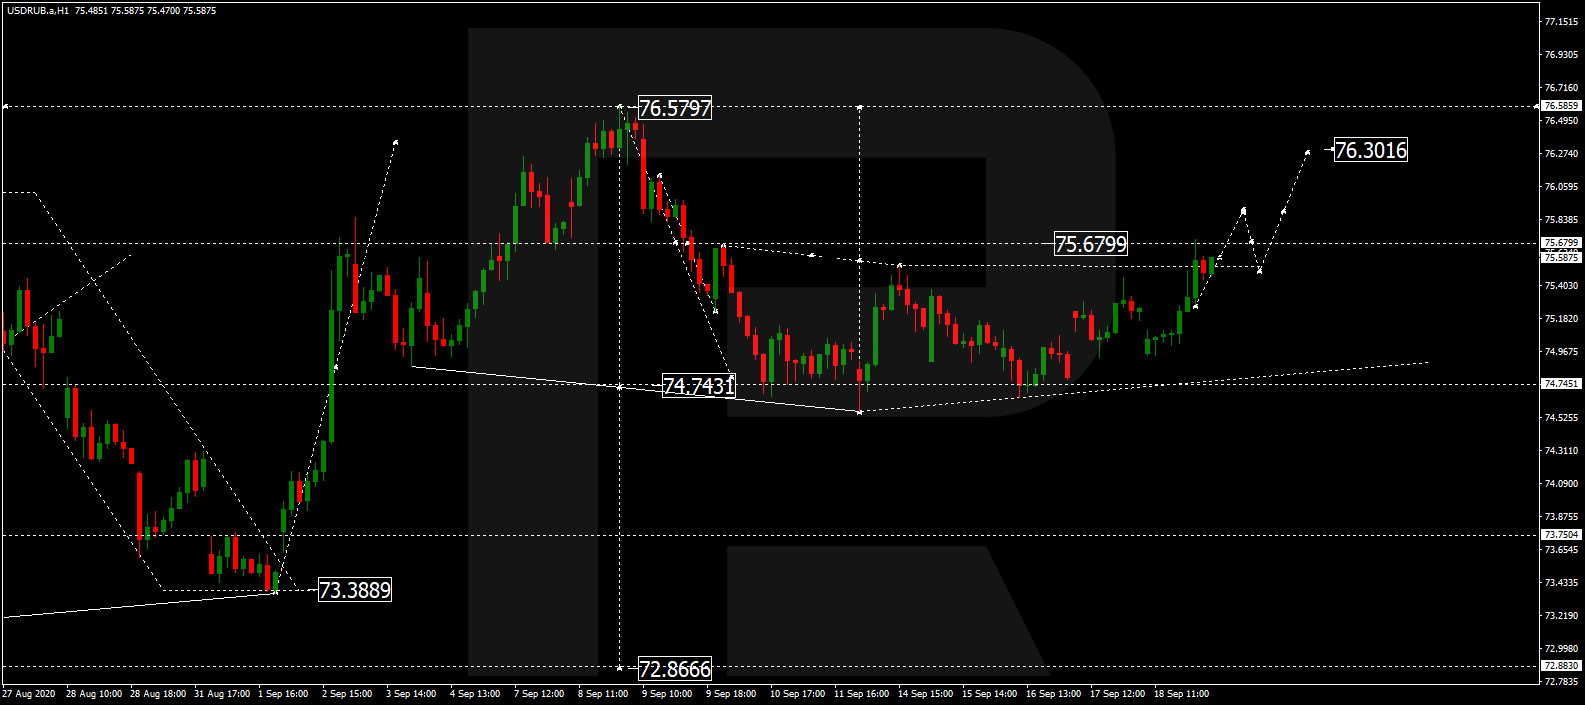
After finishing the ascending structure at 75.67, USDRUB is expected to consolidate around this level. Possibly, today the pair may break the range to the upside and resume trading upwards with the short-term target at 76.30. Later, the market may correct towards 75.65 and then form one more ascending structure to reach 76.60.

USDRUB
Risk Warning: the result of previous trading operations do not guarantee the same results in the future

USDJPY, “US Dollar vs Japanese Yen”

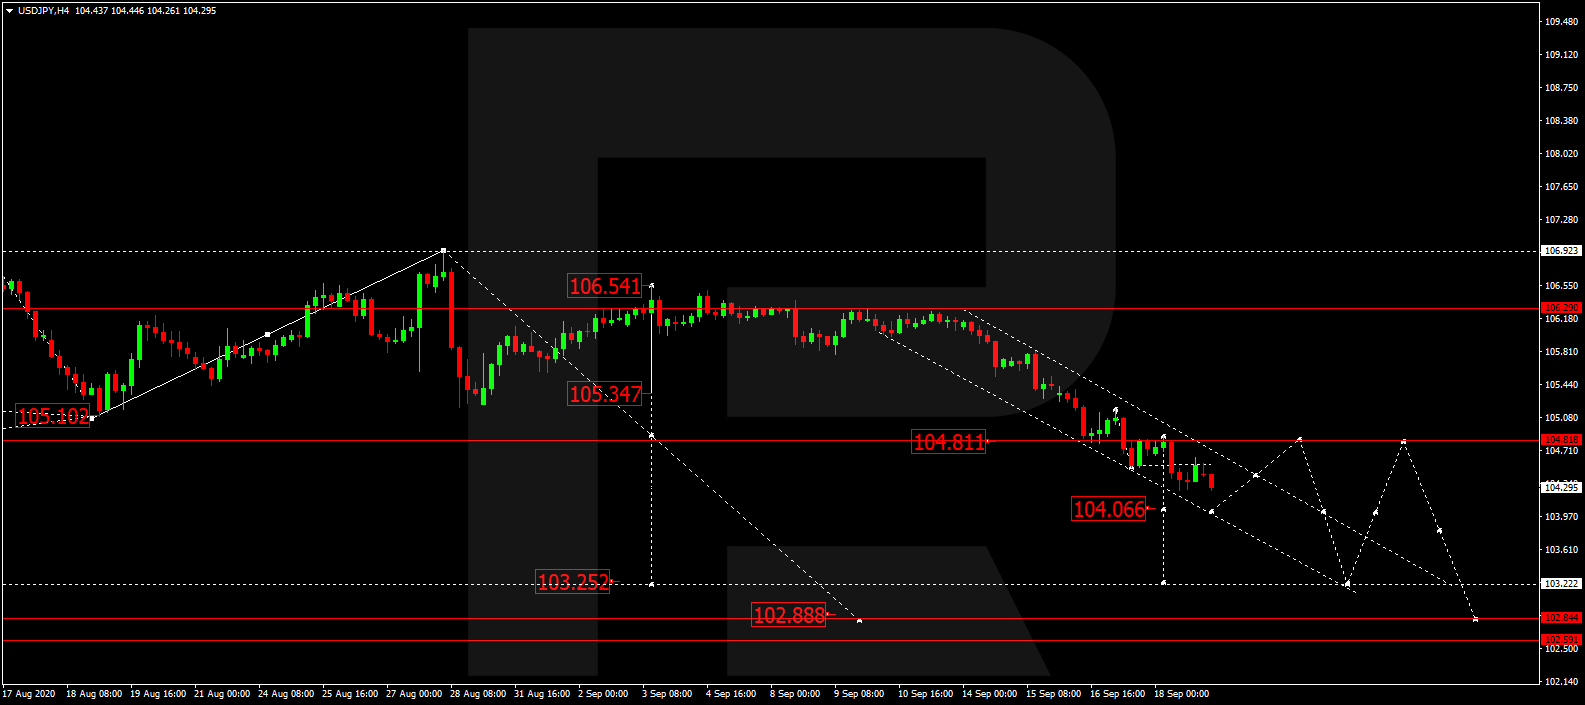
USDJPY is still falling. Today, the pair may reach 104.06 and then start another correction towards 104.80. After that, the instrument may form a new descending structure with the short-term target at 103.25.

USDJPY
Risk Warning: the result of previous trading operations do not guarantee the same results in the future

USDCHF, “US Dollar vs Swiss Franc”

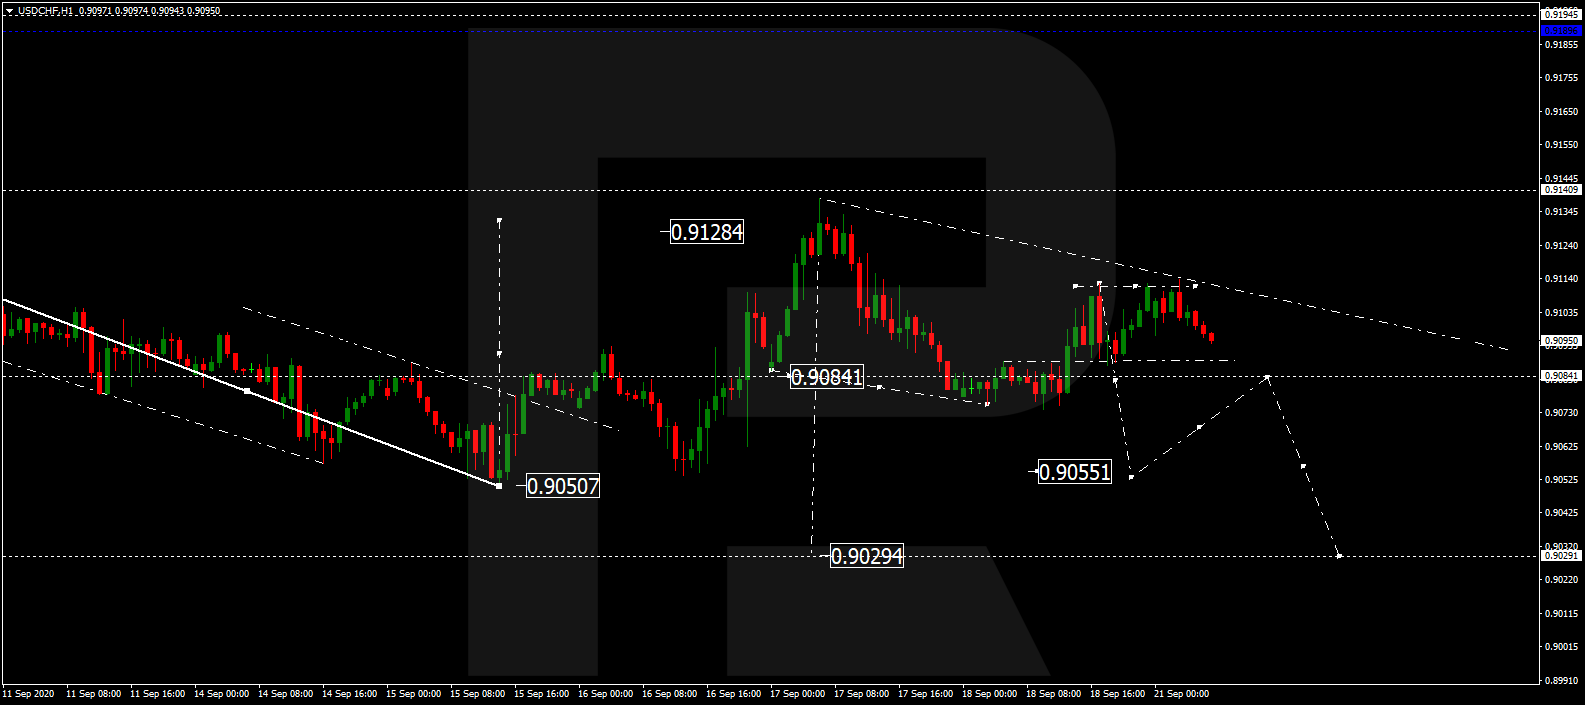
After finishing the descending structure at 0.9084 along with the correction towards 0.9111, USDCHF is moving downwards. Possibly, the pair may break 0.9080 and continue falling with the short-term target at 0.9055. After that, the instrument may correct to return to 0.9080 and then form a new descending structure to reach 0.9030.

USDCHF
Risk Warning: the result of previous trading operations do not guarantee the same results in the future

AUDUSD, “Australian Dollar vs US Dollar”

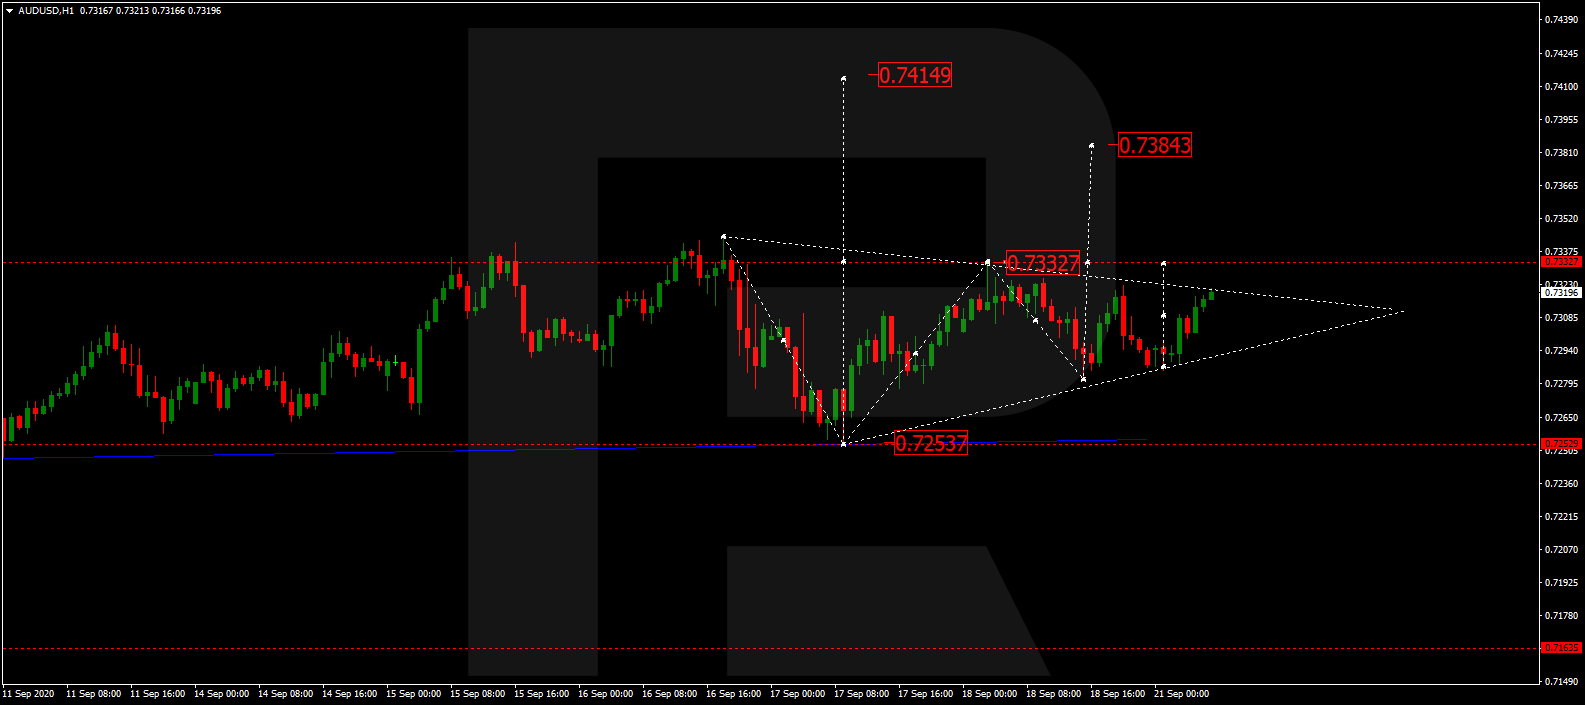
After completing the ascending structure at 0.7333 and then the correction towards 0.7282, AUDUSD is expected to return to 0.7333 and break it upwards. Later, the market may continue trading upwards with the short-term target at 0.7384 and then start a new correction to reach 0.7334.

AUDUSD
Risk Warning: the result of previous trading operations do not guarantee the same results in the future

BRENT

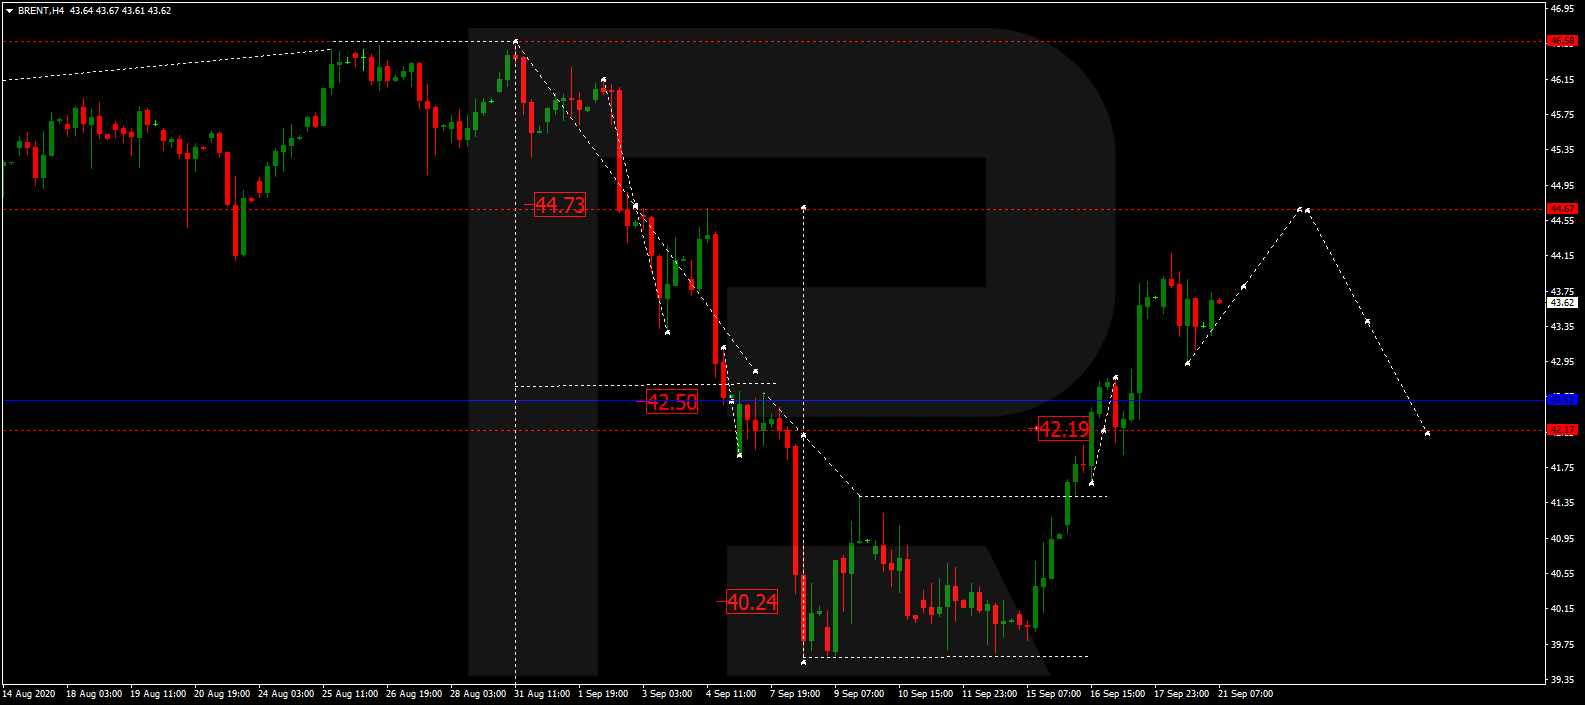
After finishing the ascending wave at 42.50 and then forming a new consolidation range around this level, Brent has broken it upwards to reach 44.20. Possibly, today the pair may fall to test 42.80 from above and then form one more ascending structure with the first target at 44.64.

BRENT
Risk Warning: the result of previous trading operations do not guarantee the same results in the future

XAUUSD, “Gold vs US Dollar”

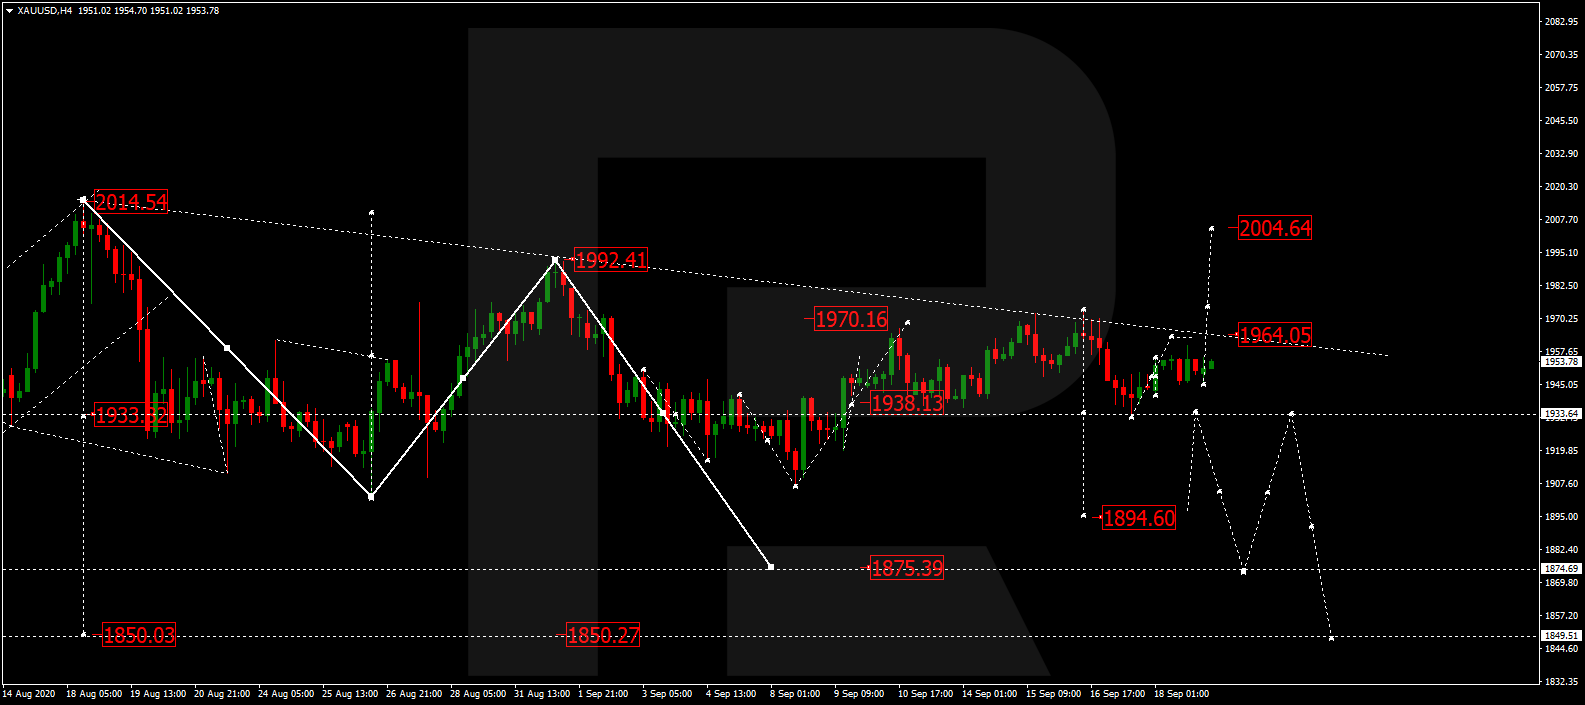
After completing the ascending structure at 1970.17 along with the correction towards 1933.70, Gold is consolidating around the latter level. Today, the pair may form one more ascending structure to break 1965.00 and then continue trading upwards with the target at 2004.50. However, if the price falls and breaks 1933.70 again, the market may continue falling to reach 1895.00.

GOLD
Risk Warning: the result of previous trading operations do not guarantee the same results in the future

BTCUSD, “Bitcoin vs US Dollar”

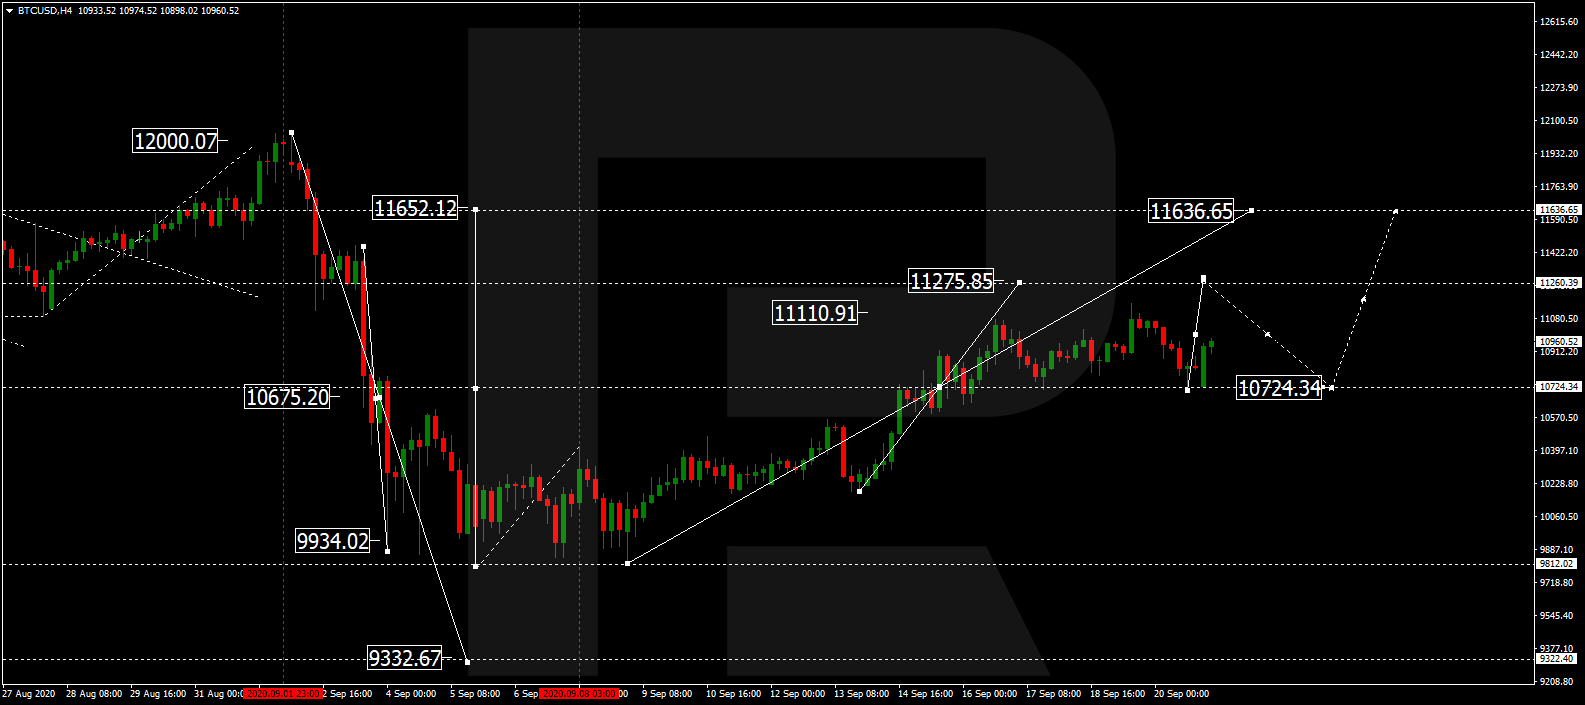
After completing the ascending wave at 10700.00 and forming a new consolidation range around this level, BTCUSD has broken it upwards. Possibly, the pair may grow to reach 11300.00 and then start a new correction to test 10700.00 Later, the market may resume trading upwards with the target at 11600.00.

BITCOIN
Risk Warning: the result of previous trading operations do not guarantee the same results in the future

S&P 500

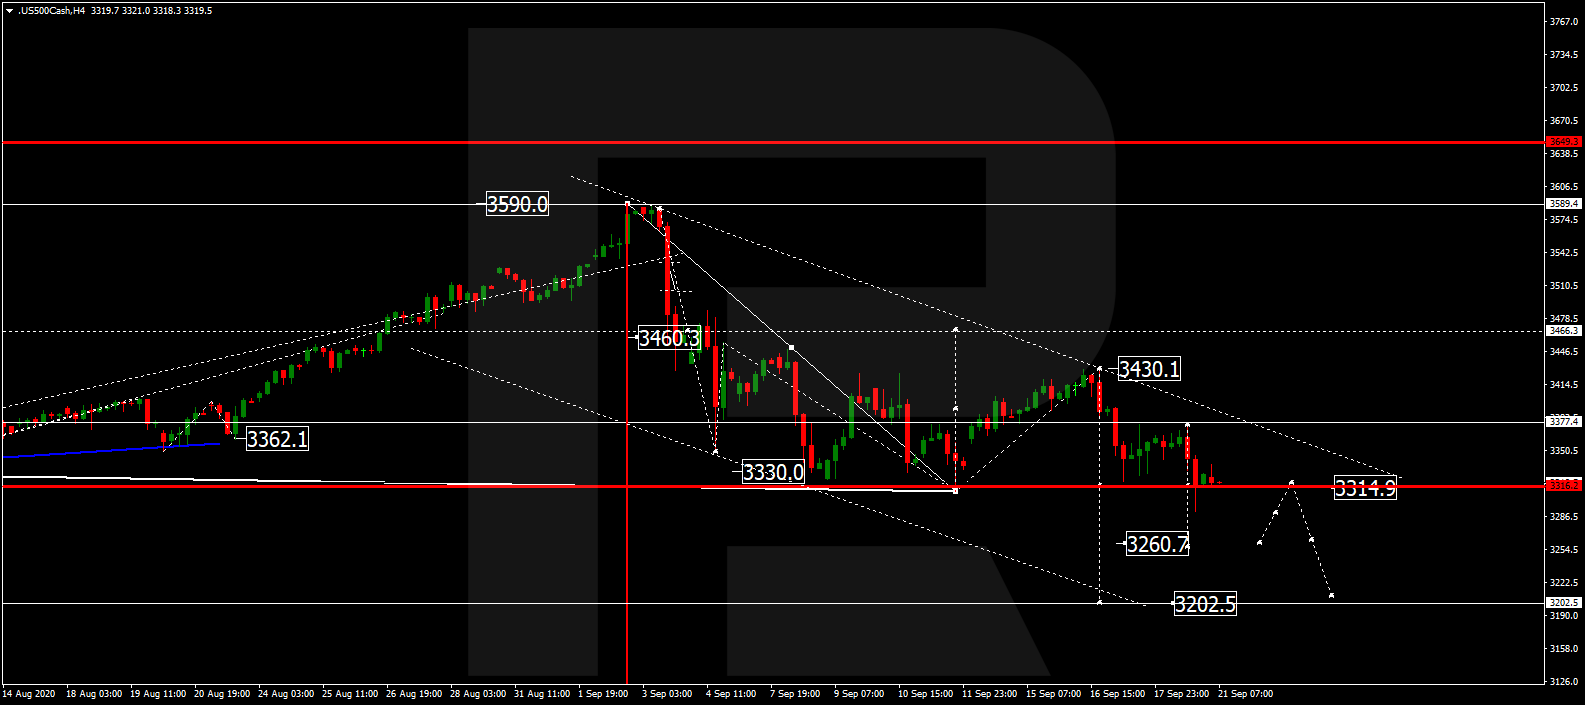
After finishing the first descending wave at 3330.0 and along with the correction towards 3430.0, the S&P index is falling to break 3330.0. Possibly, the asset may fall towards 3202.5 and then start another correction to reach 3315.0. After that, the instrument may resume trading downwards with the target at 3055.5.

S&P 500

Article By RoboForex.com

Attention!
Forecasts presented in this section only reflect the author’s private opinion and should not be considered as guidance for trading. RoboForex LP bears no responsibility for trading results based on trading recommendations described in these analytical reviews.

The Analytical Overview of the Main Currency Pairs on 2020.09.21

by JustForex

The EUR/USD currency pair

Technical indicators of the currency pair:
  • Prev Open: 1.18456
  • Open: 1.18400
  • % chg. over the last day: +0.07
  • Day’s range: 1.18564 – 1.18680
  • 52 wk range: 1.0637 – 1.2012

EUR/USD quotes are in a sideways trend. Financial market participants expect additional drivers. This week investors will be focused on the speeches by the Fed Chairman Jerome Powell: on Tuesday he will give a speech concerning supporting the economy in a pandemic at the Financial Services Committee of the US House of Representatives, on Wednesday he will speak in the House of Representatives, on Thursday – in the Senate Committee on Banking. At the moment, the key support is the level of 1.1830, the key resistance level is 1.1865. We recommend opening positions from these levels.

The publication of important news is not expected today. We recommend paying attention to the speech by the Fed Chairman.

EUR/USD

Indicators do not give accurate signals: 50 MA crossed 100 MA.

The MACD histogram is in the positive zone, but below the signal line, which gives a weak signal to buy EUR/USD.

Stochastic Oscillator is in the neutral zone, the %K line is below the %D line, which gives a signal to sell EUR/USD.

Trading recommendations
  • Support levels: 1.1830, 1.1790, 1.1750
  • Resistance levels: 1.1865, 1.1900, 1.1960

If the price fixes below 1.1830, EUR/USD quotes are expected to decline. The movement is tending to the round level of 1.1800.

An alternative could be the growth of the EUR/USD currency pair to 1.1900-1.1920.

The GBP/USD currency pair

Technical indicators of the currency pair:
  • Prev Open: 1.29629
  • Open: 1.29213
  • % chg. over the last day: +0.14
  • Day’s range: 1.28971 – 1.29640
  • 52 wk range: 1.1409 – 1.3516

During today’s trading session, GBP/USD quotes have been declining. Investors are concerned that the UK will have to re-quarantine again due to the rise in new cases of COVID-19. Prime Minister Boris Johnson said on Friday that he did not want new isolation, but new restrictions might be needed because the country was facing an “inevitable” second wave of coronavirus. At the moment, the key support and resistance levels are 1.2870 and 1.2930, respectively. Positions should be opened from these levels.

The news feed on the UK economy is calm.

GBP/USD

Indicators point to the power of sellers: the price is being traded below 50 MA and 100 MA.

The MACD histogram is in the negative zone, below the signal line, which gives a strong signal to sell GBP/USD.

Stochastic Oscillator is in the neutral zone, the %K line is below the %D line, which indicates the bearish sentiment.

Trading recommendations
  • Support levels: 1.2870, 1.2810, 1.2760
  • Resistance levels: 1.2930, 1.2985, 1.3040

If the price fixes below 1.2870, GBP/USD quotes are expected to decline. The movement is tending to 1.2810-1.2800.

If the price fixes above the resistance level of 1.2930, GBP/USD quotes are expected to grow to 1.2985-1.3000.

The USD/CAD currency pair

Technical indicators of the currency pair:
  • Prev Open: 1.31599
  • Open: 1.31944
  • % chg. over the last day: -0.04
  • Day’s range: 1.32124 – 1.32241
  • 52 wk range: 1.2949 – 1.4669

During today’s trading session, the USD/CAD currency pair has been growing. Weak economic data from Canada were published on Friday. Thus, core retail sales fell by 0.4% in July, while experts forecasted an increase by 0.5%. At the moment, the key support and resistance levels are 1.3190 and 1.3230, respectively. We recommend paying attention to the dynamics of “black gold” prices. Positions should be opened from key support and resistance levels.

Today, the news feed in Canada is calm.

USD/CAD

Indicators point to the bullish sentiment: the price is being traded above 50 MA and 100 MA.

The MACD histogram is in the positive zone and above the signal line, which gives a signal to buy USD/CAD.

Stochastic Oscillator is near the overbought zone, the %K line is above the %D line, which gives a weak signal to buy USD/CAD.

Trading recommendations
  • Support levels: 1.3190, 1.3150, 1.3100
  • Resistance levels: 1.3230, 1.3265

If the price fixes above 1.3230, further growth in USD/CAD quotes is expected. The movement is tending to 1.3265-1.3280.

An alternative could be a decline in the USD/CAD currency pair to 1.3150-1.3130.

The USD/JPY currency pair

Technical indicators of the currency pair:
  • Prev Open: 104.712
  • Open: 104.473
  • % chg. over the last day: -0.01
  • Day’s range: 104.076 – 104.210
  • 52 wk range: 101.19 – 112.41

The Japanese yen is strengthening against the US dollar amid weak US statistics and uncertainty about the outlook for the US economy. At the moment, USD/JPY quotes continue to decline. At the moment, the local support and resistance levels are 104.00 and 104.45, respectively. A further decline in the trading instrument is possible. Positions should be opened from key support and resistance levels.

The news feed on Japan’s economy is calm.

USD/JPY

Indicators point to the power of sellers: the price is being traded below 50 MA and 100 MA.

The MACD histogram is in the negative zone, below the signal line, which also gives a strong signal to sell USD/JPY.

Stochastic Oscillator is in the neutral zone, the %K line crosses the %D line. There are no signals at the moment.

Trading recommendations
  • Support levels: 104.00, 103.50
  • Resistance levels: 104.45, 105.00, 105.35

If the price fixes below the round level of 104.00, further decline in USD/JPY quotes is expected. The movement is tending to 103.50-103.40.

An alternative could be the correction of the USD/JPY currency pair to the round level of 105.00.

by JustForex


This article reflects a personal opinion and should not be interpreted as an investment advice, and/or offer, and/or a persistent request for carrying out financial transactions, and/or a guarantee, and/or a forecast of future events.

DAX30 waiting for impulses from US Equities and the Nasdaq100

By Admiral Markets

 Economic Events 21 September 2020

Source: Economic Events 21 September 2020 – Admiral Markets’ Forex Calendar

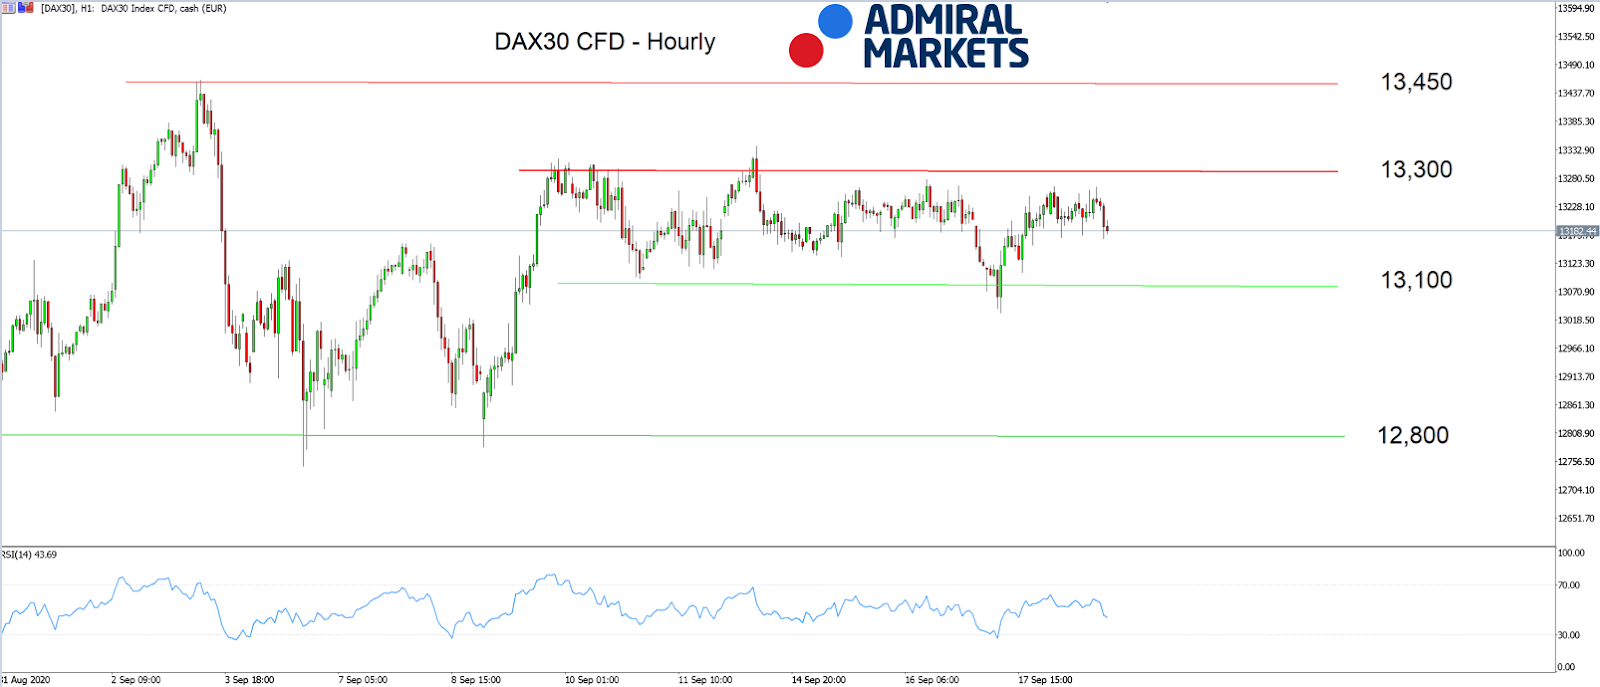
DAX traders were hoping for impulses from the FED last week, but were disappointed. As a result, the German index continued trading within a choppy trading range between 13,100 and 13,300 points.

Since the US central bank FED didn’t deliver anything really new at its rate decision last week on Wednesday and most market participants were expecting such a stance, the DAX30 went for a stint lower, but didn’t break below 13,000 points.

One main reason for the rejection against this level was probably the big expiration (“Triple Witching”) last Friday with the 13,000 point mark seeing an elevated open interest in terms of put options.

Price action wise, the failed attempt for a break lower leaves the DAX within a choppy range with hopes rising among traders that we’ll get to see a break on the up- or downside sooner rather than later.

In our opinion, the German index still depends strongly on US Equities, especially the Nasdaq100:

  • The focus on the Nasdaq100 is on the region around 11,000 points
  • Our outlook is that the DAX30 will continue to be positive
  • There is potential for the DAX30 to test current September highs around 13,450 points, with a stop-over around 13,300/350 points

A break lower in the Nasdaq100 makes a break below 13,000 points in the DAX30 likely, levelling the path for a run down to 12,900 points and even lower:

DAX30 CFD Hourly chart

Source: Admiral Markets MT5 with MT5SE Add-on DAX30 CFD Hourly chart (between August 31, 2020, to September 18, 2020). Accessed: September 18, 2020, at 10:00 PM GMT

 DAX30 CFD Daily chart

Source: Admiral Markets MT5 with MT5SE Add-on DAX30 CFD Daily chart (between April 24, 2019, to September 18, 2020). Accessed: September 18, 2020, at 10:00 PM GMT – Please note: Past performance is not a reliable indicator of future results, or future performance.

In 2015, the value of the DAX30 CFD increased by 9.56%, in 2016, it increased by 6.87%, in 2017, it increased by 12.51%, in 2018, it fell by 18.26%, and in 2019, it increased by 26.44%, meaning that in five years, it was up by 34.2%.

Check out Admiral Markets’ most competitive conditions on the DAX30 CFD and start trading on the DAX30 CFD with a low 0.8 point spread offering during the main Xetra trading hours.

Discover the world’s #1 multi-asset platform

Admiral Markets offers professional traders the ability to trade with a custom, upgraded version of MetaTrader 5, allowing you to experience trading at a significantly higher, more rewarding level. Experience benefits such as the addition of the Market Heat Map, so you can compare various currency pairs to see which ones might be lucrative investments, access real-time trading data, and so much more. Click the banner below to start your FREE download of MT5!

Download MetaTrader 5

Disclaimer: The given data provides additional information regarding all analysis, estimates, prognosis, forecasts or other similar assessments or information (hereinafter “Analysis”) published on the website of Admiral Markets. Before making any investment decisions please pay close attention to the following:

  1. This is a marketing communication. The analysis is published for informative purposes only and is in no way to be construed as investment advice or recommendation. It has not been prepared in accordance with legal requirements designed to promote the independence of investment research, and that it is not subject to any prohibition on dealing ahead of the dissemination of investment research.
  2. Any investment decision is made by each client alone whereas Admiral Markets shall not be responsible for any loss or damage arising from any such decision, whether or not based on the Analysis.
  3. Each of the Analysis is prepared by an independent analyst (Jens Klatt, Professional Trader and Analyst, hereinafter “Author”) based on the Author’s personal estimations.
  4. To ensure that the interests of the clients would be protected and objectivity of the Analysis would not be damaged Admiral Markets has established relevant internal procedures for prevention and management of conflicts of interest.
  5. Whilst every reasonable effort is taken to ensure that all sources of the Analysis are reliable and that all information is presented, as much as possible, in an understandable, timely, precise and complete manner, Admiral Markets does not guarantee the accuracy or completeness of any information contained within the Analysis. The presented figures that refer to any past performance is not a reliable indicator of future results.
  6. The contents of the Analysis should not be construed as an express or implied promise, guarantee or implication by Admiral Markets that the client shall profit from the strategies therein or that losses in connection therewith may or shall be limited.
  7. Any kind of previous or modeled performance of financial instruments indicated within the Publication should not be construed as an express or implied promise, guarantee or implication by Admiral Markets for any future performance. The value of the financial instrument may both increase and decrease and the preservation of the asset value is not guaranteed.
  8. The projections included in the Analysis may be subject to additional fees, taxes or other charges, depending on the subject of the Publication. The price list applicable to the services provided by Admiral Markets is publicly available from the website of Admiral Markets.
  9. Leveraged products (including contracts for difference) are speculative in nature and may result in losses or profit. Before you start trading, you should make sure that you understand all the risks.

By Admiral Markets

Rising Covid-19 cases keep risk assets under pressure

By Hussein Sayed, Chief Market Strategist (Gulf & MENA), ForexTime

Equity markets kicked off Monday on the back foot following three weeks of consecutive declines in US stocks, which marked the longest weekly losing streak since 2019. Investors are becoming increasingly worried about the momentum in the economic recovery given the resurgent numbers of global Covid-19 cases and lack of progress on a new US stimulus package.

Although President Trump signaled his readiness to back a bigger stimulus bill last week, the Supreme Court’s empty seat left by the passing of Ruth Bader Ginsburg is likely to complicate the matter. The fight between the President and Congressional Democrats on whether to fill the vacant seat now or wait until after the election is expected to lead to more delays in reaching a middle ground on a new fiscal package. Hence, we would expect that the much-needed stimulus will be pushed back until after the US elections.

Given that the list of uncertainties is growing, especially on the pandemic front, risk is now skewed to the downside. We have US elections just around the corner, hefty valuations in growth sectors despite the recent correction and the high stakes of possible national lockdowns in the UK and elsewhere all pointing to waning momentum in the economic recovery. All these factors indicate more volatile times for the next several weeks.

Datawise, investors need to keep a close eye on September’s flash PMIs coming out of Germany, France and the UK this week for further indications on how the big European economies are faring following the strong rebound in early Q3. Signs of weakness here will be a strong signal that the economic recovery is indeed losing its way and further action is needed from fiscal and monetary policymakers.

Currency markets are not yet reflecting the risk aversion seen in equities. The Dollar is trading slightly lower against its major peers, with the DXY -0.15% at the time of writing. The Fed is clearly the winner among other central banks in providing the most accommodative monetary policy, which means the long-term projections for the Dollar remain to the downside. However, if the selloff in US equities accelerates this week, expect the greenback to regain some support.

In commodity markets, Brent fell by 1% after trading slightly higher in early Asian trade. The battle between the bulls and bears is keeping prices rangebound between $40 and $45. At this stage, the demand outlook is far more important than the supply side. That’s why oil traders need to keep a close eye on the trajectory of the virus, especially if it’s going to lead to renewed lockdowns. Gold is also another commodity stuck in a narrow range as traders await new clues on the Fed’s policy approach towards inflation.  This could happen later this week as Chairman Jerome Powell may provide new hints when he appears before the Congress on Tuesday.

Disclaimer: The content in this article comprises personal opinions and should not be construed as containing personal and/or other investment advice and/or an offer of and/or solicitation for any transactions in financial instruments and/or a guarantee and/or prediction of future performance. ForexTime (FXTM), its affiliates, agents, directors, officers or employees do not guarantee the accuracy, validity, timeliness or completeness, of any information or data made available and assume no liability as to any loss arising from any investment based on the same.


Forex-Time-LogoArticle by ForexTime

ForexTime Ltd (FXTM) is an award winning international online forex broker regulated by CySEC 185/12 www.forextime.com
Euro Growing a Bit

Author: Dmitriy Gurkovskiy, Chief Analyst at RoboForex

On Monday, September 21st, the major currency pair is “gaining weight” and trading at 1.1864.

The data published last Friday by the USD provided good support o the “greenback”. The preliminary report on the UoM Consumer Sentiment showed 78.9 points in September after being 74.1 points in the previous month. The indicator was expected to improve but only up to 75.0 points.

A new week September won’t offer many important numbers from the USA but the ones that are to be published will be connected with real estate and may provide insight into the state of things with both manufacturers and consumers.

However, the lion’s share of investors’ attention will be focused on almost daily speeches to be delivered by the US Federal Reserve Chairman Jerome Powell, who may talk about assessments of the current state of the American economy.

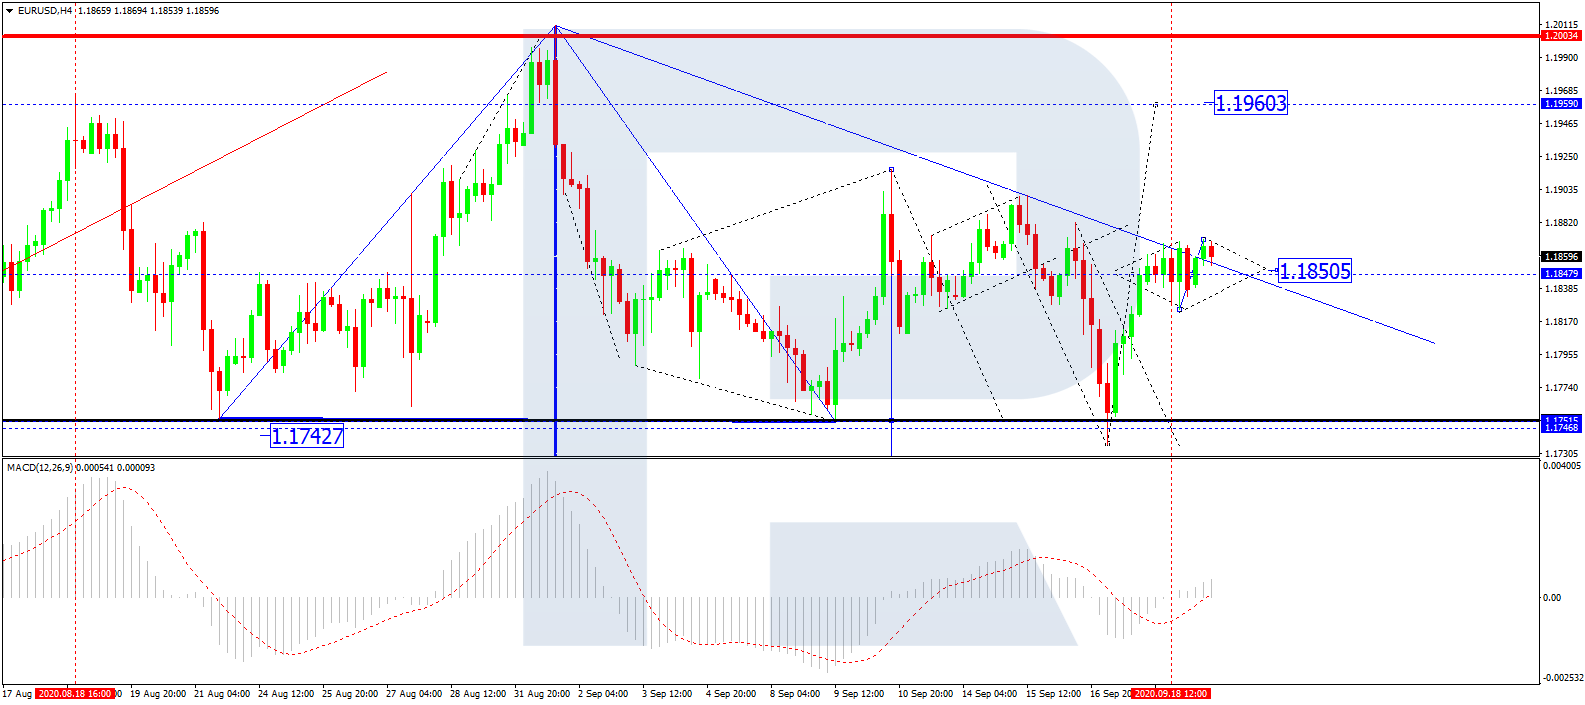
In the H4 chart, EUR/USD is consolidating around 1.1850. If later the price breaks this range to the upside, the market may resume growing to reach 1.1960; if to the downside – start a new decline to break 1.1800 and then continue trading inside the downtrend with the target at 1.1720. From the technical point of view, this scenario is confirmed by MACD Oscillator: after breaking 0 to the downside, its signal line is testing this level from below. If the level is broken to the upside, it may boost the ascending tendency on the price chart. However, if the line rebounds from 0 and enters the histogram area, the asset will continue trading downwards.

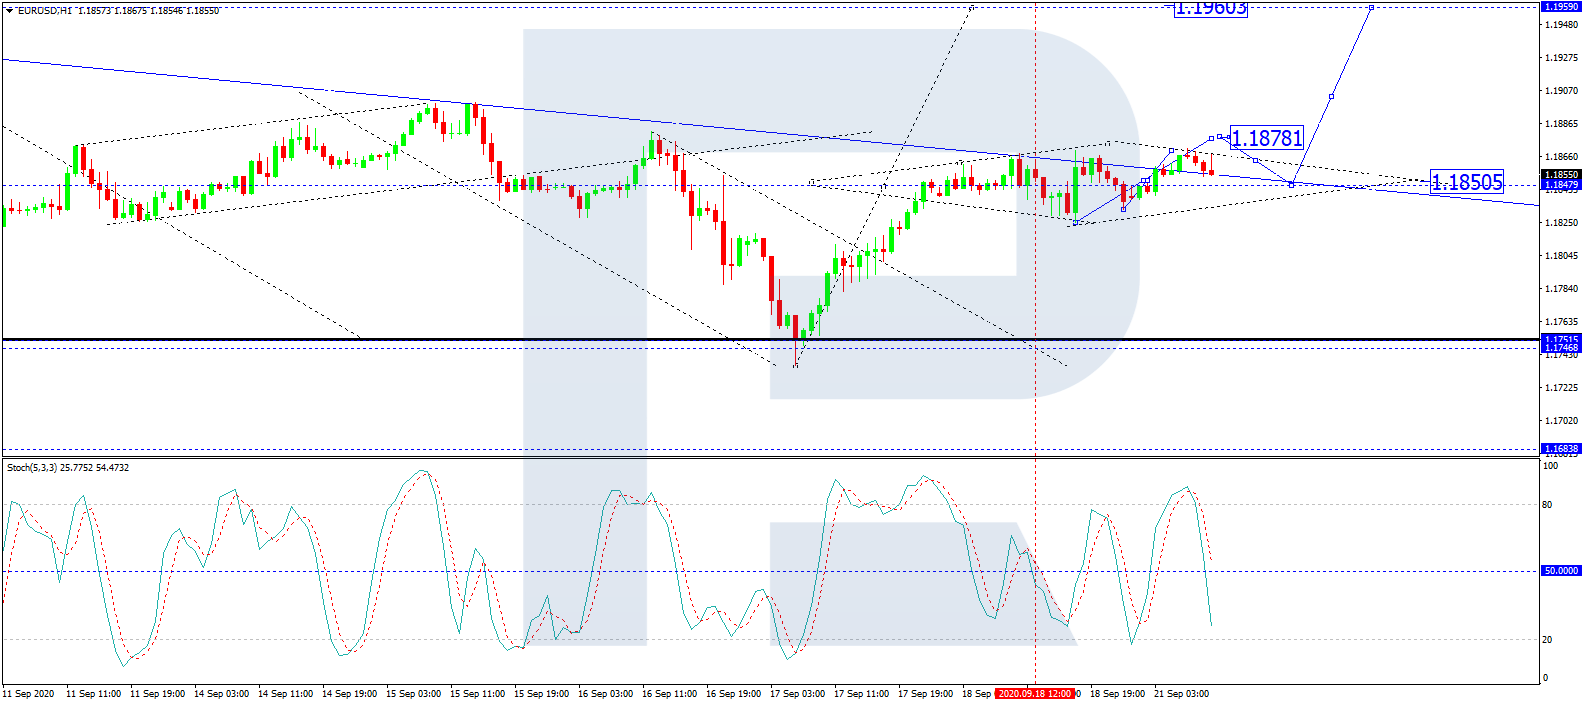
As we can see in the H1 chart, after completing the ascending wave towards the upside border of the range at 1.1866, EUR/USD is expected to rebound from this level and form a new descending structure towards 1.1835. After that, the instrument may resume trading upwards to reach 1.1875. If later the price breaks this level to the upside, the asset may continue growing towards 1.1890. However, if the instrument breaks 1.1820 to the downside, it may resume trading inside the downtrend with the target at 1.1800. From the technical point of view, this scenario is confirmed by Stochastic Oscillator: its signal line is moving towards 50. If this level is broken to the downside, it may continue falling to reach 20. Still, if the line rebounds from 50, it may imply further growth towards 80.

Disclaimer

Any forecasts contained herein are based on the author’s particular opinion. This analysis may not be treated as trading advice. RoboForex bears no responsibility for trading results based on trading recommendations and reviews contained herein.

Supreme Court battle presents another major risk for investors

By Han Tan, Market Analyst, ForexTime

Asian stocks and US equity futures are mixed, as global investors have been dealt with a major twist just six weeks before the US Presidential elections.

Supreme Court Justice Ruth Bader Ginsburg passed away on Friday, which means her seat has now been vacated in the highest federal court in the land. US President Donald Trump and his fellow Republicans are now rushing to fill that seat, as this appointment would be monumental in shaping the Supreme Court’s ideological framework for many years to come, potentially even beyond the tenure of the next President of the United States. And a more conservative-leaning jurist would be most appealing for President Trump’s voter base, something which Democratic nominee Joe Biden would want to prevent.

In other words, the November 3rd elections is set to become not just be about who occupies the White House, but also the Supreme Court.

Since the pandemic broke out, market participants have been hoping for more stimulus packages from policymakers, and Washington DC has been locked in battle between Republicans and Democrats over the next round of US fiscal support.

However, this fight for the Supreme Court vacancy could dominate the political agenda in the lead up to the elections, perhaps at the expense of the next round of fiscal stimulus. This might deflate some of the optimism that’s still baked into US equities about more incoming financial support for the world’s largest economy to boost the performance of stock markets. Instead, it adds another major element of uncertainty over the next 44 days.

With the Dow Jones index now testing its 50-day moving average, a break below this support level could make the benchmark index susceptible to further declines until it can find a steadier footing. At the time of writing, the FXTM Trader’s Sentiment on the Wall Street 30 (Mini) remains short.


This turn of events means that fundamentally-driven investors who have been paying attention solely on the US economy and policymakers’ response to the pandemic may have to focus a lot more on the political narrative over the coming weeks. Although voting for the next President of the United States is already underway in several states, whoever can best galvanize their supporters over the Supreme Court battle could have the upper hand in the Presidential race. And as we know, the eventual winner of the November 3rd polls, and his policies, would certainly have a major bearing over the performance of global markets over the ensuing four years.

Already, since the passing of Justice Ginsburg, Democratic candidates received over US$103 million in donations on Sunday alone. It now remains to be seen how investors’ funds will flow when US stock markets open for trading this week.


Disclaimer: The content in this article comprises personal opinions and should not be construed as containing personal and/or other investment advice and/or an offer of and/or solicitation for any transactions in financial instruments and/or a guarantee and/or prediction of future performance. ForexTime (FXTM), its affiliates, agents, directors, officers or employees do not guarantee the accuracy, validity, timeliness or completeness, of any information or data made available and assume no liability as to any loss arising from any investment based on the same.


Forex-Time-LogoArticle by ForexTime

ForexTime Ltd (FXTM) is an award winning international online forex broker regulated by CySEC 185/12 www.forextime.com