Why Arm’s sale to Nvidia has stunned the tech industry

By Hamza Mudassir, Cambridge Judge Business School

Arm, the Cambridge-based microchip designer is a British tech success story. The firm designs software and semiconductors that are used in a multitude of consumer favourites, including Apple and Samsung smartphones, Nintendo consoles and many more. Its chip designs are increasingly used in the growing Internet of Things industry.

Much of Arm’s success comes from its neutrality, as it doesn’t compete with any of the companies it licenses its designs to. But there are fears this could all change. Arm’s owners, Softbank have announced a deal with tech giant Nvidia worth up to US$40 billion (£31 billion). A closer look at Arm’s success reveals why the tech industry is stunned by the news and why it poses potential problems for Arm going forward.

Arm defied the traditional notion of how a technology company competes in the global market place. To begin with, it does not manufacture any of its products. This is in sharp contrast to competitors Intel and AMD, who spend a lot of time, money and effort in manufacturing and marketing the microchips that they design. Instead, Arm licenses its patented designs to customers who can then easily modify, manufacture and market microchips around them.

Further, Arm has been a pioneer in building an ecosystem around itself, which currently consists of thousands of partners, vendors and manufacturers. This is a collaborative ecosystem, where many of Arm’s customers and partners have built their business models around Arm’s designs, secure in the knowledge that it is not a competitor.

The Switzerland of semiconductors

Arm’s model of collaborating instead of competing has resulted in a 90% share of the smartphone market alongside a reach that greatly exceeds that of rivals Intel and AMD. It is one of a handful of firms in the world that have successfully scaled a multibillion-dollar business built solely around research and development (R&D).

Arm co-founder Hermann Hauser describes the company as “the Switzerland of the semiconductor industry” because of this neutral approach. With this ethos holding strong for 30 years, thousands of companies have pegged their products to Arm’s R&D efforts.

This is in stark contrast to how the tech industry usually works. R&D investment is normally used as a tool to beat competitors, and it is quite common for large tech firms to compete fiercely with their own partners and customers. For example, Microsoft builds laptops and tablets that compete with many of the companies it sells its software to. Similarly, Google sells its Android software to other smartphone makers, while also competing with these customers with its Pixel phones.

Arm’s acquisition by Nvidia puts its Switzerland position at an obvious risk. Hauser said as much to the Guardian newspaper: “It is very much in Nvidia’s interest to kill Arm.”

Nvidia has promised to keep the Arm brand, maintain its neutrality and continue licensing its chip designs to customers. But many clients are concerned, with none of Arm’s big customers publicly backing the deal.

Nvidia is a US-based chip maker. It is the market leader in graphics processing units (GPUs), which power high-fidelity video games and increasingly handle data-intensive machine learning tasks. Leaps in microchip designs is one of the main ways it competes in its industry.

If this acquisition completes as planned, Nvidia would have gained a treasure trove of IP and patents that give it unparalleled power in the industry. Arm’s customers fear that they will become second-class citizens, with Nvidia first in line to its innovative new chip designs.

Another dimension to this deal is the fact that Nvidia is taking over Arm in the middle of the US-China trade war. This could put pressure on Arm’s China business, which represents about 20% of its revenues. In fact, in 2018, Arm divested its majority ownership in its China operations to give peace of mind to Beijing, which was increasingly worried about its dependence on foreign designed microchips. Such bold moves seem unlikely under Nvidia.

The deal will take up to 18 months to go through, as both Nvidia and Arm will have to get formal approval from competition commissions in the US, China, Europe and other major markets to proceed. But Nvidia’s assurances that it will keep Arm in Cambridge and expand its chip research there should go a long way toward assuage the British government at least.

In terms of Arm giving up its neutrality, research shows that mergers and acquisitions of this size can change acquiring companies as much as the targets they acquire. Nvidia CEO Jensen Huang has alluded to his plans to sell Nvidia’s GPU designs to Arm’s clients as part of a bundled offering. He also consistently speaks about his admiration of Arm’s unique place in the microchip ecosystem, and says he has no intentions to disrupt it.

Perhaps Arm will make Nvidia more neutral rather than the other way around. We will find out soon enough.The Conversation

About the Author:

Hamza Mudassir, Visiting Fellow in Strategy, Cambridge Judge Business School

This article is republished from The Conversation under a Creative Commons license. Read the original article.

Fibonacci Retracements Analysis 23.09.2020 (GBPUSD, EURJPY)

Article By RoboForex.com

GBPUSD, “Great Britain Pound vs US Dollar”

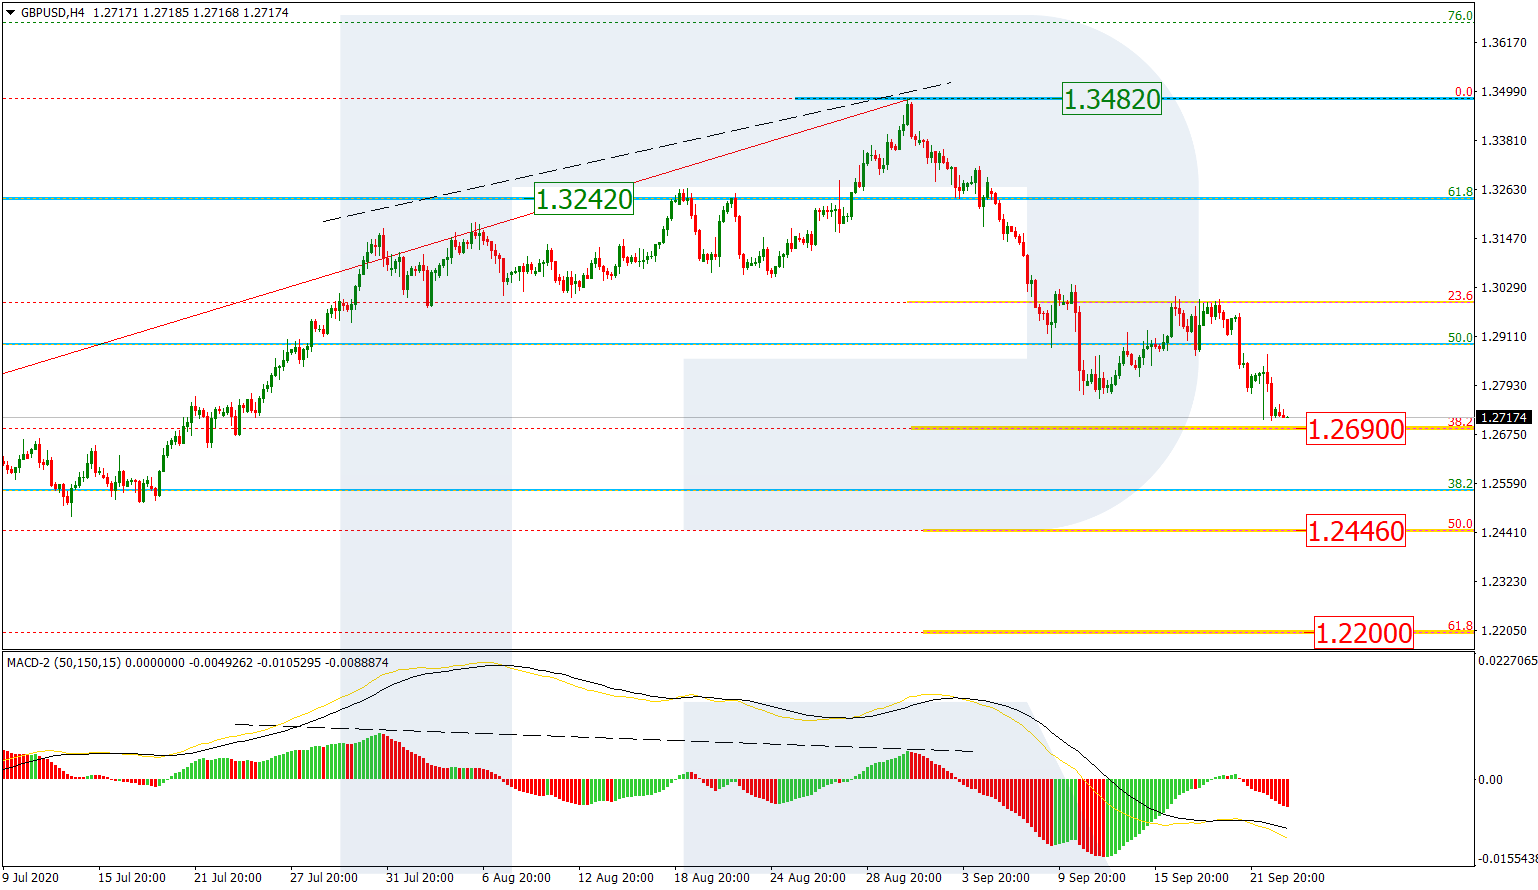
As we can see in the H4 chart, GBPUSD is falling after a divergence and getting closer to 38.2% fibo at 1.2690. This level supported the asset earlier, that’s why it may form a local consolidation range or start a pullback here. After completing the correction, the next descending impulse may be heading towards 50.0% and 61.8% fibo at 1.2446 and 1.2200 respectively. The resistance is the long-term 50.0% fibo at 1.3243.

GBPUSD_H4
Risk Warning: the result of previous trading operations do not guarantee the same results in the future

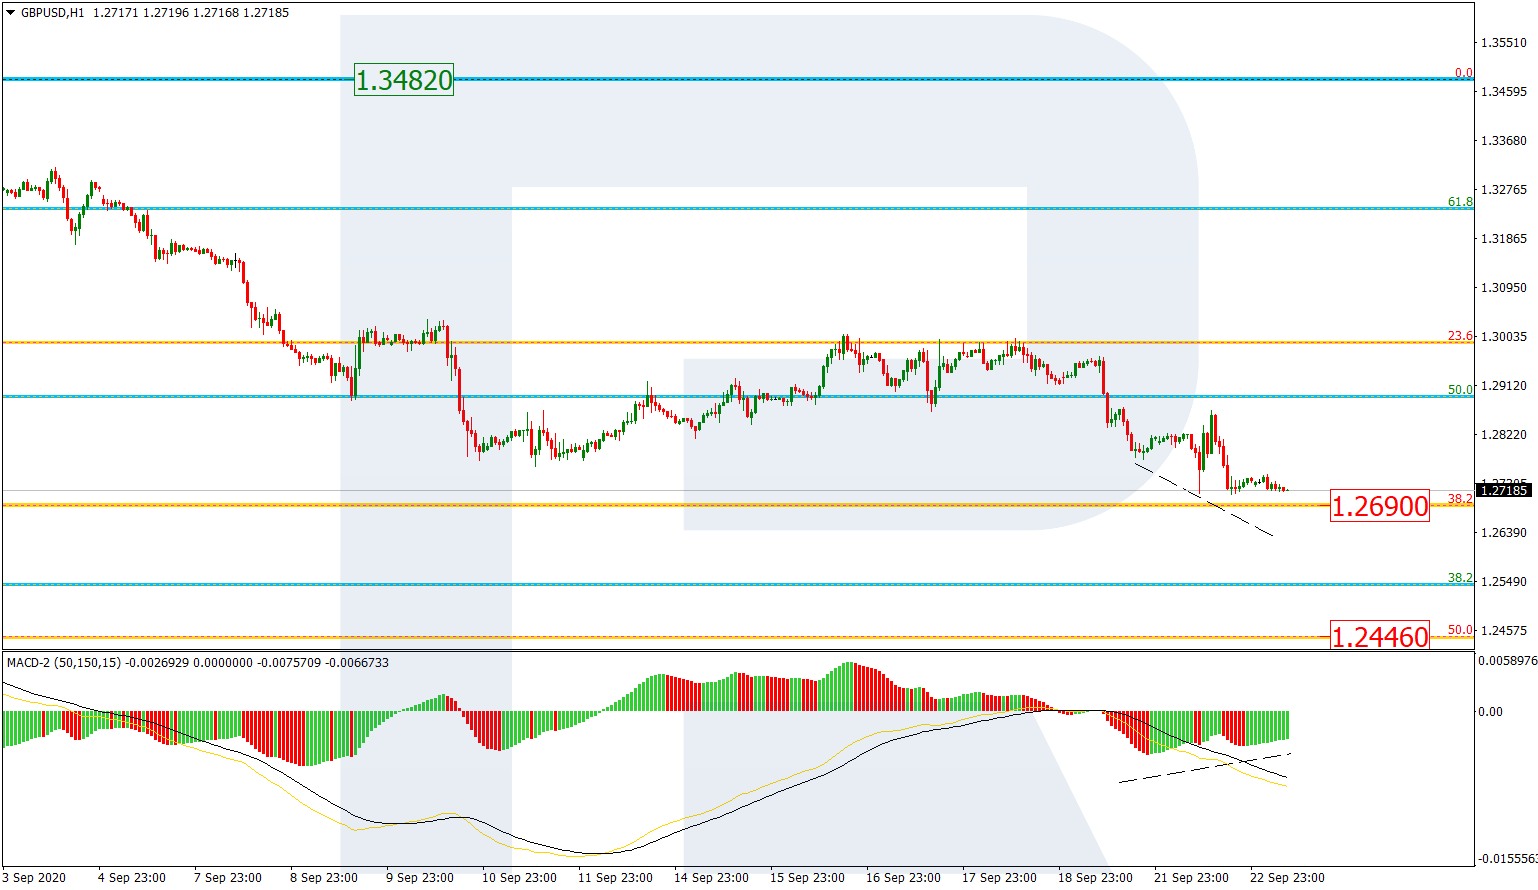
In the H1 chart, there is a convergence on MACD, which confirms a possible pullback. Here, the pair may break 38.2% fibo at 1.2690 and continue falling to test 50.0% fibo at 1.2446. After that, the instrument may rebound and even form a new ascending wave towards the high at 1.3482.

GBPUSD_H1
Risk Warning: the result of previous trading operations do not guarantee the same results in the future

EURJPY, “Euro vs. Japanese Yen”

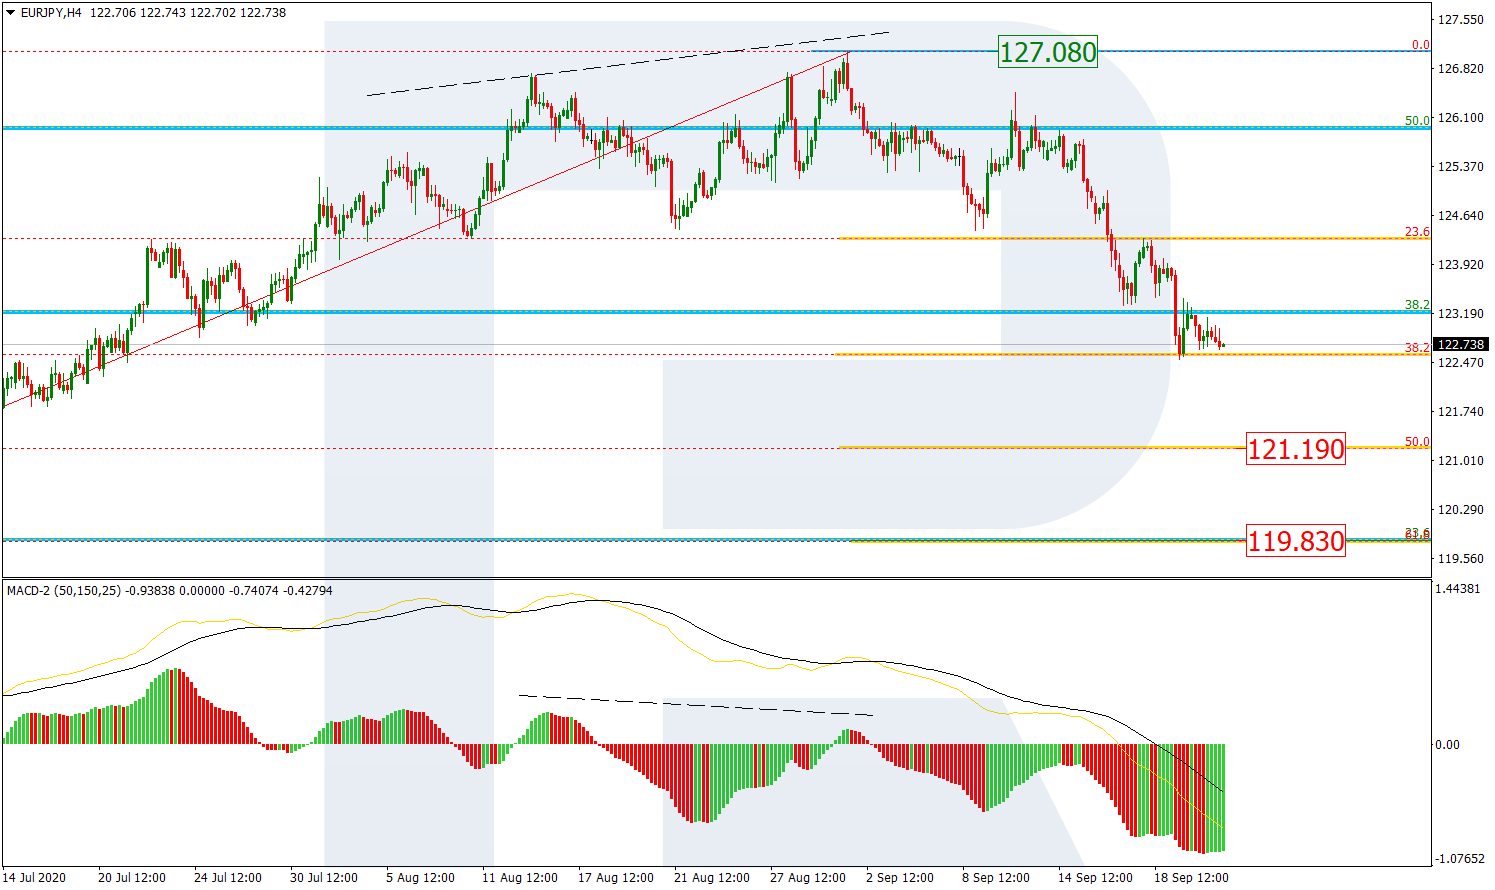
As we can see in the H4 chart, after a breakout of 50.0% fibo and a divergence on MACD, EURJPY is still correcting to the downside and has already reached 38.2% fibo and rebounded from it. Possibly, the pair may trade sideways around this level but after finishing this short-term correction it is expected to resume falling towards 50.0% and 61.8% fibo at 121.19 and 119.83 respectively. The resistance is the high at 127.08.

EURJPY_H4
Risk Warning: the result of previous trading operations do not guarantee the same results in the future

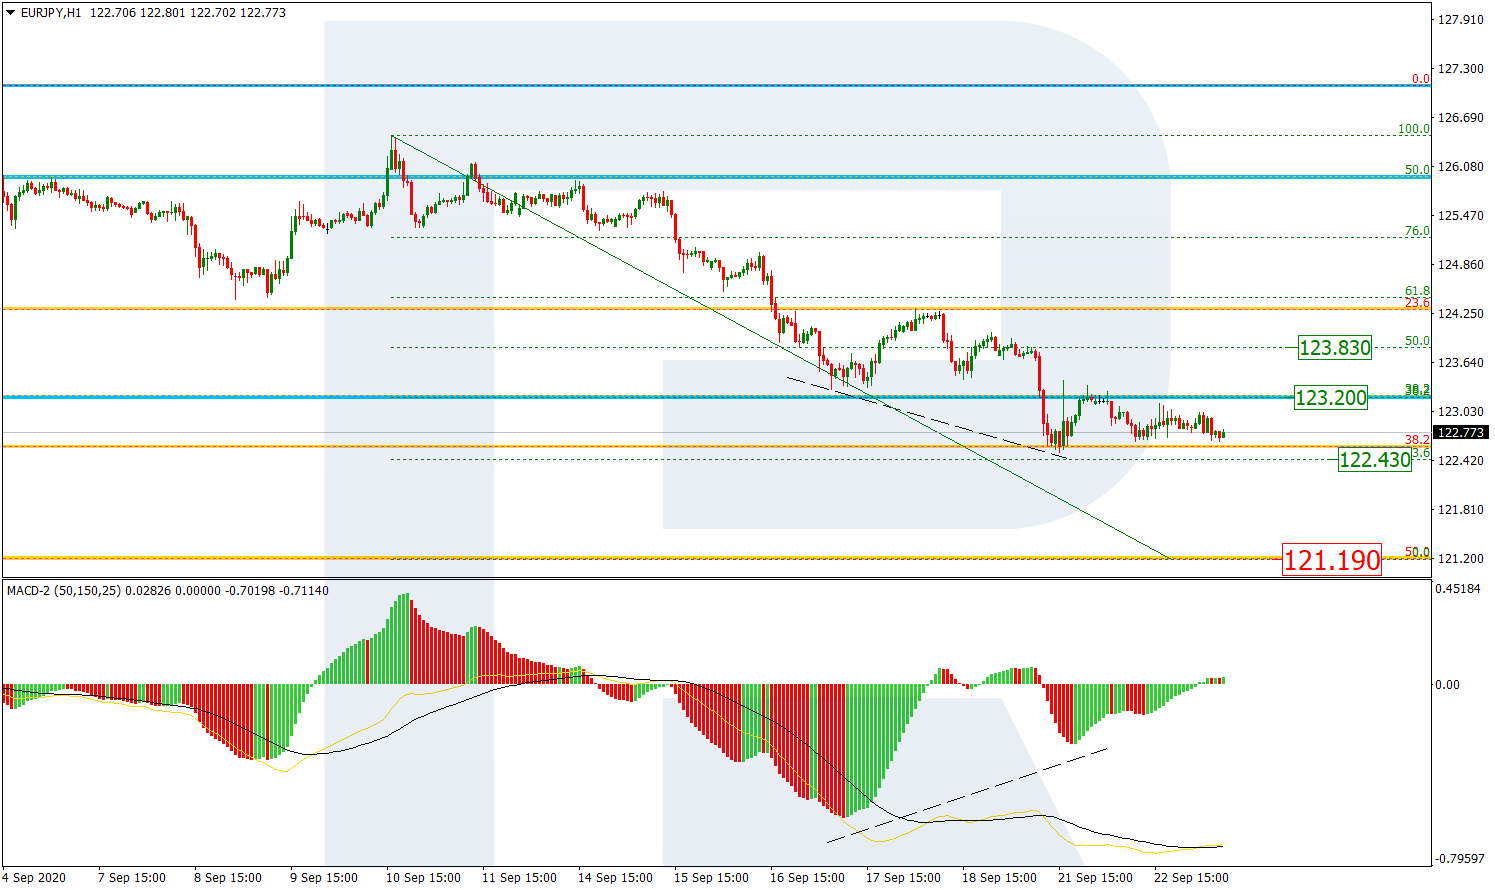
In the H1 chart, the pair was stopped at 38.2% fibo by the convergence on MACD, which may indicate a possible pullback. In this case, the instrument is expected to fall towards 50.0% fibo at 121.19, rebound from it, and then start a new correction to the upside. The targets are 23.6%, 38.2%, and 50.0% fibo at 122.43, 123.20, and 123.83 respectively.

EURJPY_H1

Article By RoboForex.com

Attention!
Forecasts presented in this section only reflect the author’s private opinion and should not be considered as guidance for trading. RoboForex LP bears no responsibility for trading results based on trading recommendations described in these analytical reviews.

Forex Technical Analysis & Forecast 23.09.2020

Article By RoboForex.com

EURUSD, “Euro vs US Dollar”

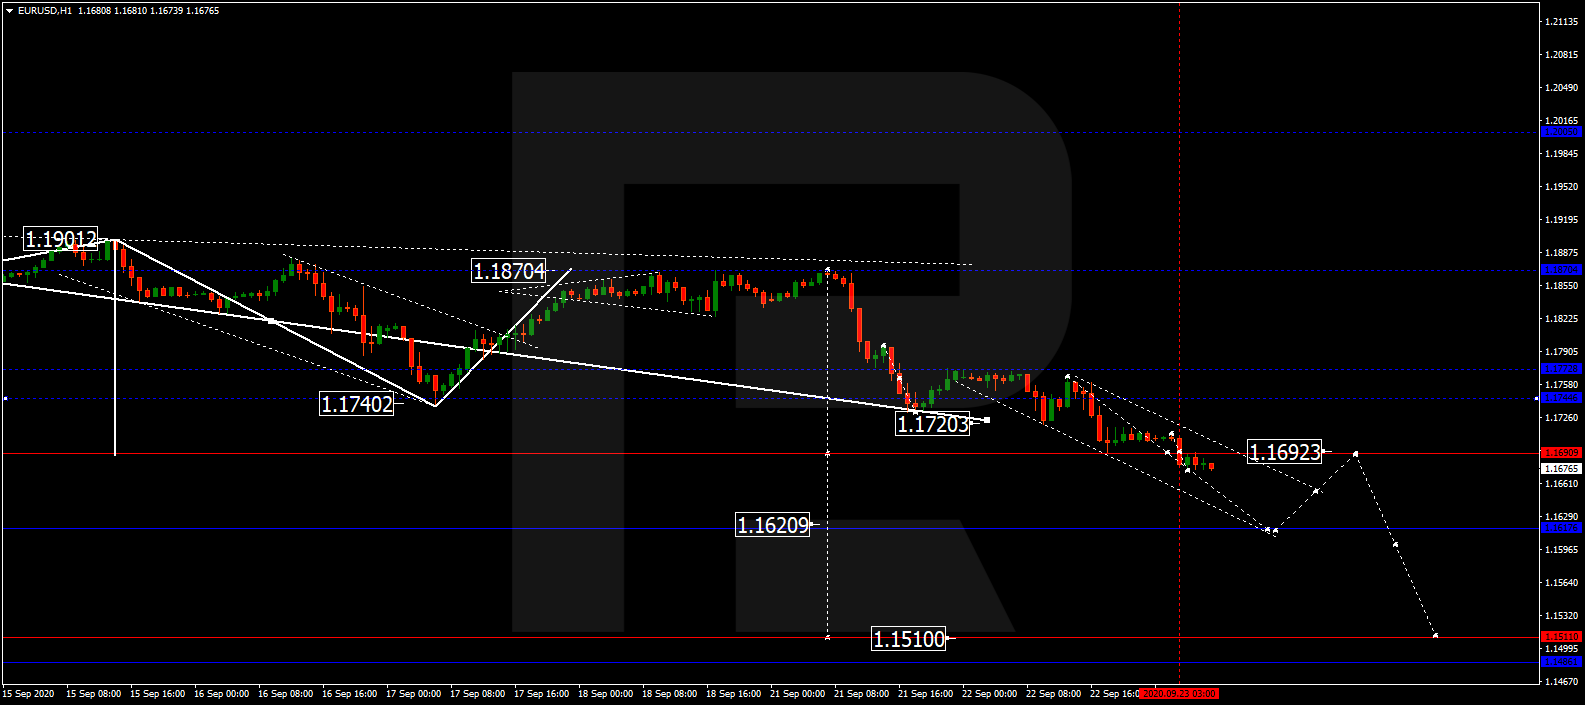
After completing the descending wave at 1.1720, EURUSD has finished the correction to test 1.1736 from below; right now, it is still falling towards 1.1620. After that, the instrument may start another correction to return to 1.1736 and then resume trading within the downtrend with the short-term target at 1.1585.

EURUSD
Risk Warning: the result of previous trading operations do not guarantee the same results in the future

GBPUSD, “Great Britain Pound vs US Dollar”

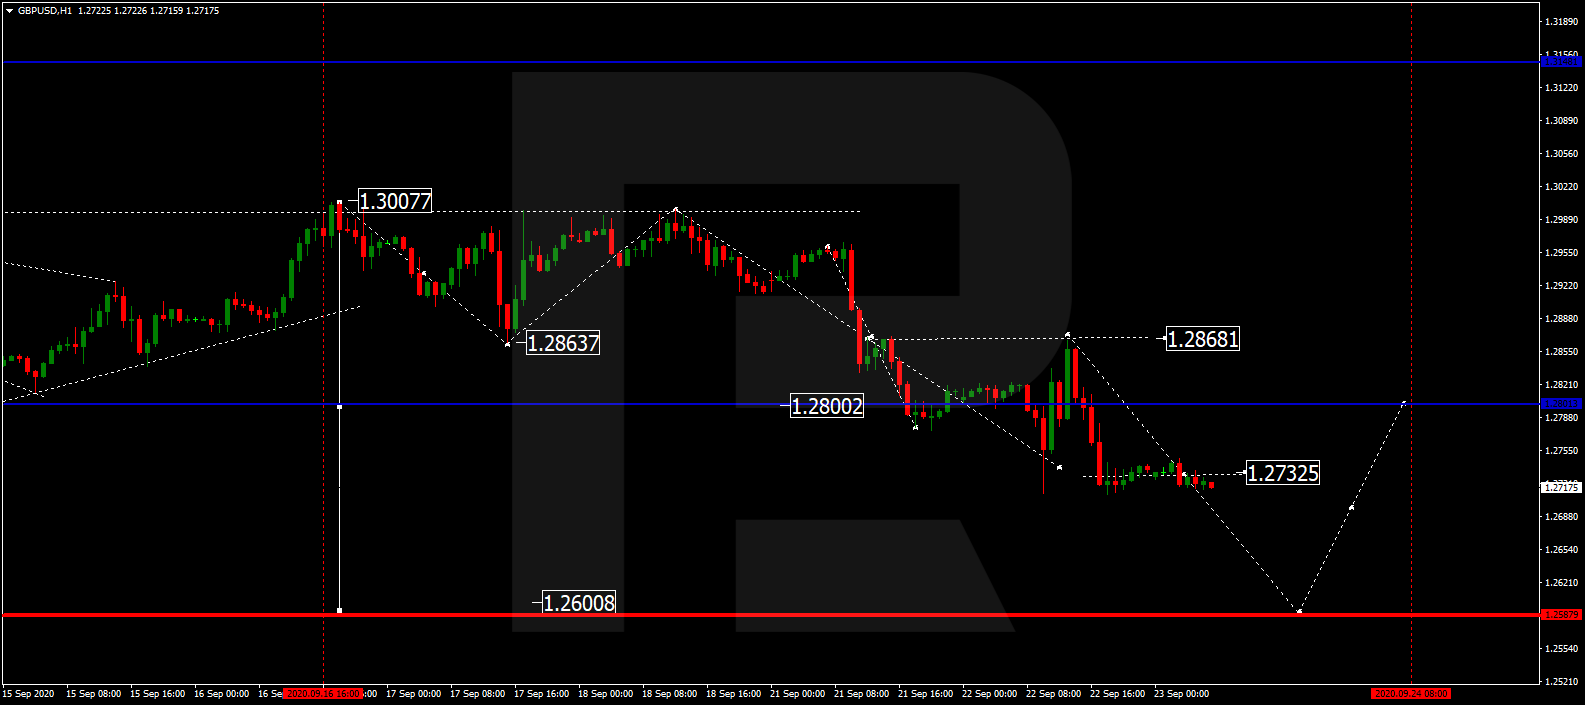
GBPUSD is still consolidating around 1,2732. Today, the pair may continue moving inside the downtrend with the target at 1.2600. Later, the market may start a new correction to reach 1.2800.

GBPUSD
Risk Warning: the result of previous trading operations do not guarantee the same results in the future

USDRUB, “US Dollar vs Russian Ruble”

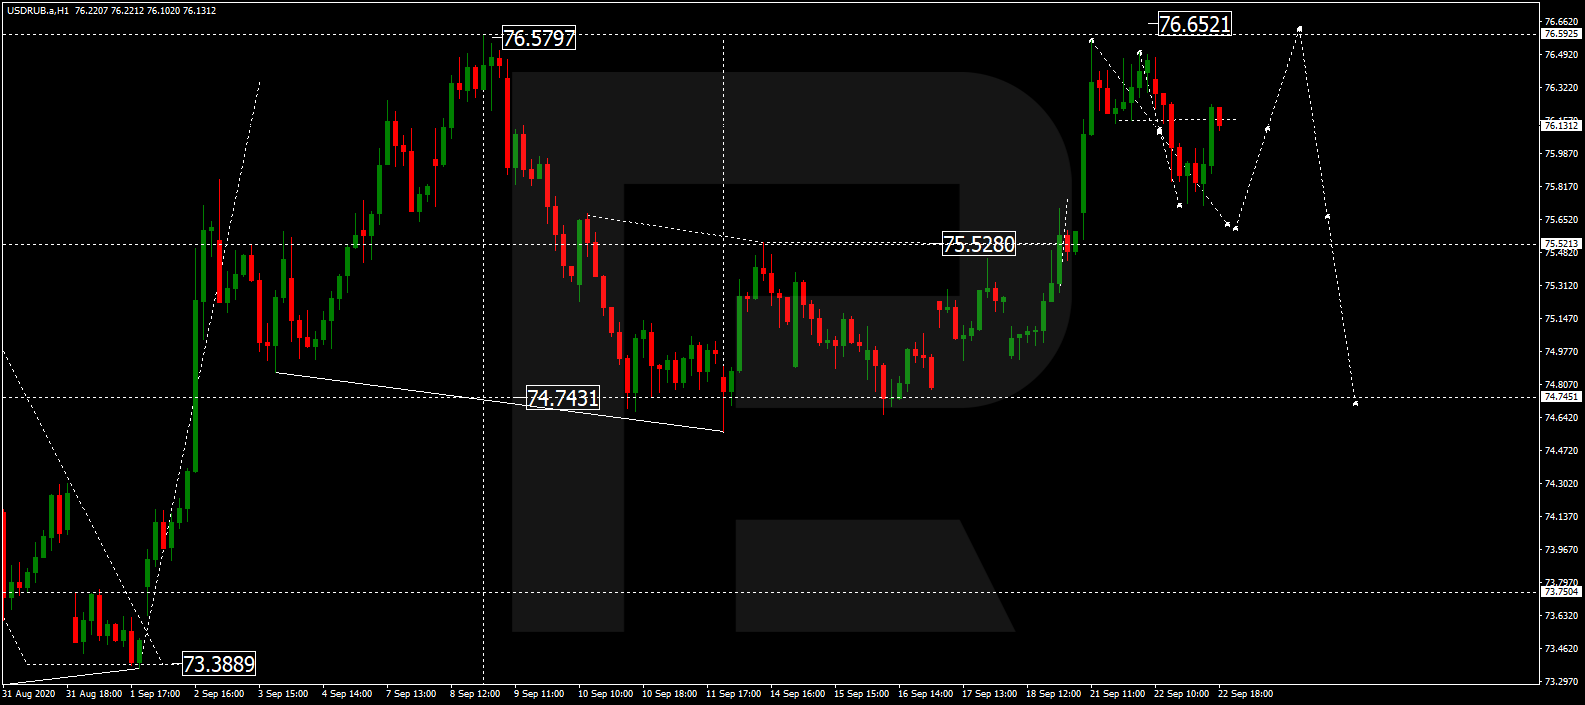
USDRUB is still consolidating around 76.00. Possibly, the pair may expand the range up to 76.65 and then resume falling to break 75.50. After that, the instrument may continue trading downwards with the target at 74.74 or even 72.80.

USDRUB
Risk Warning: the result of previous trading operations do not guarantee the same results in the future

USDJPY, “US Dollar vs Japanese Yen”

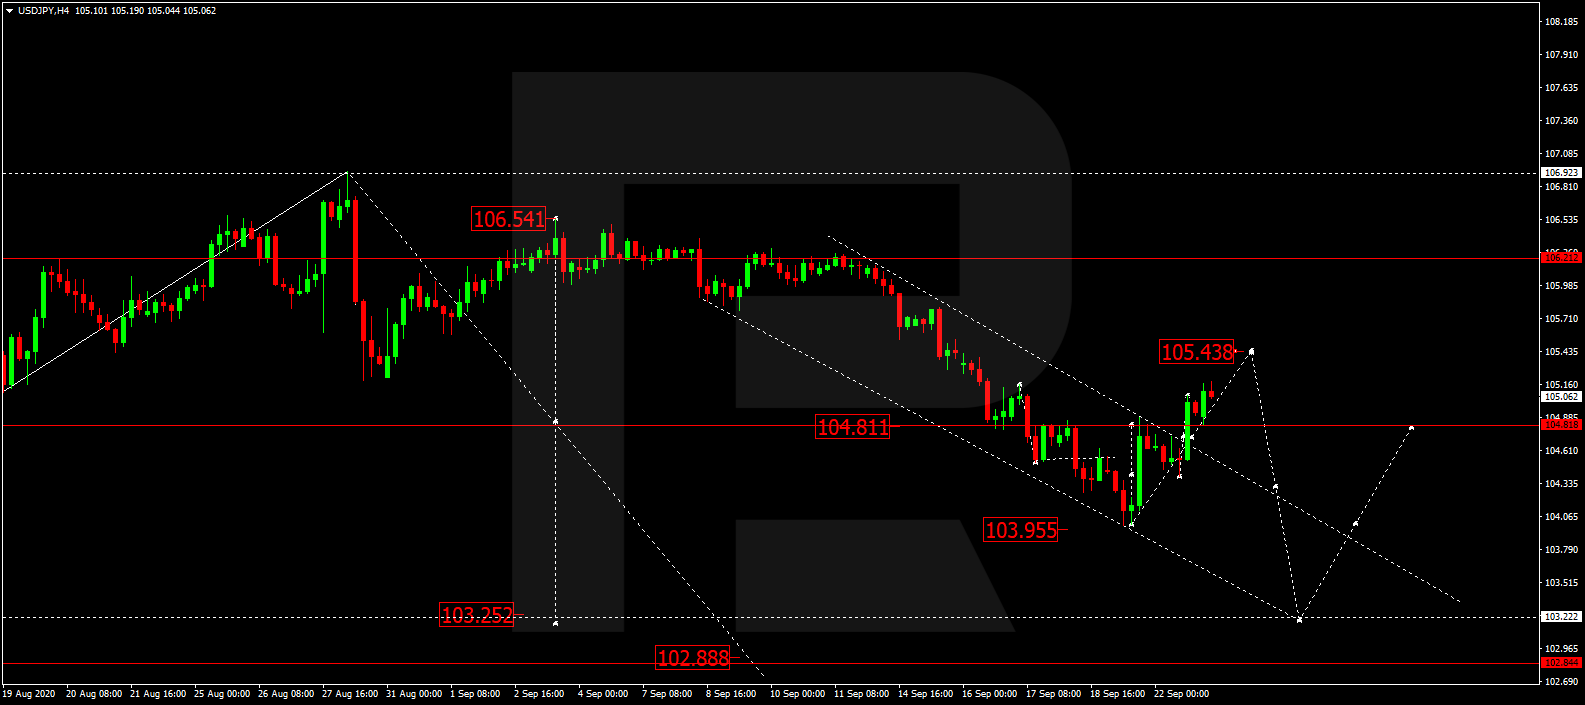
After testing 104.81 from below, USDJPY is consolidating around this level. Possibly, today the pair may continue the correction to reach 105.44 and then resume falling inside the downtrend with the target at 103.25.

USDJPY
Risk Warning: the result of previous trading operations do not guarantee the same results in the future

USDCHF, “US Dollar vs Swiss Franc”

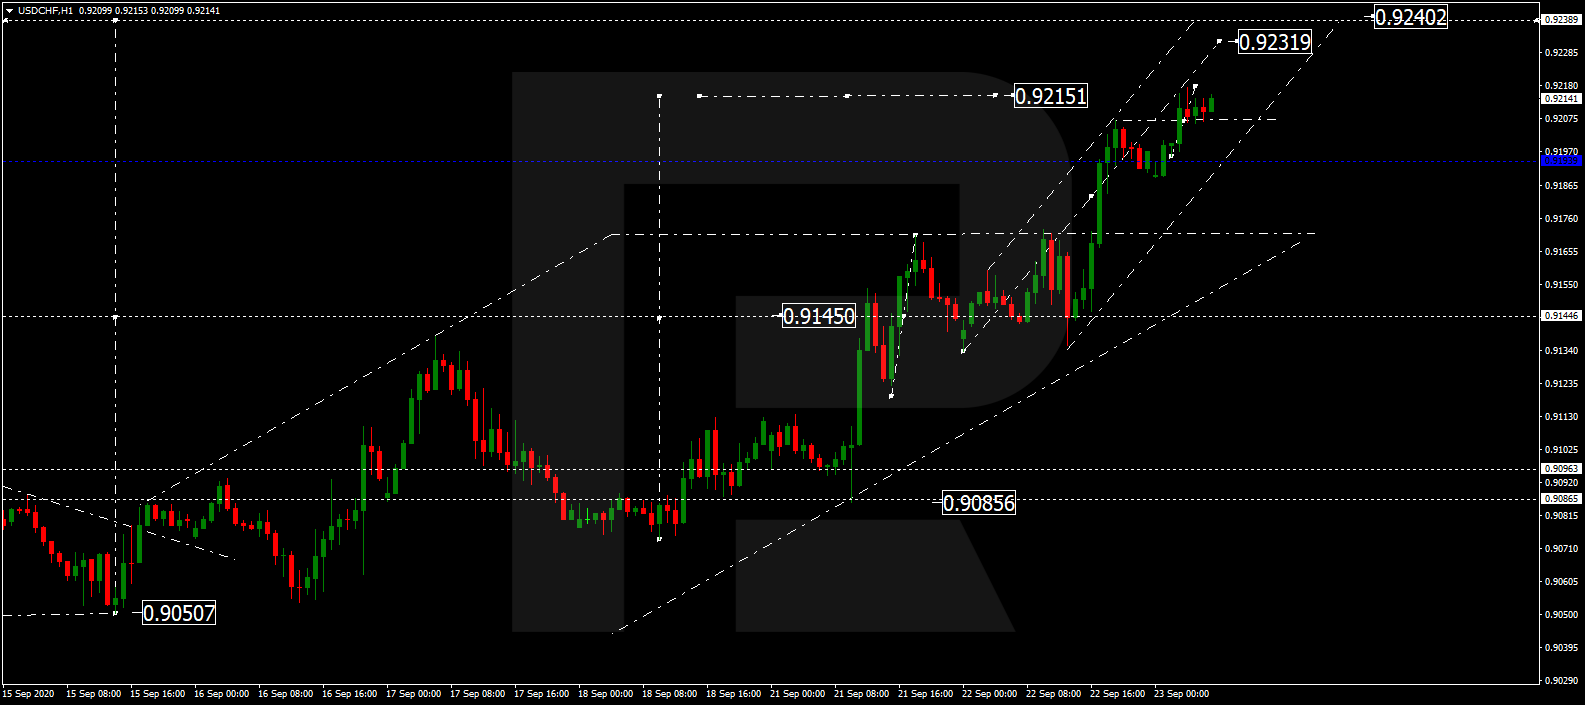
After finishing the ascending structure at 0.9215, USDCHF is consolidating below this level. Possibly, the pair may correct towards 0.9190 and then form one more ascending structure within the uptrend to reach 0.9230 or even 0.9240.

USDCHF
Risk Warning: the result of previous trading operations do not guarantee the same results in the future

AUDUSD, “Australian Dollar vs US Dollar”

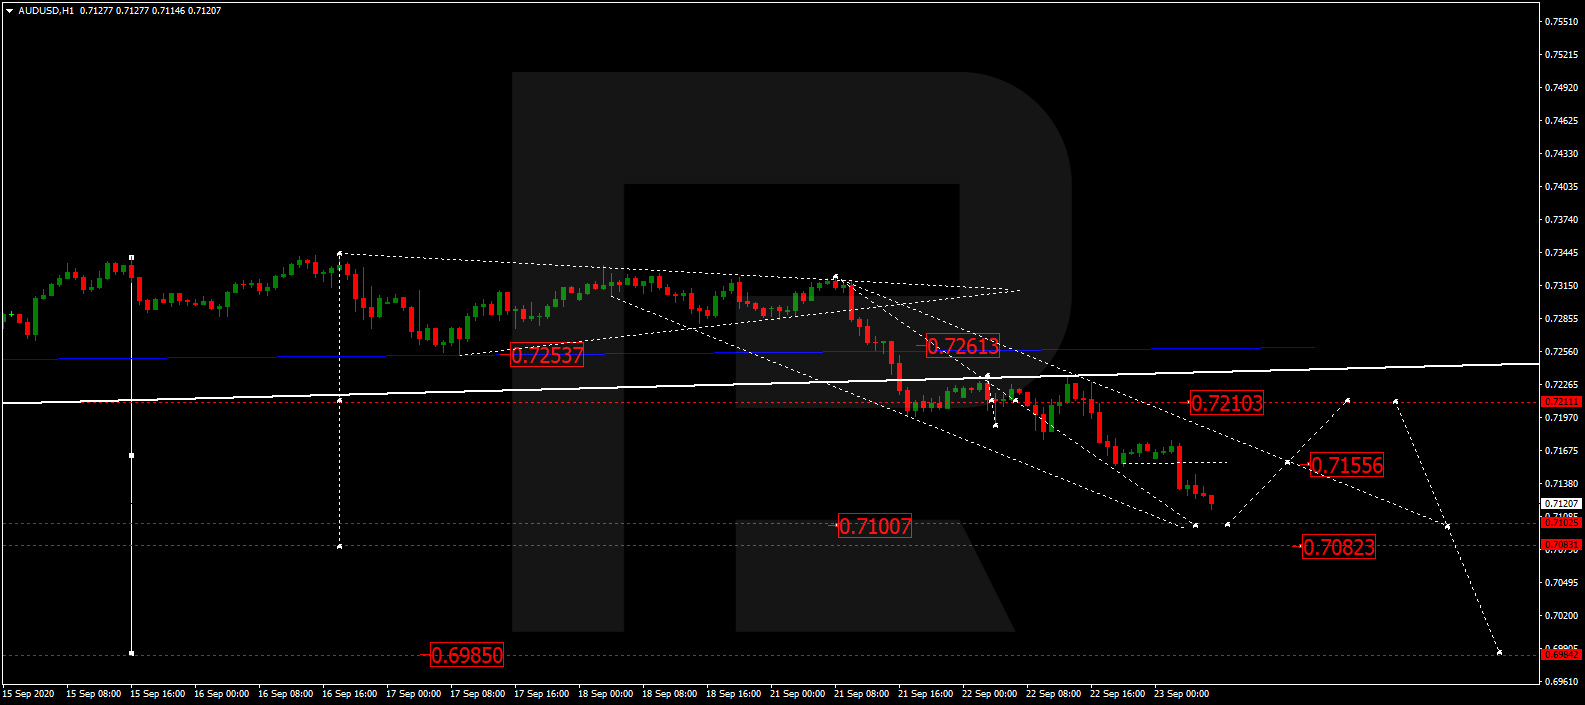
After completing the descending wave at 0.7160, AUDUSD had broken this level to the downside and may continue falling towards 0.7100. After that, the instrument may correct to reach 0.7200 and then resume trading downwards with the target at 0.7082.

AUDUSD
Risk Warning: the result of previous trading operations do not guarantee the same results in the future

BRENT

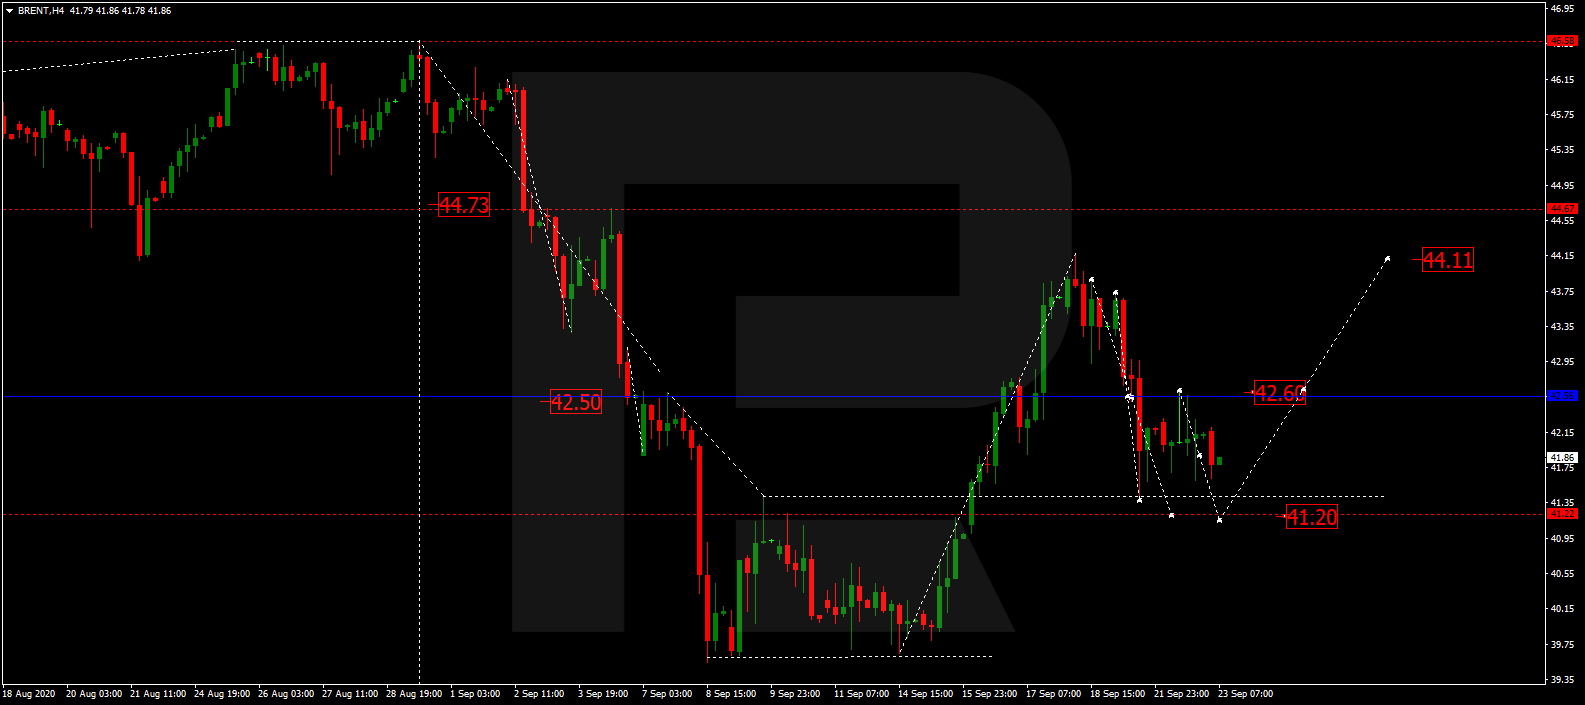
After finishing the ascending structure at 42.60, Brent is correcting downwards. Possibly, today the asset may reach 41.20. Later, the market may start a new growth towards 44.11 or even 44.70.

BRENT
Risk Warning: the result of previous trading operations do not guarantee the same results in the future

XAUUSD, “Gold vs US Dollar”

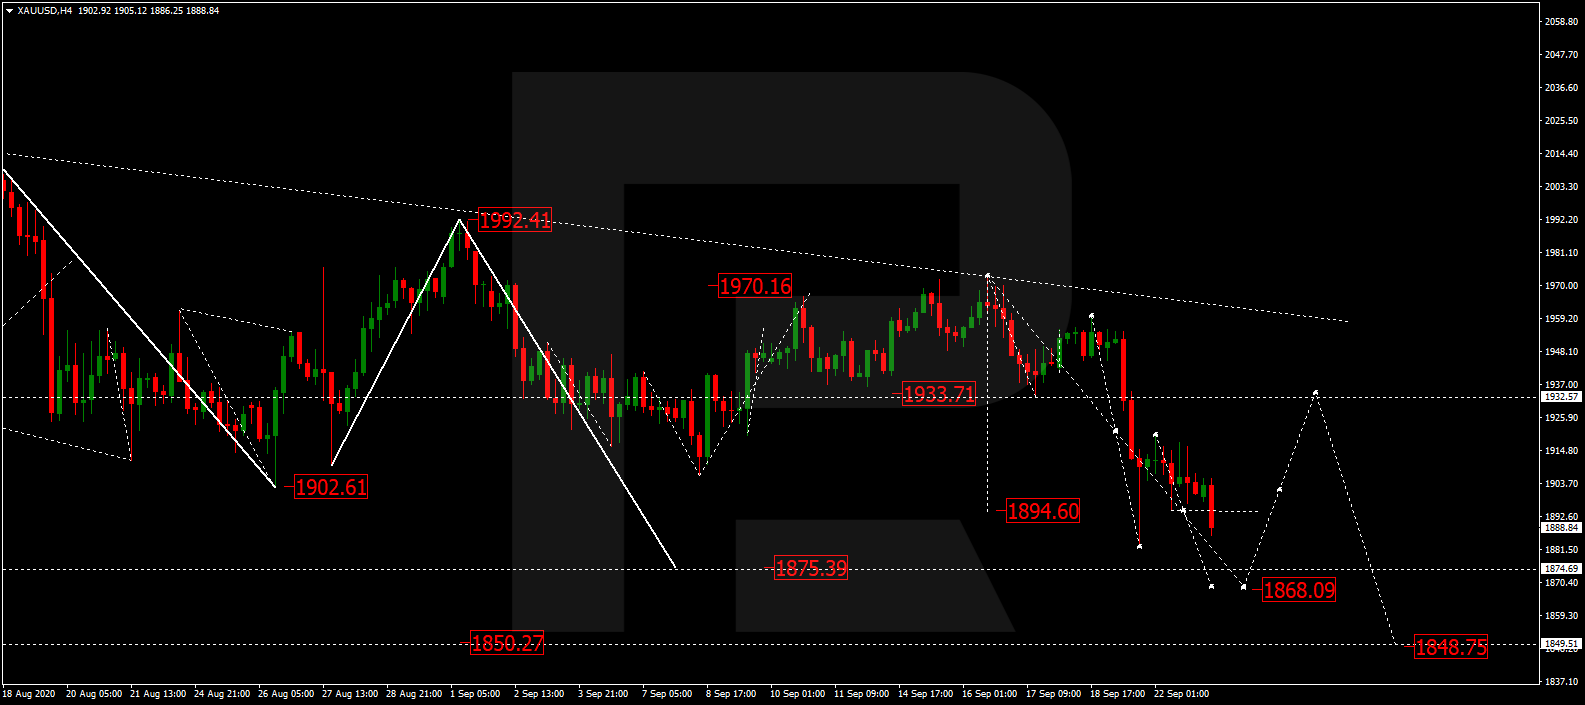
After breaking 1892.60 to the downside, Gold is still falling to reach 1860.00. After that, the instrument may correct towards 1933.50 and resume trading within the downtrend with the target at 1850.00.

GOLD
Risk Warning: the result of previous trading operations do not guarantee the same results in the future

BTCUSD, “Bitcoin vs US Dollar”

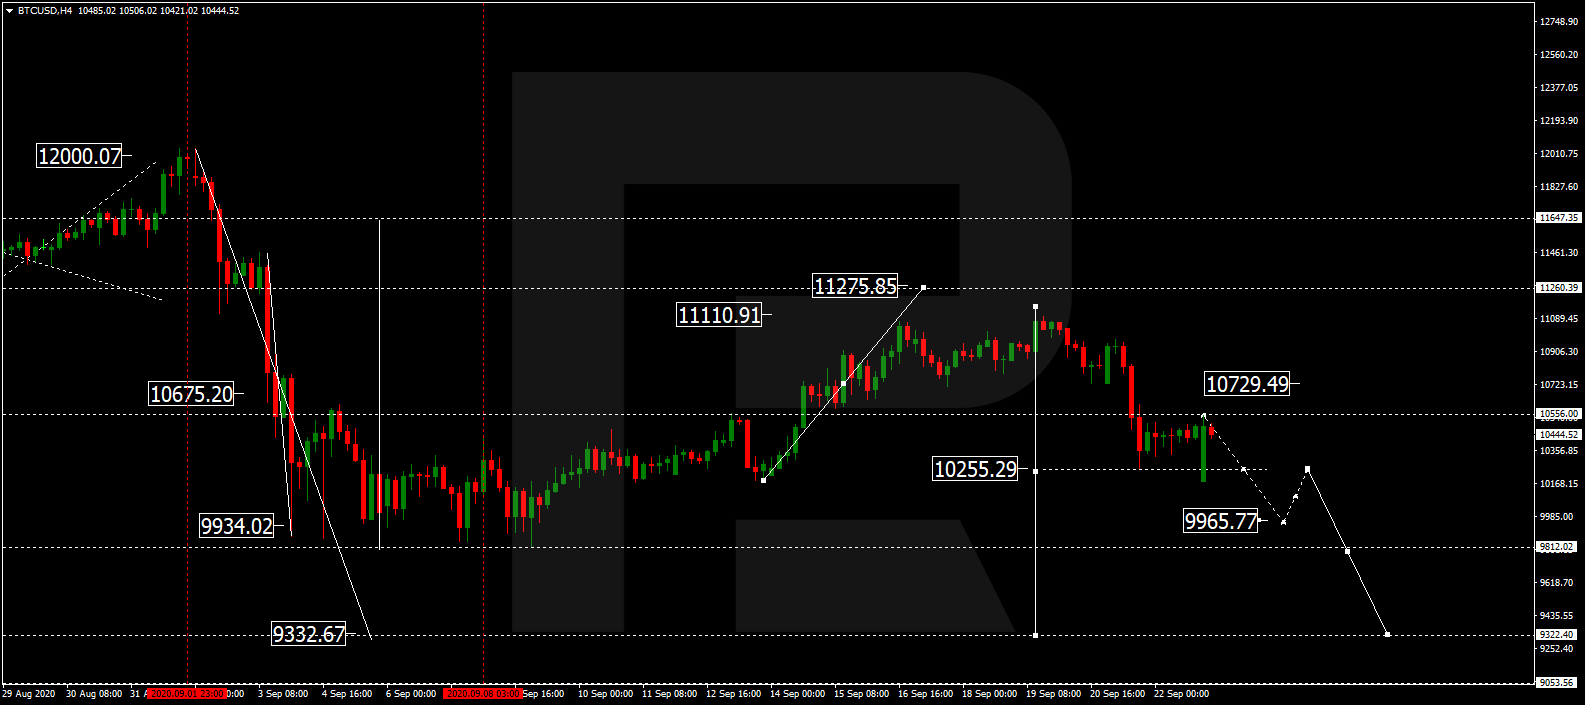
After returning to 10550.00, BTCUSD is expected to continue falling to break 10220.00. Later, the market may continue trading downwards with the target at 9333.00.

BITCOIN
Risk Warning: the result of previous trading operations do not guarantee the same results in the future

S&P 500

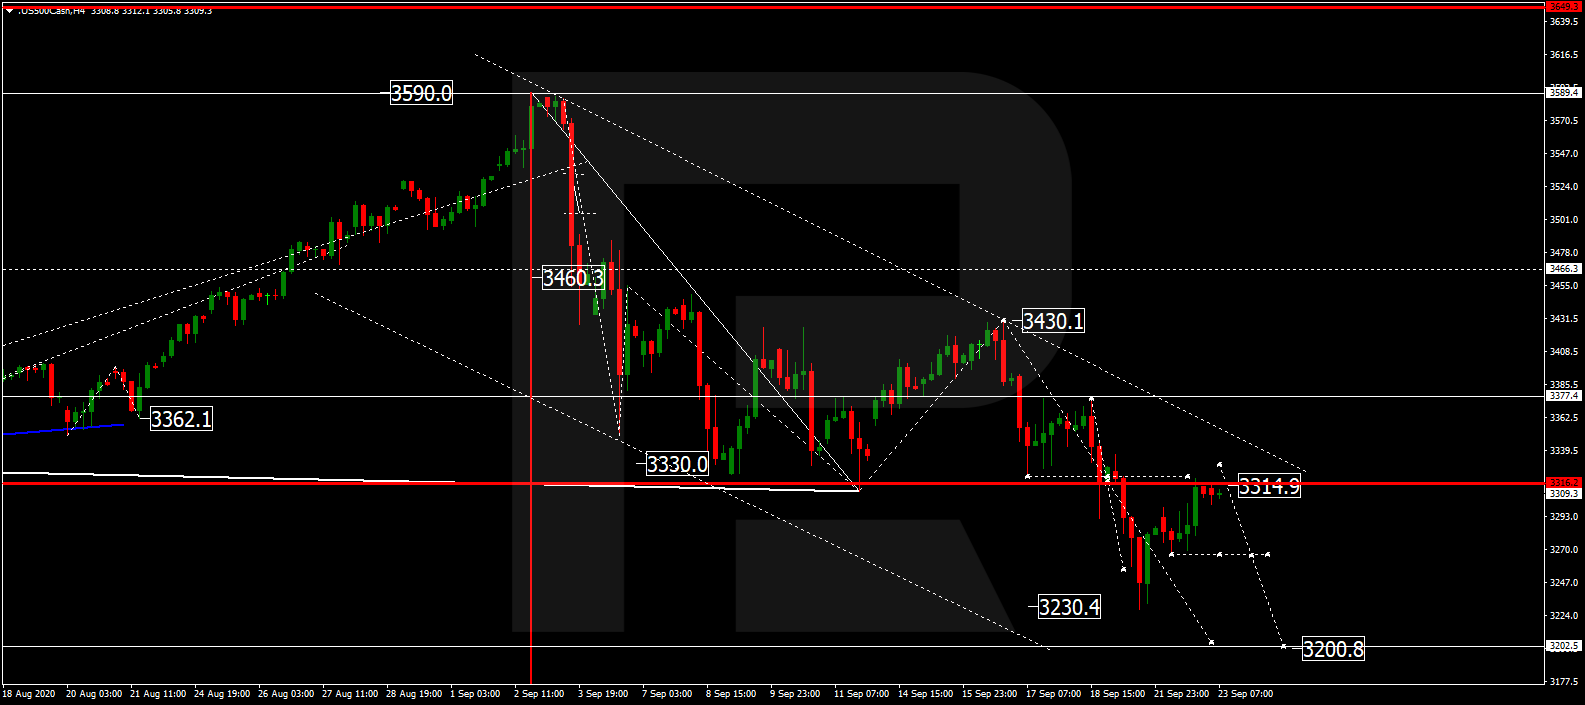
After finishing the ascending structure to test 3315.0 from below, the S&P index is expected to form a new descending wave towards 3200.8. After that, the instrument may start another correction with the target at 3230.3.

S&P 500

Article By RoboForex.com

Attention!
Forecasts presented in this section only reflect the author’s private opinion and should not be considered as guidance for trading. RoboForex LP bears no responsibility for trading results based on trading recommendations described in these analytical reviews.

Speech by the US Fed Chair is expected today

By IFCMarkets.com

Top daily news

The dollar is strengthening in anticipation of a future Fed rate hike. American stock indices are growing pending the economic aid package will amount to $1.5 trillion, and not $500 billion as previously assumed.

Forex news

Currency PairChange
EUR USD+0.06%
GBP USD+0.05%
USD JPY+0.07%

The US dollar index is growing today for the third day in a row. The main reason for this is the Fed’s view that further quantitative easing is unlikely to provide significant additional support to the American economy. In particular, this was stated by Charles Evans – the head of the Federal Reserve Bank of Chicago. He also added that the Fed could raise the rate (0.25%) without waiting for inflation to grow to 2%. Recall that in August, consumer price growth in the United States reached 1.3% on an annualized basis, and this is the maximum since January this year (before the coronavirus pandemic). The next Fed meeting, however, will not be soon – November 5. Now the dollar was additionally supported by excellent data on the secondary real estate market for August. Existing home sales reached the maximum of 14 years and amounted to 6 million. The third factor behind the strengthening of the US dollar index was the increase in the number of new coronavirus cases in France, Spain, Great Britain, and other European countries. This increases global risks and boosts the attractiveness of the greenback. Markit Manufacturing PMI Flash (preliminary forecast is positive) report will be released in the US today, and Fed Chairman Jerome Powell will deliver a speech.

Stock Market news

IndicesChange
Dow Jones Index+0.52%
S&P 500+1.05%
Nasdaq 100+1.71%
Nikkei Index-0.07%
DE 30+1.68%

On Tuesday, US stocks rose for the first time after 4 days of continuous decline. In addition to positive data on the American secondary housing market, this was facilitated by rumors that the new American economy aid package could amount to $1.5 trillion, and not $500 billion as the Republicans had previously proposed. The S&P 500 advance was led by Twitter (+ 7.1%) and Amazon.com (+ 5.7%) stocks. US stock index futures continue to rise this morning in anticipation of positive Markit Manufacturing PMI data for September. Investors also expect Fed Chairman Jerome Powell to reaffirm his commitment to current monetary policy and maintain the current QE volume until at least the next Fed meeting in November.

Commodity Market news

CommoditiesChange
WTI Crude+0.8%
Brent Crude Oil+0.89%

World oil prices remain almost unchanged for the second day in a row. They are supported by another storm in the Gulf of Mexico, which disrupted the functioning of a part of the oil refinery and terminals. According to the independent American Petroleum Institute, US oil stocks rose by 691,000 barrels over the week. Official information on reserve changes will be released tonight. It can affect the dynamics of oil prices. The Libyan National Oil Company announced that Libya will increase its oil production by 250 thousand barrels per day starting from next week.

Gold Market News

MetalsChange
Silver/US Dollar-2.95%

Precious metals quotes fell today amid the strengthening US dollar. This is how investors reacted to the positive US macroeconomic data and the outlook for the future Fed rate hike. The gold prices are supported by global risks associated with an increase in the number of coronavirus cases in Europe, as well as plans to assist the American economy in the amount of $1.5 trillion, not $500 billion. Recall that when the $3 trillion aid package was discussed, gold quotations were approaching $2080 an ounce.

Market Analysis provided by IFCMarkets.com

The Analytical Overview of the Main Currency Pairs on 2020.09.23

by JustForex

The EUR/USD currency pair

Technical indicators of the currency pair:
  • Prev Open: 1.17617
  • Open: 1.17057
  • % chg. over the last day: +0.07
  • Day’s range: 1.18564 – 1.18680
  • 52 wk range: 1.0637 – 1.2012

During yesterday’s and today’s trading sessions, EUR/USD quotes are declining. The US dollar is strengthening after the United States House of Representatives has approved a government funding bill that will avoid a shutdown before the presidential election. Yesterday, the Fed Chairman Jerome Powell gave a speech at the Financial Services Committee of the US House of Representatives. According to him, the US economy will recover faster from the crisis with the simultaneous implementation of fiscal and monetary stimulus measures. At the moment, the key support is the level of 1.1670, the key resistance level is 1.1715. We recommend opening positions from these levels.

The news feed on 2020.09.23:
  • – German manufacturing PMI at 10:30 (GMT+3:00);
  • – Manufacturing PMI in the Eurozone at 11:00 (GMT+3:00);
  • – US crude oil inventories at 17:30 (GMT+3:00).

We also recommend paying attention to the speech by the Fed Chairman.

EUR/USD

Indicators point to the power of sellers: the price is being traded below 50 MA and 100 MA.

The MACD histogram is in the negative zone, but above the signal line, which gives a weak signal to sell EUR/USD.

Stochastic Oscillator is in the neutral zone, the %K line is above the %D line, which gives a signal to buy EUR/USD.

Trading recommendations
  • Support levels: 1.1670, 1.1600
  • Resistance levels: 1.1715, 1.1760, 1.1800

If the price fixes below 1.1670, further decline in EUR/USD quotes is expected. The movement is tending to the round level of 1.1600.

An alternative could be the growth of the EUR/USD currency pair to 1.1750-1.1760.

The GBP/USD currency pair

Technical indicators of the currency pair:
  • Prev Open: 1.28043
  • Open: 1.27258
  • % chg. over the last day: -0.65
  • Day’s range: 1.28971 – 1.29640
  • 52 wk range: 1.1409 – 1.3516

The GBP/USD currency pair has been declining during yesterday’s and today’s trading sessions. Yesterday, British Prime Minister Boris Johnson announced the introduction of restrictive measures in England to combat COVID-19, in particular, opening hours for bars and restaurants will be limited, as well as the maximum number of people getting together. However, Johnson noted that a second quarantine is not being introduced in the country, that everyone is not obliged to stay at home, schools and universities will continue to work. At the moment, the key support and resistance levels are 1.2680 and 1.2740, respectively. Positions should be opened from these levels.

The UK news feed on 2020.09.23:
  • – Composite index at 11:30 (GMT+3:00);
  • – Manufacturing PMI at 11:30 (GMT+3:00);
  • – Services PMI at 11:30 (GMT+3:00).
GBP/USD

Indicators point to the power of sellers: the price is being traded below 50 MA and 100 MA.

The MACD histogram is in the negative zone, below the signal line, which gives a strong signal to sell GBP/USD.

Stochastic Oscillator is in the neutral zone, the %K line is crossing the %D line. There are no accurate signals.

Trading recommendations
  • Support levels: 1.2870, 1.2810, 1.2760
  • Resistance levels: 1.2930, 1.2985, 1.3040

If the price fixes below 1.2680, a further decline in GBP/USD quotes is expected. The movement is tending to 1.2650-1.2630.

If the price fixes above the resistance level of 1.2740, GBP/USD quotes are expected to grow to the round level of 1.2800.

The USD/CAD currency pair

Technical indicators of the currency pair:
  • Prev Open: 1.33036
  • Open: 1.33024
  • % chg. over the last day: -0.04
  • Day’s range: 1.32124 – 1.32241
  • 52 wk range: 1.2949 – 1.4669

The USD/CAD currency pair is in a sideways trend. There is no defined trend. At the moment, the key support and resistance levels are 1.3300 and 1.3350, respectively. We recommend paying attention to the dynamics of “black gold” prices. Positions should be opened from key levels.

Today, the news feed in Canada is calm.

USD/CAD

Indicators point to the bullish sentiment: the price is being traded above 50 MA and 100 MA.

The MACD histogram is in the positive zone and above the signal line, which gives a strong signal to buy USD/CAD.

Stochastic Oscillator is in the neutral zone, the %K line is below the %D line, which gives a signal to sell USD/CAD.

Trading recommendations
  • Support levels: 1.3300, 1.3240, 1.3190
  • Resistance levels: 1.3350, 1.3410

If the price fixes above 1.3350, USD/CAD quotes are expected to grow. The movement is tending to 1.3400-1.3410.

An alternative could be a decline in the USD/CAD currency pair to 1.3260-1.3240.

The USD/JPY currency pair

Technical indicators of the currency pair:
  • Prev Open: 104.712
  • Open: 104.473
  • % chg. over the last day: -0.01
  • Day’s range: 104.076 – 104.210
  • 52 wk range: 101.19 – 112.41

During yesterday’s trading session, the USD/JPY currency pair increased. The quotes have risen by more than 60 points. At the moment, the local support and resistance levels are 104.80 and 105.20, respectively. Further growth of the trading instrument is possible. We recommend paying attention to the dynamics of US government bonds yield. Positions should be opened from key levels.

Investors expect a report on the monetary policy of the Bank of Japan.

USD/JPY

Indicators do not give accurate signals: 50 MA has crossed 100 MA.

The MACD histogram is in the positive zone, below the signal line, which gives a weak signal to buy USD/JPY.

Stochastic Oscillator is in the neutral zone, the %K line is crossing the %D line. There are no signals at the moment.

Trading recommendations
  • Support levels: 104.80, 104.35, 104.00
  • Resistance levels: 105.20, 105.70, 106.10

If the price fixes above the level of 105.70, further growth in USD/JPY quotes is expected. The movement is tending to 106.10-106.30.

An alternative could be the correction of the USD/JPY currency pair to the round level of 104.00.

by JustForex


This article reflects a personal opinion and should not be interpreted as an investment advice, and/or offer, and/or a persistent request for carrying out financial transactions, and/or a guarantee, and/or a forecast of future events.

AUDUSD Analysis: Reserve Bank of Australia does not rule out a further rate cut

By IFCMarkets.com

Reserve Bank of Australia does not rule out a further rate cut

A downward movement signifies the weakening of the Australian dollar against the greenback. The current RBA rate is 0.25%. Its regular meeting is scheduled for October 6, 2020. Commonwealth Bank Australian PMIs for September are due early Wednesday morning. Their forecasts are negative, which could negatively affect the Australian dollar rate.

IndicatorVALUESignal
RSINeutral
MACDSell
MA(200)Neutral
FractalsSell
Parabolic SARSell
Bollinger BandsNeutral


Summary of technical analysis

OrderSell
Buy stopBelow 0.715
Stop lossAbove 0.741


Market Analysis provided by IFCMarkets.com

Gold bulls ready for take-off to above 2,000 USD soon?

By Admiral Markets

Economic Events September 23, 2020

Source: Economic Events September 23, 2020 – Admiral Markets’ Forex Calendar

After Equities saw a very rough start into the week and Gold also saw some selling pressure with the yellow metal attacking the 1,900 USD mark, we suspect precious metals, especially Gold, will become more and more attractive again from a Long perspective.

With FANGMAN (Facebook, Amazon, Netflix, Google, Microsoft, Apple and Nvidia) having lost significantly more than 1 trillion in market cap since the beginning of September, it’s becoming more and more obvious again how dependent Equity markets are on the FED’s liquidity.

But the thing is: the US central bank ballooned its balance sheet from roughly $4 trillion to a peak of just over $7 trillion between March and June. Since then, its growth has stalled.

And after FED chairman Powell didn’t signal an imminent adjustment in the scope nor scale of their QE program last week on Wednesday, the bearish momentum in Equities accelerated.

That said, the current question seems to be: “How long till the FED will step in again?”

Consider the following:

  • Smaller-sized corporations haven’t profited that much from the recent run to new highs in US equities
  • Democrats and Republicans are having trouble agreeing on another Corona relief package

As such, the answer might be “Quite soon”.

That leaves us with the conclusion that the current bearish price action in Gold might be a “shake-out” before the FED again aggressively expands its balance sheet, thus pushing Gold substantially higher and back above 2,000 USD.

Still, we are considering the technical picture to be neutral between 1,865 and 2,075 USD, with a clearer bullish sign to be sent once we break above the short-term zone of resistance around 1,970 USD.

On the other, we don’t want to rule out that we get to see another short run to below 1,900 USD before taking on bullish momentum again:

Admiral Markets MT5 with MT5SE Add-on Gold Daily chart

Source: Admiral Markets MT5 with MT5SE Add-on Gold Daily chart (between May 09, 2019, to September 21, 2020). Accessed: September 21, 2020, at 10:00 PM GMT – Please note: Past performance is not a reliable indicator of future results, or future performance.

In 2015, the value of Gold fell by 10.4%, in 2016, it increased by 8.1%, in 2017, it increased by 13.1%, in 2018, it fell by 1.6%, and in 2019, it increased by 18.9%, meaning that in five years, it was up by 28%.

Discover the world’s #1 multi-asset platform

Admiral Markets offers professional traders the ability to trade with a custom, upgraded version of MetaTrader 5, allowing you to experience trading at a significantly higher, more rewarding level. Experience benefits such as the addition of the Market Heat Map, so you can compare various currency pairs to see which ones might be lucrative investments, access real-time trading data, and so much more. Click the banner below to start your FREE download of MT5!

Trade With MetaTrader 5

Disclaimer: The given data provides additional information regarding all analysis, estimates, prognosis, forecasts or other similar assessments or information (hereinafter “Analysis”) published on the website of Admiral Markets. Before making any investment decisions please pay close attention to the following:

  1. This is a marketing communication. The analysis is published for informative purposes only and is in no way to be construed as investment advice or recommendation. It has not been prepared in accordance with legal requirements designed to promote the independence of investment research, and that it is not subject to any prohibition on dealing ahead of the dissemination of investment research.
  2. Any investment decision is made by each client alone whereas Admiral Markets shall not be responsible for any loss or damage arising from any such decision, whether or not based on the Analysis.
  3. Each of the Analysis is prepared by an independent analyst (Jens Klatt, Professional Trader and Analyst, hereinafter “Author”) based on the Author’s personal estimations.
  4. To ensure that the interests of the clients would be protected and objectivity of the Analysis would not be damaged Admiral Markets has established relevant internal procedures for prevention and management of conflicts of interest.
  5. Whilst every reasonable effort is taken to ensure that all sources of the Analysis are reliable and that all information is presented, as much as possible, in an understandable, timely, precise and complete manner, Admiral Markets does not guarantee the accuracy or completeness of any information contained within the Analysis. The presented figures that refer to any past performance is not a reliable indicator of future results.
  6. The contents of the Analysis should not be construed as an express or implied promise, guarantee or implication by Admiral Markets that the client shall profit from the strategies therein or that losses in connection therewith may or shall be limited.
  7. Any kind of previous or modelled performance of financial instruments indicated within the Publication should not be construed as an express or implied promise, guarantee or implication by Admiral Markets for any future performance. The value of the financial instrument may both increase and decrease and the preservation of the asset value is not guaranteed.
  8. The projections included in the Analysis may be subject to additional fees, taxes or other charges, depending on the subject of the Publication. The price list applicable to the services provided by Admiral Markets is publicly available from the website of Admiral Markets.
  9. Leveraged products (including contracts for difference) are speculative in nature and may result in losses or profit. Before you start trading, you should make sure that you understand all the risks.

By Admiral Markets

PMI day for Europe, UK & United States

By Lukman Otunuga, Research Analyst, ForexTime

Grab your popcorn and find a cosy seat ahead of the latest Purchasing Manager Index (PMI) data from Europe, United Kingdom and the US which could spark volatility in the FX space.

The PMI is a leading indicator of economic health which essentially surveys purchasing managers at businesses that make up a given sector. Digging deeper, the headline PMI is a number from 0 to 100. Anything above 50 represents an expansion when compared with the previous month while under 50 represents a contraction.

It is worth keeping in mind that the direction of the PMI tends to precede changes in the trend of estimates such as gross domestic product and employment. If the PMI is painting an unpleasant picture, this could be an early warning sign for the economy and currency. Alternatively, a positive print has the potential to boost sentiment and raise confidence over the economic outlook.

All eyes on the Euro PMI 

European investors will be keeping a very close eye on the latest eurozone purchasing manager’s index (PMI) data for September.

It will be released at 9 am London time and could offer some insight into the health of the region’s services and manufacturing industries in the face of Brexit related uncertainty and second wave of COVID-19 cases. Manufacturing PMI is expected to jump 51.9 in September from the 51.7 in the previous month while services PMI are projected to remain unchanged at 50.5.

What does this mean for the EURUSD?

The Euro has been punished by a resurgent Dollar this week with prices slipping to a two-month low under 1.1675.

A positive set of PMI figures from Europe could inject Euro bulls with enough inspiration to fight back, potentially pushing prices back towards 1.1750. However, if the data fails to meet expectations, the EURUSD could end up sinking to a fresh two month low around 1.1600.

Will pending PMI compound to Pounds woes?

Sterling has woken up on the wrong side of the bed today, weakening against the Dollar and most G10 currencies thanks to Brexit related drama and rising coronavirus cases. Fears over a second lockdown crippling the UK economy remain rife, and this continues to be seen in not only the Pound’s valuation but FTSE100.

The Pounds outlook this week may be influenced by the pending manufacturing and services PMI data due to be released this morning. 

Manufacturing activity is projected to slip to 54.1 compared to the 55.2 in the previous month while services are forecast to decline to 56 from the 58.8 in August. A figure that fails to meet expectations is likely to compound to the Pound’s woes and provide permission for anxious investors to drag the currency lower.

Looking at the technicals, the GBPUSD is approaching 1.2650. A breakdown below this level could open the doors towards 1.2500.

Dollar Index breaks above key resistance 

It took a four-letter word to push the Dollar Index higher, will the pending IHS Markit’s ‘flash’ Purchasing Managers’ Indices for US manufacturing and services in September support the upside? 

Talking technicals, the Dollar Index is turning bullish on the daily timeframe. The solid daily close above 94.00 could encourage a move towards 94.65 and potentially 96.00. Should 94.00 prove to be reliable resistance, the DXY may decline back towards 92.70.

Disclaimer: The content in this article comprises personal opinions and should not be construed as containing personal and/or other investment advice and/or an offer of and/or solicitation for any transactions in financial instruments and/or a guarantee and/or prediction of future performance. ForexTime (FXTM), its affiliates, agents, directors, officers or employees do not guarantee the accuracy, validity, timeliness or completeness, of any information or data made available and assume no liability as to any loss arising from any investment based on the same.


Forex-Time-LogoArticle by ForexTime

ForexTime Ltd (FXTM) is an award winning international online forex broker regulated by CySEC 185/12 www.forextime.com

DXY up at hint of 4-letter word

By Han Tan, Market Analyst, ForexTime

The word “hike”, as it pertains to US interest rates, is a four-letter word dreaded by Dollar bears.

So when Chicago Fed President, Charles Evans, said on Tuesday that the Fed could be raising rates even before US inflation averages two percent, the very thought of it jolted the Dollar index (DXY) above the psychologically-important 94.0 level. The DXY is now trading above its 50-day simple moving average (MA) for the first time since May, with the Greenback advancing against all of its G10 peers, as well as most Asian currencies.

The real yields on 10-year US Treasuries have also breached its 50-day MA for the first time since early June and is moving into the shallower side of minus one percent. This suggests that inflation’s corrosive effects on the Dollar’s purchasing power could be less than feared, which in turn restores some of the Greenback’s appeal.

For context, investors had come to expect US interest rates to remain at these near-zero levels for years, after Fed chair Jerome Powell, at the Jackson Hole Symposium in late August, outlined a shift in the central bank’s thinking towards US inflation. Instead of aiming for a two-percent inflation target, policymakers now are willing to tolerate an overshoot. That involves keeping US interest rates low even amid rising price pressures. Such a seismic shift in the Fed’s stance lent itself to a weaker Dollar.

Hence, when Evans suggested that the Fed “could start raising rates before we start averaging two percent”, it challenges the notion of lower-for-longer US interest rates.

To be fair to the Chicago Fed President, he did say that Fed officials do not yet have an “explicit formula”, and still have to discuss what this new approach actually entails. And such information gaps only leave global investors in the lurch, potentially buffeted by mere hunches instead of solid signals out of the world’s most influential central bank.

And there’s more Fed speak to come for the rest of this week involving about eight top Fed officials, including Fed chair Jerome Powell and Evans who are both due to provide further remarks through Thursday.

Should Fed officials again come across as less-dovish than expected, as some segments of the markets had deemed to be the case after last week’s FOMC meeting, that could spur the Dollar into paring more of its losses from recent months. Such an event could then heap further downward pressure on Gold prices, considering the inverse relationship between the precious metal and the Greenback, and push Bullion visibly below the psychologically-important $1900 mark.


Disclaimer: The content in this article comprises personal opinions and should not be construed as containing personal and/or other investment advice and/or an offer of and/or solicitation for any transactions in financial instruments and/or a guarantee and/or prediction of future performance. ForexTime (FXTM), its affiliates, agents, directors, officers or employees do not guarantee the accuracy, validity, timeliness or completeness, of any information or data made available and assume no liability as to any loss arising from any investment based on the same.


Forex-Time-LogoArticle by ForexTime

ForexTime Ltd (FXTM) is an award winning international online forex broker regulated by CySEC 185/12 www.forextime.com

New Zealand holds policy but stimulus may be needed

By CentralBankNews.info

    New Zealand’s central bank left its benchmark interest rate and its current asset purchase program steady but added that “further monetary stimulus may be needed in order to achieve its remit objectives” as a “severe and prolonged economic downturn would make it difficult to achieve its inflation and employment objectives, and at the same time would pose a material risk to financial stability.”
     The Reserve Bank of New Zealand (RBNZ), which last month expanded its asset purchase program for the second time to lower the interest rates for households and businesses, kept its Official Cash Rate (OCR) at 0.25 percent, unchanged since it was cut by 75 basis points in March.
     In August RBNZ raised its Large Scale Asset Purchase (LSAP) program to up to $100 billion from $60 billion and said it was actively preparing for additional monetary stimulus, such as a Funding for Lending Programme (FLP), a negative OCR and purchases of foreign assets.
     Although the recent outbreak of COVID-19 in New Zealand had now been contained and measures to contain the virus were being relaxed, the bank’s monetary policy committee agreed the pandemic and travel restrictions could have a significant long-term negative effect on the economy, with lower potential growth, and the outlook for inflation and employment remains subdued.
      “There is substantial uncertainty about the future spread of COVID-19 both domestically and globally, and how economic, health and social activity will adapt,” RBNZ said.
     While the contraction of gross domestic product in the second quarter of 12.2 percent from the first quarter was less than expected, it came after a 1.4 percent quarterly contraction in the first quarter, and the balance of risks to the economy remain to the downside.
     At its meeting, the policy committee had discussed the sequencing of how to deploy any additional stimulus, with bank staff advising that deploying FLP with rates near the OCR before the forward guidance period for OCR ends could provide additional stimulus to the economy sooner and this would also provide certainty to financial instituions and speed up the transmission of the programme.
     RBNZ added that members of the committee had agreed they preferred to launch and FLP before the end of 2020 and the banking system is on track to be operationally prepared for negative interest rates by year end.

The Reserve Bank of New Zealand issued the following statement:

“Tēnā koutou katoa, welcome all.

The Monetary Policy Committee agreed to continue with the Large Scale Asset Purchase (LSAP) Programme up to $100 billion. This action is necessary to further lower household and business borrowing rates in order to achieve the Committee’s inflation and employment remit. The Official Cash Rate (OCR) is being held at 0.25 percent in accordance with the guidance issued on 16 March.

Reflecting the possible need for further monetary stimulus, the Committee noted the progress being made on the Bank’s ability to deploy additional monetary instruments. The instruments include a Funding for Lending Programme (FLP), a negative OCR, and purchases of foreign assets. The Committee agreed that these instruments can be mutually supportive in bolstering economic activity. Members also agreed that the alternative instruments can be deployed independently, and noted that the FLP would be ready before the end of this calendar year.

Economic information available since the August Monetary Policy Statement, both international and domestic, has confirmed the level of economic activity remains significantly below that experienced prior to the COVID-19 economic disruption. The ongoing virus-led activity restrictions – most notably in Auckland – had also continued to dampen economic activity, and business and consumer confidence.

Any significant change in the global and domestic economic outlook remain dependent on the containment of the virus, which is highly uncertain. International border restrictions will continue to significantly curtail migration and tourism, and lead to the activity outlook being uneven across industries and regions. Commodity prices for New Zealand’s exports remain robust, but this has been partly offset by the New Zealand dollar exchange rate moderating the return to local export producers.

Ongoing support for domestic economic activity is being provided through significant government spending on business assistance and household income support. This will be accompanied by a rising level of government investment. However, the removal of temporary support policies has commenced. For example, the Wage Subsidy scheme is now closed to new entrants.

In line with the weak underlying international and domestic economic conditions, the Committee expects a rise in unemployment and an increase in firm closures, as resource reallocation continues. Members agreed that monetary policy will need to provide significant economic support for a long time to come to meet the inflation and employment remit, and promote financial stability. They also agreed they are prepared to provide additional stimulus.

Summary record of meeting

The Monetary Policy Committee discussed international and domestic economic and financial market developments. The Committee noted that global economic activity had increased in recent months as social restrictions in some regions had eased, and that the consensus outlook was for a partial recovery in the level of economic activity. Members agreed that the balance of risks to the global economic outlook remained to the downside. The Committee noted that cases of COVID-19 were growing and social restrictions were being reintroduced in some regions of the world, including some areas where the virus had previously appeared to have been reasonably well contained. Members noted that while global monetary and fiscal easing has supported financial and economic conditions, there was a risk that the recent recovery in international activity could stall or reverse if policy stimulus was withdrawn prematurely.

The Committee noted that the August outbreak of COVID-19 in New Zealand appeared to now be contained. Restrictions imposed to contain the virus had constrained economic activity, but were being relaxed. Some members observed that the outbreak had dented confidence, as firms and households are wary of a future outbreak with a subsequent reduction in activity and spending.

The Committee noted the historically unprecedented contraction in economic activity in the June quarter, as measured by the national accounts. The size of the contraction had been smaller than earlier expectations. The Committee noted that some more timely measures of activity had recovered quickly following the easing of restrictions after the initial lockdown, but had dipped again as restrictions were re-introduced, particularly in Auckland. The Committee agreed that the pandemic and associated travel restrictions could have a significant long-term negative impact on the economy, with lower potential growth as resources were gradually redeployed within and between industries. Some members noted that it is also harder to estimate what the maximum sustainable level of employment is under these conditions.

The Committee discussed the recent strength in the housing market. House prices had risen over recent months, in contrast to the Reserve Bank’s baseline scenario which had assumed a decline. Some members noted that economic activity in New Zealand has historically been closely correlated with changes in household wealth, and that a stronger housing market may indicate a stronger recovery in consumer spending and residential construction if sustained. However, other members noted that low population growth and rising unemployment are expected to constrain further house price increases.

Members agreed that the outlook for inflation and employment remained subdued. Members discussed the balance of risks, and agreed that they remained to the downside. There is substantial uncertainty about the future spread of COVID-19 both domestically and globally, and how economic, health, and social activity will adapt.

The Committee discussed the effects of monetary policy easing measures taken so far. Members agreed that the reductions in the OCR, forward guidance, and Large Scale Asset Purchase (LSAP) programme had contributed to lower wholesale, household, and business interest rates, and had kept the exchange rate lower than otherwise. Members noted that the expansion and front-loading of the LSAP programme after the August Statement had contributed to lower government bond yields. They also noted that market participants now believed that it was likely the OCR would be reduced below zero next year, and that this had also contributed to lower wholesale interest rates. The Committee expected lenders to continue to pass through these reductions in wholesale rates to household and business borrowing rates over time.

The Committee reaffirmed that a Funding for Lending Programme (FLP), a lower or negative OCR, purchases of foreign assets, and interest rate swaps remain under consideration. The Committee maintained its view as expressed in the August Statement that a package of an FLP and a lower or negative OCR could provide an effective way to deliver additional monetary stimulus.

The Committee discussed the sequencing of deployment of the components of the package. Members noted staff advice that deploying an FLP before the forward guidance period for holding the OCR ends could provide additional stimulus to the economy sooner. Having an FLP in place earlier would provide certainty to financial institutions planning their funding needs, and speed up the transmission of the programme by allowing banks to replace funding as it matures over time.

The Committee agreed that providing term funding at rates near the OCR via an FLP would lower the financial system’s funding costs, and therefore borrowing costs for firms and households, and support the availability of credit to the economy. The effectiveness of the programme would be influenced by the degree to which financial institutions passed on their funding cost declines to their customers. Members agreed that they preferred to launch an FLP before the end of 2020.

The Committee noted that the banking system is on track to be operationally prepared for negative interest rates by year end. Members agreed with the previous assessment that a lower OCR would be complementary to its other monetary policy tools, and that it was prepared to lower the OCR to provide additional stimulus if required.

The Committee endorsed staff advice to continue front-loading purchases under the LSAP programme, while maintaining flexibility to adjust purchases as market conditions dictate.

The Committee discussed the appropriate settings for monetary policy. It agreed that further monetary stimulus may be needed in order to achieve its remit objectives. The Committee agreed that a severe and prolonged economic downturn would make it difficult to achieve its inflation and employment objectives, and at the same time would pose a material risk to financial stability. Providing sufficient monetary stimulus would therefore both help achieve the Committee’s remit objectives, and promote financial stability.

On Wednesday 23 September, the Committee reached a consensus to:

  • hold the OCR at 0.25 percent, in accordance with the guidance issued on 16 March;
  • maintain the existing LSAP programme of a maximum of $100b by June 2022; and
  • direct the Bank to prepare to have an FLP ready to deploy before the end of this calendar year. Details on the design of the programme would be agreed and published ahead of deployment.

Attendees:
Reserve Bank staff: Adrian Orr, Geoff Bascand, Christian Hawkesby, Yuong Ha
External: Bob Buckle, Peter Harris, Caroline Saunders
Observer: Tim Ng
Secretary: Ross Kendall

Additional information:

www.CentralBankNews.info