Week Ahead: GBPUSD set for end March mayhem?

By ForexTime 

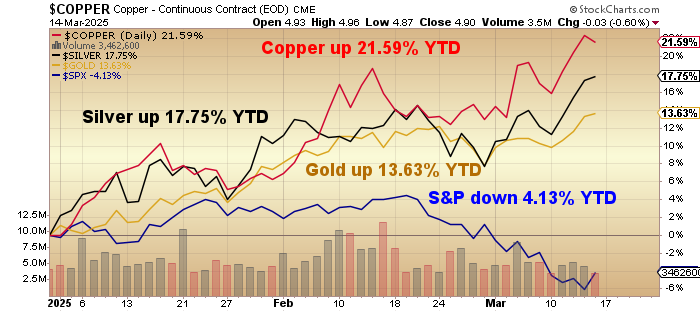
  • GBPUSD ↑ almost 3% MTD
  • Wednesday = UK Spring Statement + UK CPI
  • Over past year UK CPI triggered moves of ↑ 0.5% & ↓ 0.3%
  • Across the Atlantic = Fed speeches + US PCE report 
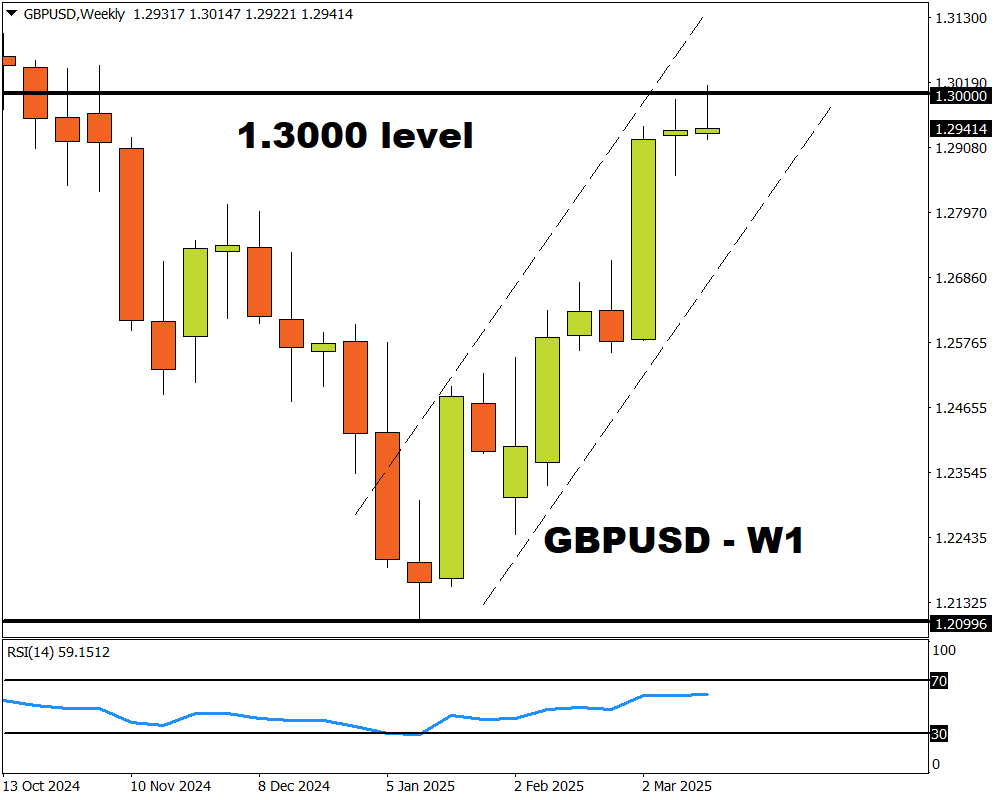
  • Bloomberg FX model: GBPUSD has 75% of trading within 1.2799 – 1.3081 over 1-week period

The week ahead is stacked with high-impact data, political events and speeches by numerous policymakers:


Sunday, 23rd March

  • China Development Forum 2025 in Beijing


Monday, 24th  March 

  • CHINAH: BYD earnings
  • TWN: Taiwan jobless rate
  • GER40: Germany HCOB Manufacturing & Services PMI
  • GBP: UK S&P Global Manufacturing & Services PMI, BoE Governor Bailey speech
  • US500: US S&P Global Manufacturing & Services PMI, Atlanta Fed Bostic speech


Tuesday, 25th  March 

  • Boao Forum for Asia – dubbed “China’s Davos”
  • GER40: Germany IFO business climate
  • MXN: Mexico retail sales, international reserves
  • TWN: Taiwan industrial production
  • RUS2000: US new home sales, Conference Board consumer confidence, New York Fed Williams speech


Wednesday, 26th  March 

  • AUD: Australia CPI
  • CAD: BoC meeting minutes
  • SG20: Singapore industrial production
  • GBP: UK CPI, UK Chancellor Rachel Reeves delivers “spring statement”
  • US500: CBO releases estimate of when US debt will be reached, St. Louis Fed Musalem speech
  • World Economic Forum symposium in Hong Kong


Thursday, 27th March 

  • MXN: Mexico trade, rate decision
  • USDInd: US revised 4Q GDP, initial jobless claims, Richmond Fed Barkin speech


Friday, 28th March 

  • EUR: Eurozone consumer confidence
  • GER40: Germany unemployment
  • JPY: Japan Tokyo CPI
  • GBP: UK Q4 GDP (final), retail sales
  • USDInd: US February PCE report, University of Michigan consumer sentiment, Atlanta Fed Bostic speech


GBPUSD could be set for a week of mayhem due to economic and political forces! 

The major currency pair has struggled to push beyond 1.30 despite the BoE’s slightly hawkish vote split on rates. 

Nevertheless, prices have jumped as much as 7.5% from the mid-January low with month-to-date gains up almost 3%. 

Imagen
GBPUSD W12


Here are 4 things to keep an eye on:


1 – UK Spring Statement

On Wednesday 26th March, Chancellor of the Exchequer Rachel Reeves will present the Spring Statement to Parliament.

Investors will pay close details on key updates concerning the country’s finances, and government plans for tax and public spending. The UK’s growth forecast is set for a major downgrade with Reeves expected to announce huge spending cuts over tax rises. This event will certainly shape sentiment toward the UK economy and British Pound.

  • Sterling is likely to sink if the Spring budget dents optimism over the UK economy and fuels bets around lower UK interest rates.
  • Should the Spring budget soothe investor fears over the UK’s outlook, the pound may rise. 


2 – BoE Bailey Speech + UK February CPI

Just days after the BoE voted to leave rates unchanged, BoE governor Andrew Bailey is scheduled to speak on the UK economy on Monday 24th March. Any fresh insight offered on future policy moves may move the Pound.

But the real market mover for Sterling could be the latest UK inflation figures published on Wednesday 26th March. Signs of cooling price pressures may impact BoE cut bets. 

Annual inflation is expected to cool 2.9% from 3.0%, while the monthly print is seen rising 0.5% from -0.1%.

Over the past 12 months, the UK CPI has triggered upside moves of as much as 0.5% or declines of 0.3% in a 6-hour window post-release.

Note: Beyond the CPI report, the PMI report on Monday and retail sales figures on Friday may provide more insight into the health of the UK economy. Should they disappoint, this could weaken the Pound. The same is true vice-versa.


3- US February PCE report + Fed speeches

Across the Atlantic, a string of speeches by Federal Reserve officials could provide some fresh insight into the Fed’s thinking on rates.

But the Fed’s preferred inflation gauge – the Core Personal Consumption Expenditure on Friday 28th March may sway rate cut bets. 

In the March policy meeting, Powell sought to calm fears over Trump’s tariffs suggesting any rise in prices would be “transitory”. So, this may place extra focus on US inflation reports moving forward, leading to increased market sensitivity.

The PCE core deflator is expected to remain unchanged at 0.3% MoM but rise 2.7% from 2.6% annually. Ultimately signs of sticky price pressures may push back Fed cut bets.

Over the past 12 months, the US PCE report has triggered upside moves as much as 0.6% or declines of 0.8% in a 6-hour window post-release. 

Note: It’s not only the PCE data that move the USD, PMIs, consumer confidence data and initial jobless figures may result in price swings.


4- Technical forces

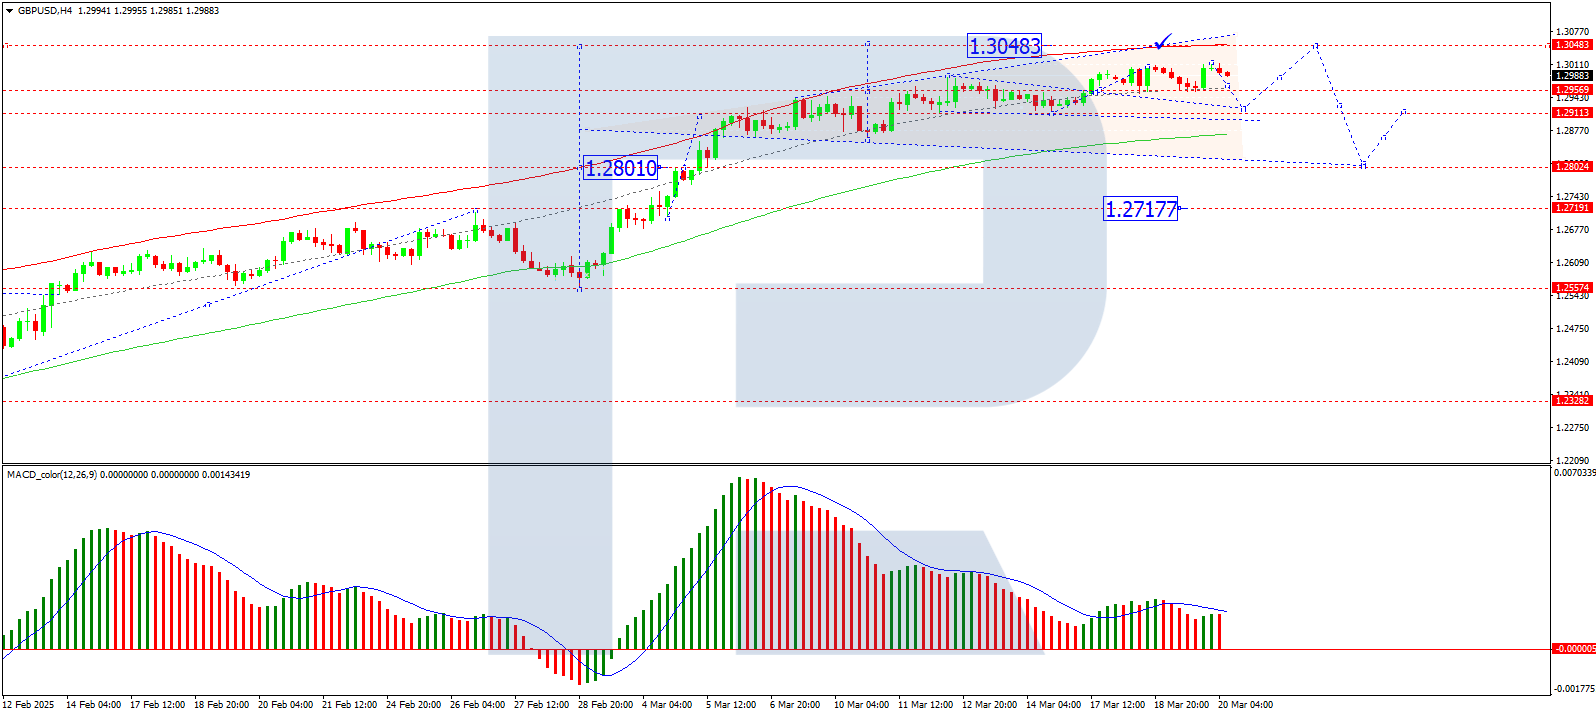
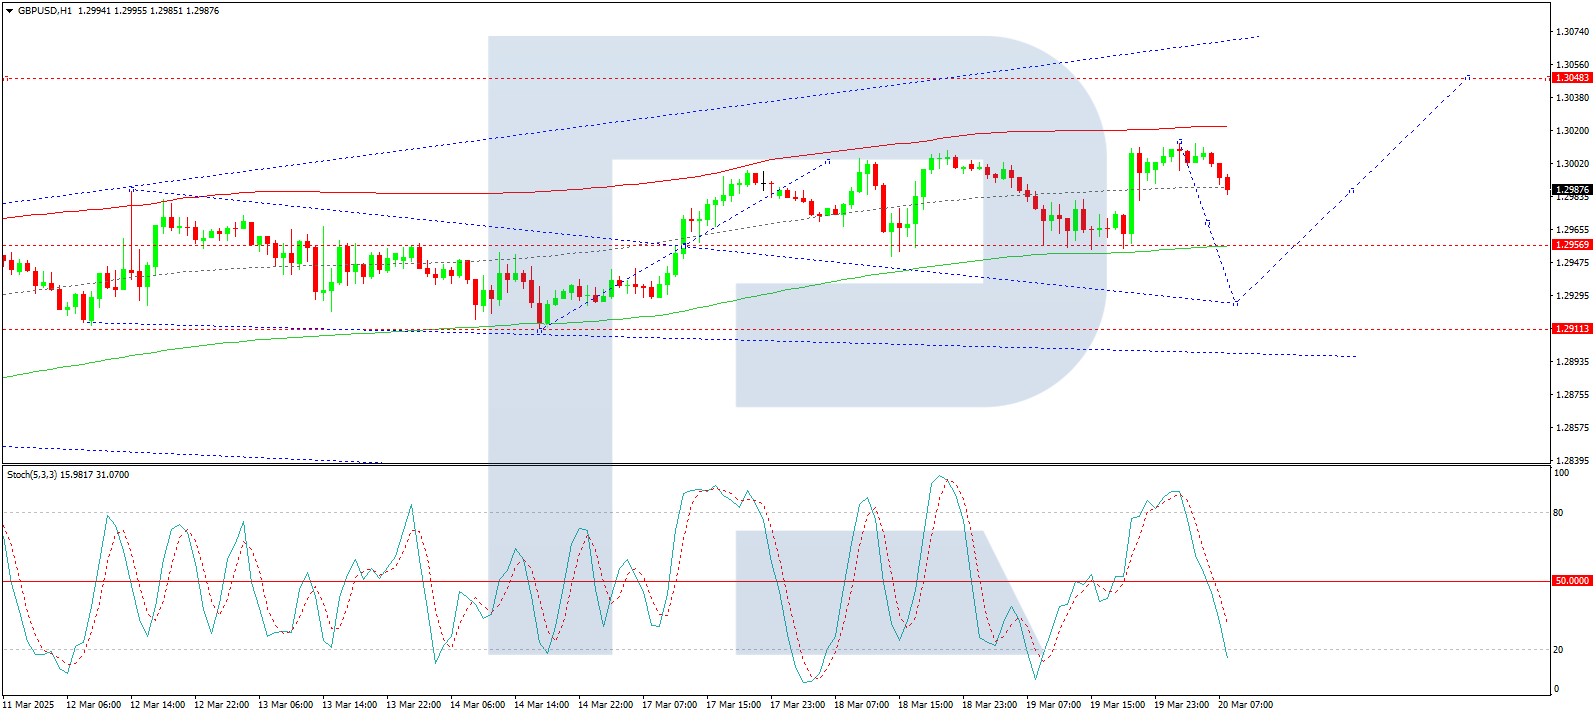
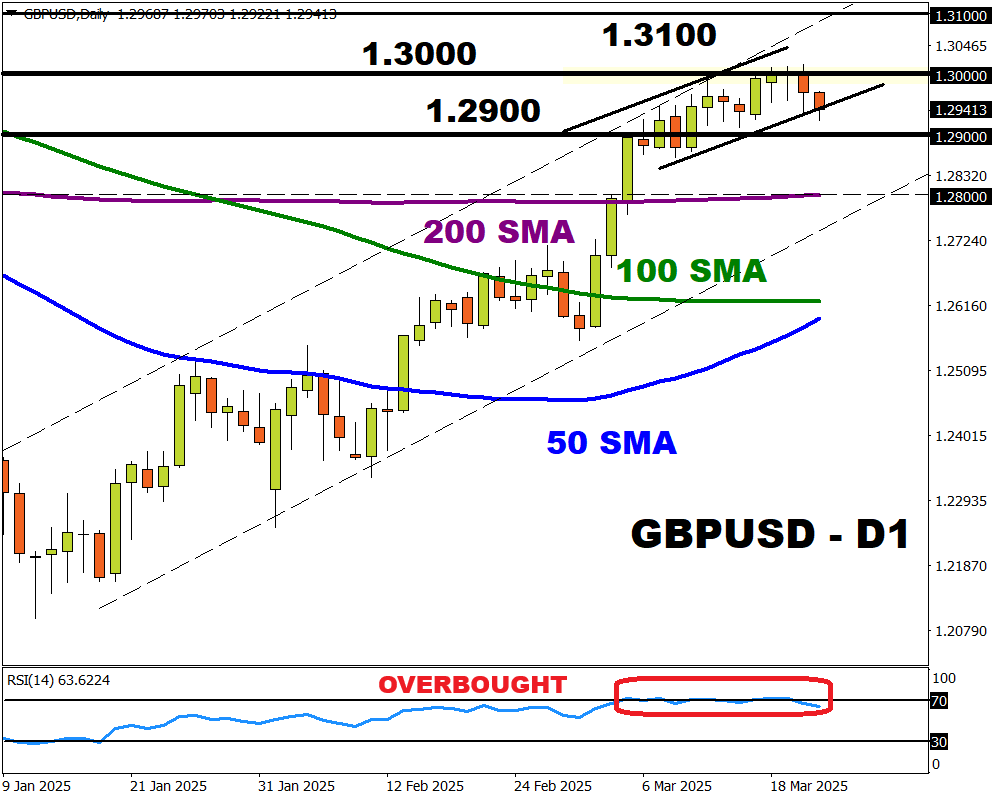
The GBPUSD is back within a range on the daily charts with support at 1.2900 and resistance at 1.3000. Despite respecting a bullish channel, the RSI has been overbought since early March. 

  • A breakout above 1.3000 may open a path toward 1.3100.
  • A breakdown below 1.2900 could trigger a decline toward 1.2870 and the 200-day SMA at 1.2800. 
Imagen
gbpusd

Bloomberg’s FX model forecasts a 75% chance that GBPUSD will trade within the 1.2799 – 1.3081 range, using current levels as a base, over the next one-week period.


Forex-Time-LogoArticle by ForexTime

ForexTime Ltd (FXTM) is an award winning international online forex broker regulated by CySEC 185/12 www.forextime.com

EURUSD Loses Momentum as Fed Bolsters the US Dollar

By RoboForex Analytical Department 

The EUR/USD pair is trending downward, approaching 1.0829 on Friday as investors evaluate the latest developments in US Federal Reserve monetary policy.

Key drivers behind EUR/USD movement

On Wednesday, the Federal Reserve held its current interest rate and overall monetary policy framework unchanged. However, the central bank signalled that two rate cuts could be expected later this year. In its commentary, the Fed highlighted growing risks to economic recovery, employment stability, and inflation trends.

Fed Chair Jerome Powell downplayed concerns about the inflationary impact of tariffs imposed by the Trump administration, describing them as temporary. Powell also emphasised that the Fed would not rush into further rate cuts, reinforcing a cautious approach to monetary easing.

Adding to market uncertainty, Trump’s retaliatory tariffs – targeting countries that have imposed duties on US goods – are set to take effect on 2 April. Over the past 24 hours, the US dollar has strengthened amid fears of slowing global economic growth and escalating trade tensions. These factors have reinforced risk-averse sentiment among investors.

Technical analysis of EUR/USD

On the H4 chart, EUR/USD declined to 1.0815, followed by a correction to 1.0860. A further decline towards 1.0765 is highly likely, with this level remaining the primary target. The MACD indicator supports this scenario. Its signal line is below zero, sloping sharply downward, indicating potential new lows.

On the H1 chart, EUR/USD broke through the 1.0864 level and formed a bearish wave structure, reaching 1.0815. Today, a corrective move towards 1.0860 (testing from below) is likely. Once this correction concludes, the pair could resume its downward trajectory, targeting 1.0811. This movement marks the third wave of the downtrend. After reaching this level, another retracement towards 1.0864 is possible. The Stochastic oscillator supports this outlook, with its signal line below 20 and trending upward towards the 50 level.


Conclusion

The EUR/USD pair remains under pressure as the Fed’s cautious stance and global trade tensions bolster the US dollar. Technical indicators suggest further downside potential, with key support levels at 1.0765 and 1.0811. Investors should monitor upcoming economic data and trade developments for additional insights into the pair’s direction.


Disclaimer

Any forecasts contained herein are based on the author’s particular opinion. This analysis may not be treated as trading advice. RoboForex bears no responsibility for trading results based on trading recommendations and reviews contained herein.

Pound Hits 4.5-Month High: New Peaks on the Horizon

By RoboForex Analytical Department 

The GBP/USD pair surged to 1.3008 on Thursday, marking its highest level in 4.5 months. This upward momentum has fuelled speculation about additional gains for the British pound.

Global Factors to Drive GBP/USD Movement

The market has largely priced in the US dollar’s decline, which has provided a tailwind for the pound. The UK is in a favourable position amid ongoing global trade tensions. With limited trade ties to the US, the country is less exposed to major tariffs. Its neutral stance on global conflicts further supports the pound’s stability.

Today’s Bank of England (BoE) meeting is unlikely to significantly affect the pound, as markets have already priced in the expectation that interest rates will remain at 4.50%. Investors will instead focus on the BoE’s commentary, which is expected to maintain a cautious tone. Key points of interest include updates on inflation and GDP estimates.

The BoE’s forecasts are expected to remain unchanged, underscoring its data-dependent approach. The central bank’s wording is expected to signal a gradual approach to future rate cuts, reinforcing a measured and cautious monetary stance.

Looking ahead, global developments will have a greater impact on the pound’s trajectory than domestic factors, with its outlook remaining positive given the current geopolitical and economic climate.

Technical Analysis of GBP/USD

On the H4 chart, GBP/USD completed a growth wave, reaching 1.3013. Currently, the pair is consolidating below this level. A downward extension of the consolidation range to 1.2925 is anticipated, followed by a potential upward wave targeting 1.3048. Beyond this, a downward correction to 1.2800 could materialise. This scenario is supported by the MACD indicator, whose signal line is trending downward toward the zero level.

On the H1 chart, GBP/USD is forming a downward wave structure toward 1.2925. Once this wave completes, a move higher to 1.3048 is possible. Further ahead, a decline to 1.2717 remains a possibility. This outlook is corroborated by the Stochastic oscillator, whose signal line is below 50 and trending downward toward 20.

Conclusion

The pound’s recent rally to a 4.5-month high reflects a combination of US dollar weakness and the UK’s advantageous position in global trade dynamics. While the BoE meeting is unlikely to deliver surprises, the central bank’s cautious tone and data-dependent approach will be closely watched. Technically, GBP/USD is poised for further gains, though a corrective pullback is possible. Investors should watch global developments, which will likely dictate the pound’s next moves.


Disclaimer

Any forecasts contained herein are based on the author’s particular opinion. This analysis may not be treated as trading advice. RoboForex bears no responsibility for trading results based on trading recommendations and reviews contained herein.

The FOMC and PBoC expectedly kept interest rates at current levels. New Zealand’s economy came out of a recession

By JustMarkets

At Wednesday’s close, the Dow Jones Industrial Average (US30) was up 0.93%. The S&P 500 Index (US500) added 1.08%. The Nasdaq Technology Index (US100) jumped 1.41%. The Fed left the federal funds rate unchanged at 4.25-4.5% at its March 2025 meeting, extending a pause in the rate-cutting cycle that began in January and in line with expectations. Policymakers noted that uncertainty about the economic outlook has increased but still expect interest rates to fall by about 50 bps this year, the same as in the December prognosis. Meanwhile, GDP growth expectations for this year were revised downward to 1.7% from 2.1% in December.

Bitcoin (BTC/USD) traded near the $86,000 mark on Thursday, hitting its highest level in nearly two weeks during the session. Optimism is growing ahead of US president Donald Trump’s speech at the Blockwork digital asset summit later today. Trump will become the first sitting US president to speak at a digital asset conference, signaling his administration’s support for the industry. He has pledged to make the US the world’s capital of digital assets and recently created the Bitcoin Strategic Reserve and the US Digital Asset Reserve.

Equity markets in Europe were mostly up yesterday. Germany’s DAX (DE40) was down 0.40%, France’s CAC 40 (FR40) closed up 0.70%, Spain’s IBEX 35 (ES35) added 0.40%, and the UK’s FTSE 100 (UK100) closed positive 0.02%. European equities rose for a fourth session on Wednesday, amid additional support from increased deficit spending as markets assessed the likelihood of a prolonged ceasefire between Russia and Ukraine. Meanwhile, Germany’s Bundestag approved an expected amendment to the debt brake that will boost budget spending on infrastructure and defense.

WTI crude oil prices traded near $67 per barrel amid rising US crude inventories and economic concerns weighing on prices despite geopolitical tensions. The latest EIA report showed a larger-than-expected 1.75 million barrel increase in nationwide inventories, although inventories in Cushing, Oklahoma, declined and fuel stocks fell.

Asian markets were mostly up yesterday. Japan’s Nikkei 225 (JP225) was down by 0.25%, China’s FTSE China A50 (CHA50) rose by 0.75%, Hong Kong’s Hang Seng (HK50) added 0.12%, and Australia’s ASX 200 (AU200) was positive 1.07%.

The Australian dollar fell below $0.635 on Thursday, marking the third consecutive decline, as traders reassessed the Reserve Bank of Australia’s (RBA) monetary policy outlook following weaker-than-expected employment data. Australia’s unemployment rate was unchanged at 4.1% in February, but the number of jobs unexpectedly fell, raising concerns about labor market softness. Market expectations for the next RBA rate cut continue to diverge, with some analysts predicting it will happen as early as May, while others expect it in July or August.

The New Zealand dollar fell to as low as 0.579 dollars on Thursday, even after data showed that the country’s economy came out of recession. New Zealand’s economy grew by 0.7% quarter-on-quarter in Q4, exceeding analysts’ expectations of 0.4% and the Reserve Bank’s expectations of 0.3%, after a revised 1.1% contraction in Q3. At the same time, annual GDP fell to a positive 1.1%, slightly better than the 1.4% decline expected. Despite the improvement, economic challenges remain and external factors, in particular escalating trade tensions, continue to pose risks. Expectations for policy easing remain firm, with markets expecting a rate cut of around 60 bps, equivalent to two or three rate cuts before the end of the year.

In March 2025, the PBOC kept key lending rates unchanged for the fifth consecutive month, in line with market expectations. The one-year prime rate, which is the benchmark for most corporate and home loans, was 3.1%, and the five-year prime rate, which guides real estate mortgages, remained unchanged at 3.6%. Both rates remain at historic lows after declines in October and July 2024. However, the PBOC noted that it will lower interest rates and adjust the bank’s reserve requirement rate at an appropriate time.

S&P 500 (US500) 5,675.29 +60.63 (+1.08%)

Dow Jones (US30) 41,964.63 +383.32 (+0.92%)

DAX (DE40) 23,288.06 −92.64 (−0.40%)

FTSE 100 (UK100) 8,706.66 +1.43 (+0.02%)

USD Index 103.46 +0.22 (+0.21%)

News feed for: 2025.03.20

  • Australia Unemployment Rate at 02:30 (GMT+2);
  • China PBoC Prime Rate (m/m) at 03:15 (GMT+2);
  • Switzerland Trade Balance (m/m) at 09:00 (GMT+2);
  • UK Claimant Count Change (m/m) at 09:00 (GMT+2);
  • UK Average Earnings Index (m/m) at 09:00 (GMT+2);
  • UK Unemployment Rate (m/m) at 09:00 (GMT+2);
  • Hong Kong Inflation Rate at 10:30 (GMT+2);
  • Sweden Riksbank Rate Decision at 10:30 (GMT+2);
  • Switzerland SNB Policy Rate at 10:30 (GMT+2);
  • Switzerland SNB Monetary Policy Assessment at 10:30 (GMT+2);
  • Switzerland SNB Press Conference at 11:00 (GMT+2);
  • UK BoE Official Bank Rate at 14:00 (GMT+2);
  • UK BoE Monetary Policy Summary at 14:00 (GMT+2);
  • UK BoE Press Conference at 14:30 (GMT+2);ʼ
  • US Initial Jobless Claims (w/w) at 14:30 (GMT+2);
  • US Existing Home Sales (m/m) at 16:00 (GMT+2);
  • US Natural Gas Reserves (w/w) at 16:30 (GMT+2);
  • New Zealand Trade Balance (q/q) at 23:45 (GMT+2).

By JustMarkets


This article reflects a personal opinion and should not be interpreted as an investment advice, and/or offer, and/or a persistent request for carrying out financial transactions, and/or a guarantee, and/or a forecast of future events.

The US indices are under pressure again. Oil declines amid oversupply

By JustMarkets

At the end of Tuesday, the Dow Jones Index (US30) fell by 0.62%. The S&P 500 Index (US500) was down 1.07%. The Nasdaq Technology Index (US100) lost 1.66%. Tesla shares fell by 5.3% after RBC Capital Markets lowered its price target, citing increasing EV competition. Alphabet shares fell by 2.3% after news that Google will acquire cloud security company Wiz for $32 billion. Other tech giants including Nvidia and Palantir also fell in price by 3.4% and 4% respectively. Investors are on edge ahead of Wednesday’s Federal Reserve decision, with markets generally expecting rates to remain unchanged. Meanwhile, a stronger-than-expected rise in housing starts contrasted with inflation concerns over pressure on import prices, adding to market uncertainty.

Equity markets in Europe rose steadily yesterday. Germany’s DAX (DE40) rose by 0.98%, France’s CAC 40 (FR40) closed 0.50% higher, Spain’s IBEX 35 (ES35) gained 1.58%, and the UK’s FTSE 100 (UK100) closed positive 0.29%. Germany’s outgoing parliament approved a significant increase in government borrowing, including a major overhaul of the country’s debt rules. The deal, negotiated by the election-winning conservative CDU/CSU bloc, as well as the SPD and Greens, exempts defense spending from debt limits and sets out a €500 billion infrastructure investment plan. As for monetary policy, traders have lowered expectations for ECB rate cuts this year and are now only looking at two cuts, likely in April and June. In addition, interest rates are not expected to fall below 2%.

WTI crude oil prices fell to $66.9 a barrel on Tuesday, wiping out gains over the past two sessions as the market is pressured by oversupply concerns. Oil demand is slowing due to weakening global trade and shipping, exacerbated by the ongoing trade war unleashed by US President Donald Trump, which continues to weigh on major economies and reduce growth. In addition, OPEC and its allies are set to increase production by 138,000 barrels per day, the first increase since 2022, leading to an expected surplus. Meanwhile, hopes for a ceasefire in Ukraine have led to speculation that sanctions on Russian oil could be lifted, potentially leading to a rebound in supplies.

The US natural gas prices (XNG/USD) rose more than 2% to $4.1 per mmbpd on Tuesday on record LNG exports and lower daily production. Output fell to a three-week low of 104.1 bcf/d, although the monthly average remains above February’s record.

Asian markets were mostly rising yesterday. Japan’s Nikkei 225 (JP225) rose by 1.20%, China’s FTSE China A50 (CHA50) fell by 0.16%, Hong Kong’s Hang Seng (HK50) gained 2.46%, and Australia’s ASX 200 (AU200) was positive 0.08%. Mainland Chinese stocks retreated from multi-month highs as investors booked profits following a strong rally in Chinese technology and artificial intelligence-related stocks. The sector was also pressured by a renewed sell-off in shares of US tech giants.

The Bank of Japan left interest rates unchanged at 0.5%, as expected. The Central Bank maintained its expectations that Japan’s economy is likely to continue growing above potential but acknowledged some signs of weakness. Policymakers also favored giving more time to assess the impact of rising global economic risks, particularly higher US tariffs. Meanwhile, the monthly Tankan survey showed Japanese manufacturers were pessimistic in March amid concerns over US tariffs and a slowdown in China’s economy. Separate data showed Japan’s trade balance turned into a surplus in February, helped by strong exports.

The Australian dollar stabilized near $0.636 on Wednesday after a volatile start to the week as investors continued to assess the Reserve Bank of Australia’s monetary policy outlook. On Tuesday, RBA assistant governor Sarah Hunter said the February interest rate cut was aimed at easing restrictive policy, but emphasized that the board remains more cautious than markets about further rate cuts.

S&P 500 (US500) 5,614.66 −60.46 (−1.07%)

Dow Jones (US30) 41,581.31 −260.32 (−0.62%)

DAX (DE40) 23,380.70 +226.13 (+0.98%)

FTSE 100 (UK100) 8,705.23 +24.94 (+0.29%)

USD Index 103.26 −0.11 (−0.11%)

News feed for: 2025.03.19

  • Japan Trade Balance at 01:50 (GMT+2);
  • Japan BoJ Policy Rate at 05:00 (GMT+2);
  • Japan BoJ Monetary Policy Statement at 05:00 (GMT+2);
  • Japan BoJ Press Conference at 06:45 (GMT+2);
  • Indonesian Interest Rate Decision at 09:30 (GMT+2);
  • Eurozone Consumer Price Index (m/m) at 12:00 (GMT+2);
  • US Crude Oil Reserves (w/w) at 16:30 (GMT+2);
  • US FOMC Federal Funds Rate at 20:00 (GMT+2);
  • US FOMC Statement at 20:00 (GMT+2);
  • US FOMC Economic Projections at 20:00 (GMT+2);
  • US FOMC Press Conference at 20:30 (GMT+2);
  • New Zealand GDP (m/m) at 23:45 (GMT+2).

By JustMarkets


This article reflects a personal opinion and should not be interpreted as an investment advice, and/or offer, and/or a persistent request for carrying out financial transactions, and/or a guarantee, and/or a forecast of future events.

Japanese Yen Continues to Slide as Bank of Japan Disappoints Markets

By RoboForex Analytical Department 

The USD/JPY pair surged to 149.58 on Wednesday, marking its fourth consecutive day of gains as the Japanese yen extended its decline. The Bank of Japan’s (BoJ) latest policy decision failed to inspire confidence, leaving investors underwhelmed and further weakening the yen.

Key factors driving USD/JPY movement

As expected, the Bank of Japan maintained its benchmark interest rate at 0.5% while reiterating its forecast that the Japanese economy will grow above its potential level. However, the central bank also acknowledged emerging signs of economic fragility, adopting a cautious tone in its outlook. Policymakers emphasised the need to gather and analyse more data before making significant moves, particularly in light of global economic risks.

A key concern is the potential impact of US tariff hikes, which could weigh heavily on Japan’s export-driven economy. Investors are now closely monitoring comments from BoJ Governor Kazuo Ueda for further insights into the central bank’s strategy and future policy direction.

Recent data has painted a mixed picture of Japan’s economic health. The monthly Reuters Tankan survey revealed growing pessimism among Japanese manufacturers in March, citing concerns over US trade policies and China’s slowing economy. On a brighter note, Japan’s trade balance shifted to a surplus in February, driven by robust export growth. However, this improvement has done little to strengthen the yen amid broader market concerns.

Technical analysis of USD/JPY

On the H4 chart, USD/JPY is forming a bullish wave structure, targeting 150.20. Upon reaching this level, a corrective pullback to 149.20 is possible, likely establishing a consolidation range near the current highs. A breakout above this range could signal further upward momentum, with the next target at 151.80. This scenario is supported by the MACD indicator, with its signal line remaining above zero and trending upwards.

The H1 chart shows USD/JPY developing a growth wave toward 150.20, representing the midpoint of the third wave in the current structure. A consolidation range is expected to form around 149.62, with an upward breakout potentially opening the path to 151.80. The Stochastic oscillator corroborates this outlook, with its signal line above 50 pointing upward.


Conclusion

The Japanese yen’s decline reflects market disappointment with the Bank of Japan’s cautious stance and lack of decisive action. While Japan’s trade balance has shown improvement, concerns over global economic risks and domestic manufacturing sentiment continue to weigh on the currency. From a technical perspective, USD/JPY remains in a bullish trend, with key resistance levels at 150.20 and 151.80. Traders should monitor BoJ Governor Ueda’s statements and upcoming economic data for further clues on the yen’s trajectory.


Disclaimer

Any forecasts contained herein are based on the author’s particular opinion. This analysis may not be treated as trading advice. RoboForex bears no responsibility for trading results based on trading recommendations and reviews contained herein.

Museums have tons of data, and AI could make it more accessible − but standardizing and organizing it across fields won’t be easy

By Bradley Wade Bishop, University of Tennessee 

Ice cores in freezers, dinosaurs on display, fish in jars, birds in boxes, human remains and ancient artifacts from long gone civilizations that few people ever see – museum collections are filled with all this and more.

These collections are treasure troves that recount the planet’s natural and human history, and they help scientists in a variety of different fields such as geology, paleontology, anthropology and more. What you see on a trip to a museum is only a sliver of the wonders held in their collection.

Museums generally want to make the contents of their collections available for teachers and researchers, either physically or digitally. However, each collection’s staff has its own way of organizing data, so navigating these collections can prove challenging.

Creating, organizing and distributing the digital copies of museum samples or the information about physical items in a collection requires incredible amounts of data. And this data can feed into machine learning models or other artificial intelligence to answer big questions.

Currently, even within a single research domain, finding the right data requires navigating different repositories. AI can help organize large amounts of data from different collections and pull out information to answer specific questions.

But using AI isn’t a perfect solution. A set of shared practices and systems for data management between museums could improve the data curation and sharing necessary for AI to do its job. These practices could help both humans and machines make new discoveries from these valuable collections.

As an information scientist who studies scientists’ approaches to and opinions on research data management, I’ve seen how the world’s physical collection infrastructure is a patchwork quilt of objects and their associated metadata.

AI tools can do amazing things, such as make 3D models of digitized versions of the items in museum collections, but only if there’s enough well-organized data about that item available. To see how AI can help museum collections, my team of researchers started by conducting focus groups with the people who managed museum collections. We asked what they are doing to get their collections used by both humans and AI.

Collection managers

When an item comes into a museum collection, the collection managers are the people who describe that item’s features and generate data about it. That data, called metadata, allows others to use it and might include things like the collector’s name, geographic location, the time it was collected, and in the case of geological samples, the epoch it’s from. For samples from an animal or plant, it might include its taxonomy, which is the set of Latin names that classify it.

All together, that information adds up to a mind-boggling amount of data.

But combining data across domains with different standards is really tricky. Fortunately, collection managers have been working to standardize their processes across disciplines and for many types of samples. Grants have helped science communities build tools for standardization.

In biological collections, the tool Specify allows managers to quickly classify specimens with drop-down menus prepopulated with standards for taxonomy and other parameters to consistently describe the incoming specimens.

A common metadata standard in biology is Darwin Core. Similar well-established metadata and tools exist across all the sciences to make the workflow of taking real items and putting them into a machine as easy as possible.

Special tools like these and metadata help collection managers make data from their objects reusable for research and educational purposes.

Many of the items in museum collections don’t have a lot of information describing their origins. AI tools can help fill in gaps.

All the small things

My team and I conducted 10 focus groups, with a total of 32 participants from several physical sample communities. These included collection managers across disciplines, including anthropology, archaeology, botany, geology, ichthyology, entomology, herpetology and paleontology.

Each participant answered questions about how they accessed, organized, stored and used data from their collections in an effort to make their materials ready for AI to use. While human subjects need to provide consent to be studied, most species do not. So, an AI can collect and analyze the data from nonhuman physical collections without privacy or consent concerns.

We found that collection managers from different fields and institutions have lots of different practices when it comes to getting their physical collections ready for AI. Our results suggest that standardizing the types of metadata managers record and the ways they store it across collections could make the items in these samples more accessible and usable.

Additional research projects like our study can help collection managers build up the infrastructure they’ll need to make their data machine-ready. Human expertise can help inform AI tools that make new discoveries based on the old treasures in museum collections.The Conversation

About the Author:

Bradley Wade Bishop, Professor of Information Sciences, University of Tennessee

This article is republished from The Conversation under a Creative Commons license. Read the original article.

The OECD downgraded its growth expectations for the G20 economies. Oil prices rose for the third consecutive session.

By JustMarkets 

Stocks on Wall Street started the week on an optimistic note. On Monday, the Dow Jones (US30) rose 0.85%. The S&P 500 Index (US500) gained 0.64%. The Nasdaq Technology Index (US100) was up 0.55%. Softer-than-expected retail sales data, which showed a modest 0.2% increase in February, fueled speculation that the Federal Reserve may lean toward cutting rates later this year. Despite the broad market rally, major technology stocks lagged, with Tesla down 4.8% and Nvidia down 1.7% as investors overestimated their high valuations amid ongoing economic uncertainty. Finance Minister Bessent attempted to calm markets by characterizing the correction as “healthy” while acknowledging that recession risks remain. Market participants are now turning their attention to the upcoming Fed meeting, awaiting signals on how Trump’s shifting trade policies may affect future economic decisions.

The Canadian dollar strengthened to 1.43 per US dollar — a three-week high — to ease trade tensions, a weaker US dollar, and an improved outlook for foreign exchange inflows. Senior Canadian officials reported tangible progress in US-Canada trade talks, with both sides reaching tentative agreements to phase out retaliatory tariffs designed to stabilize trade flows and address key concerns such as escalating tariffs on critical goods.

The OECD lowered its 2025 growth expectations for G20 economies to 3.1% from 3.3% and for 2026 to 2.9% from 3.2%, citing rising trade barriers and political uncertainty holding back investment and spending. The US economy is now expected to grow 2.2% in 2025 (vs. 2.4% projections in December) and 1.6% in 2026 (vs. 2.1%). Canada’s growth expectations have been sharply lowered to 0.7% in both years (from 2%) and Mexico is expected to contract by 1.3% in 2025 and 0.6% in 2026, reversing previous growth estimates. In Europe, the Eurozone is expected to grow by 1.0% in 2025 (down from 1.3%) and 1.2% in 2026 (up from 1.5%), with downgrades for Germany, France, and Italy partially offset by an upgrade for Spain. The UK growth projections have also been lowered to 1.4% in 2025 (vs. 1.7%) and 1.2% in 2026 (vs. 1.3%). Meanwhile, China’s economy is expected to grow at 4.8% this year (vs. 4.7%) before slowing to 4.4% in 2026.

Equity markets in Europe were mostly up yesterday. Germany’s DAX (DE40) rose by 0.73%, France’s CAC 40 (FR40) closed higher by 0.57%, Spain’s IBEX 35 (ES35) added 1.09%, and the UK’s FTSE 100 (UK100) closed positive 0.56%. In Germany, traders awaited a crucial vote on Germany’s spending plan set for tomorrow. The proposed reform aims to exempt defense spending from debt restrictions and create a €500 billion infrastructure investment fund. It requires a two-thirds majority in both legislative chambers to pass, but the CDU/CSU bloc, led by election winner Friedrich Merz, is expected to garner the necessary number of votes to amend the constitution.

WTI crude oil prices rose to $67.8 a barrel on Tuesday, marking the third straight session of gains, amid concerns over supply disruptions caused by ongoing conflicts in the Middle East. Israel launched a large-scale offensive on the Gaza Strip today, the first major strike since a truce went into effect in January. In addition, US President Trump on Monday threatened to hold Iran responsible for any attacks by Yemen’s Houthis, stepping up his campaign of pressure on Tehran.

Asian markets traded higher yesterday. Japan’s Nikkei 225 (JP225) rose by 0.93%, China’s FTSE China A50 (CHA50) gained 0.06%, Hong Kong’s Hang Seng (HK50) added 0.77% and Australia’s ASX 200 (AU200) gained 0.90%.

On Monday, Chinese economic data sparked optimism with retail sales accelerating and industrial production exceeding expectations, but lower factory output and a two-year high in the urban unemployment rate tempered prognoses. Meanwhile, Trump announced that Xi Jinping will visit Washington amid escalating trade tensions, although no official dates for the visit were confirmed, adding to investor uncertainty.

The New Zealand dollar traded near US$0.581 on Tuesday, at its highest level since early December, driven by growing optimism about China’s economic outlook. This followed the release of favorable retail sales data and new Chinese initiatives aimed at boosting consumer spending, which boosted the China-focused kiwi. Further boosting the antipodean currency was the continued weakening of the US dollar amid economic uncertainty and heightened trade tensions.

S&P 500 (US500) 5,675.12 +36.18 (+0.64%)

Dow Jones (US30) 41,841.63 +353.44 (+0.85%)

DAX (DE40) 23,154.57 +167.75 (+0.73%)

FTSE 100 (UK100) 8,680.29 +47.96 (+0.56%)

USD Index 103.41 −0.31 (−0.30%)

News feed for: 2025.03.18

  • German ZEW Economic Sentiment (m/m) at 12:00 (GMT+2);
  • Eurozone ZEW Economic Sentiment (m/m) at 12:00 (GMT+2);
  • Eurozone Trade Balance (m/m) at 12:00 (GMT+2);
  • Canada Consumer Price Index (m/m) at 14:30 (GMT+2);
  • US Building Permits (m/m) at 14:30 (GMT+2);
  • US Industrial Production (m/m) at 15:15 (GMT+2).

By JustMarkets


This article reflects a personal opinion and should not be interpreted as an investment advice, and/or offer, and/or a persistent request for carrying out financial transactions, and/or a guarantee, and/or a forecast of future events.

Gold Prices Hit Record Highs: New Milestones Ahead

By RoboForex Analytical Department 

On Tuesday, the price of Gold surged to an unprecedented 3,013 USD per troy ounce, marking a new all-time high. This milestone follows a prolonged upward trend, driven by heightened investor demand for safe-haven assets ahead of the US Federal Reserve’s decision on interest rates.

Key Drivers Behind Gold’s Rally

The Federal Reserve’s two-day meeting, which began today and concludes Wednesday evening, is the focal point for investors. While the base scenario suggests the Fed will maintain current interest rates, market participants are closely watching for updated economic forecasts and insights from Chair Jerome Powell’s press conference. His remarks could explain future monetary policy, particularly amid ongoing trade tensions and tariff disputes.

Geopolitical uncertainties are also fuelling Gold’s ascent. On Monday, US President Donald Trump issued a stern warning to Iran, holding it directly accountable for any further attacks by Yemen’s Houthi rebels. The group has threatened to target foreign vessels in the Red Sea, including those of the US.

Additionally, Trump announced plans to hold talks with the Russian president on Tuesday morning to discuss a potential ceasefire, further adding to the global uncertainty driving investors toward Gold.

Technical Analysis of XAU/USD

On the H4 chart, XAU/USD has formed a tight consolidation range around the 2,945 level, signalling the continuation of an upward growth wave. Today, we anticipate the price to test the 3,010 level, which serves as a local target. Following this, a corrective pullback toward 2,945 (testing from above) is possible. Once this correction concludes, we expect a new growth wave targeting the 3,057 level. This scenario is technically supported by the MACD indicator. The signal line has exited the histogram zone and is pointing sharply downward, indicating potential for upward momentum after the correction.

On the H1 chart, XAU/USD has completed the structure of the growth wave, reaching the 3,015 level. We now expect the start of a corrective move toward 2,945. After this correction, the price will likely resume its upward trajectory, targeting the 3,057 level. Upon reaching this target, we will assess the possibility of a more significant correction towards the 2,900 level. This outlook is further confirmed by the Stochastic oscillator. Its signal line is currently below the 80 level and trending downwards towards 20, suggesting a high probability of a corrective phase.

Conclusion

Gold’s record-breaking rally reflects a combination of macroeconomic uncertainty, geopolitical tensions, and technical momentum. With the Federal Reserve’s decision and global developments in focus, the precious metal remains a key asset for investors seeking stability. As the market navigates these dynamics, further milestones for Gold prices appear increasingly likely.


Disclaimer

Any forecasts contained herein are based on the author’s particular opinion. This analysis may not be treated as trading advice. RoboForex bears no responsibility for trading results based on trading recommendations and reviews contained herein.

Golden Milestone

Source: Michael Ballanger (3/17/25)

Michael Ballanger of GGM Advisory Inc. takes a look at gold, silver, and copper amid political shifts in the U.S. and shares two of his favorite junior developers.

This is a week that shall go down in the annals of history, the week that a “barbarous relic” under the guise of a “pet rock” took its rightful seat on the throne of superior performance, bludgeoning the wailing anchors of CNBC into actually recognizing the ascendancy of gold and its little brother, silver. As the equity markets in the United States went into virtual freefall, the same bubbleheaded, narrative-spewing cast of characters were out in force, beseeching their global viewers to not panic and instead hold on because the Fed “has your backs.”

As gold soared Thursday evening and the wee hours of Friday morning above the magical $3k level, the CNBC Fear-Greed index slumped to a reading of 16, placing it squarely into <EXTREME FEAR>, a zone from which many market bottoms were born. The lowest reading for this index was in April 2020 during the COVID Crash, when it hit a reading of 1. At that point, there was literally nobody left to sell stocks as the world was convinced that the bubonic plague was descending upon us and that humanity, as we then knew it, was doomed.

That marked the bottom of the market in 2020, after which the combination of fiscal stimulus (“cheques to households”) and zero interest rates led to record liquidity levels for the Wall Street banks and a new S&P 500 high a mere five months later. I told subscribers mid-week that now was not the time to sell their holdings and load up on put options and/or volatility. It is also not the time to back the truck into the stock market loading dock and forklift copious amounts of the “MAG Seven” into the bed. March 2025 is not March 2020 because the U.S. government no longer enjoys the privilege of being able to print money. They cannot “save” the stock market by arbitrarily slashing interest rates to zero and engaging in the fiscal helicopter drop that Ben Bernanke boasted of in 2009.

By contrast, now is the time to carefully recalibrate one’s investment objectives and/or risk tolerance profile and above all else, get liquid. With an ample amount of cash, one can survive meltdowns but with leverage and/or no cash, one is completely indebted to and victim of the vagaries of the stock market. Now, if you own gold stocks and/or physical gold or silver, you are liquid; if you do not own them, you are enslaved. I want all subscribers to be free from worry so sell enough of your non-precious metals holdings to allow uninterrupted sleep to dominate the wee hours. Stocks closed the week with a 117-point S&P rally. Into any follow-through next week, increase your cash positions.

I expect that gold will take more than a one-off overnight spike in order to surpass the $3k level as a sustained move.

I expect that profit-taking will have it in a range of $2,975-$3,025 for several more days and perhaps weeks before it can achieve escape velocity above the magic number.

Politics, Economics, and Stocks

I wish I could have been embraced more gently as a youngster to my introduction to the field of politics, but ever since November 22, 1963, and the days and weeks thereafter, I have been totally jaundiced by the mere mention of the word “politics.” When the assassin’s bullet ended the life of a truly popular and indeed charismatic president in the form of John F. Kennedy in Dallas that day, it ended for me and an entire generation of baby boomer idealism that carried an engrained belief that the United States of America was indeed the “Promised Land.”

After Kennedy came LBJ and Viet Nam, Nixon and Watergate, Jimmy Carter and the Stagflation ’70s, and then the “Reagan Miracle” that rhymes beautifully with “Trump 2.0.” In 1981, Reagan had David Stockman; in 2025, Trump has Scott Bessent. In 1981, economic advisor to the President, David Stockman embraced the media with “supply-side economics”; in 2025, Elon Musk embraces the media with the “Department of Government Efficiency” (“DOGE“).

In 1981-1982, there was “The Laffer Curve,” a theoretical model in economics that suggests there’s an optimal tax rate that maximizes government revenue, with revenue falling at both very high and very low tax rates. Yet despite all of the brainpower assisting Reagan, after two years of soaring interest rates and falling polling numbers, the Reagan Team bailed on their anti-inflation mission and opened up the fiscal and monetary floodgates in order to salvage some respectability in the mid-term elections.

The bear market ended in 1982 a mere ten weeks before the 1982 mid-term elections with a rapid and aggressive wave of monetary easing as then Fed Chairman Paul Volcker slashed the Fed Funds rate sending the S&P 500 up 40% from the August lows to early November. Needless to say, the Republicans carried the mid-terms.

With the pullback in the DJIA, S&P 500, and the NASDAQ 100 in the past three weeks, it closely resembles the end of the Reagan “honeymoon period,” which stretched from election day 1980 until May of 1982. When the bloom came of the rose in May of 1982, it triggered a nasty bear market that lasted for fifteen long months, and while it wasn’t nearly as long or as arduous as the 1973-1974 bear, the interest rate crunch bankrupted many individuals and corporations that were carrying inordinate amounts of debt.

Here in 2025, it is the government of the U.S.A. and certain commercial real estate borrowers that are carrying inordinate amounts of debt while the average household and majority of corporate balance sheets are in relatively good shape. However, as happened in 1981-1982, the Reagan-esque “new morning in America” that Trump 2.0 promised in the form of “Make America Great Again” is threatening to be preceded by “The Nightmare on Wall Street” as the fiscal juice that kept the economy chugging along through most of 2024 has now ended leaving Scott Bessent with a very ugly balance sheet and some US$8 trillion of refinancing to pull off in an environment where the usual foreign buyers of U.S. Treasuries are being hit or threatened with tariffs.

Good luck with that, Scott. . .

I stick to my call that the current market outlook is a repeat of May 1982 and based upon the 117-point SPX reflex rally on Friday, this next 2-3 weeks could be the same bull trap that snared so much prey back in May 1982 before the ravenous bear started to feast in earnest. From a tactical viewpoint, last week I covered all shorts with put positions being sold as the SPY April $600 puts went from $8.00 to $38 in three short weeks.

As you have all heard many times before, “In a bull market, you are either flat or long or very long, but you are not short.” If SPX 6,147 was THE top, then the correct move is to wait for the rally to run out of gas and then short it. However, thus far, the SPX:US is only in correction mode, which does not rule out new all-time highs. Furthermore, because this decline has been triggered by the White House policy initiatives, any moderation in the bearish rhetoric could send stocks screaming back to their February highs in very short order. For now, stay pat, stay liquid, and focus on this emerging bull market in the metals.

Metals

As much as CNBC would like to ignore the chart posted on page one showing the superior performance of gold since the Turn of the Century, if my portfolio is any indication, owning the metals has been the best trade to begin a year since 2001.

Record highs on gold with copper close behind and silver threatening a break-out. Even the juniors are now starting to capture a little of the love that has been reserved for technology and “meme” stocks.

Surprisingly, when you surf around on “X” (Twitter) or YouTube, you find interview after interview and story after story on gold and silver, but outside of Robert Friedland, there is literally nothing on copper.

Then you look up at the 2025 year-to-date performance figure, and out in front leading the charge is good ol’ Dr. Copper, up 21.59% YTD versus 17.75% for silver, 13.63% for gold, and minus 4.13% for the S&P 500.

My two largest positions just happen to be in two junior developers (Getchell Gold Corp. (GTCH:CSE; GGLDF:OTCQB) and Fitzroy Minerals Inc. (FTZ:TSX.V; FTZFF:OTCQB)) and with one developing (and expanding) a 2.317 million-ounce gold deposit in Nevada while the other has multiple copper projects in Chile, the world’s largest producer of the red metal. I am scanning the landscape for a new silver name, and I think I have found one that is relatively unknown and under-owned, which means it has upside potential.

However, until silver can scale that mountain of resistance between here and US$35.07, I am sidelined silver but happily long the copper and gold combo that have served us so well in 2025.

Remember that old adage from the School of Successful Stock Promotion: “Hang on to your cat, your coat, and your girlfriend; there ain’t no fever like gold fever!”

Copper may wish to dissent. . .


Important Disclosures:

  1. As of the date of this article, officers and/or employees of Streetwise Reports LLC (including members of their household) own securities of Getchell Gold Corp. and Fitzroy Minerals Inc.
  2. Michael Ballanger: I, or members of my immediate household or family, own securities of: All. My company has a financial relationship with: All.  I determined which companies would be included in this article based on my research and understanding of the sector.
  3. Statements and opinions expressed are the opinions of the author and not of Streetwise Reports, Street Smart, or their officers. The author is wholly responsible for the accuracy of the statements. Streetwise Reports was not paid by the author to publish or syndicate this article. Streetwise Reports requires contributing authors to disclose any shareholdings in, or economic relationships with, companies that they write about. Any disclosures from the author can be found  below. Streetwise Reports relies upon the authors to accurately provide this information and Streetwise Reports has no means of verifying its accuracy.
  4.  This article does not constitute investment advice and is not a solicitation for any investment. Streetwise Reports does not render general or specific investment advice and the information on Streetwise Reports should not be considered a recommendation to buy or sell any security. Each reader is encouraged to consult with his or her personal financial adviser and perform their own comprehensive investment research. By opening this page, each reader accepts and agrees to Streetwise Reports’ terms of use and full legal disclaimer. Streetwise Reports does not endorse or recommend the business, products, services or securities of any company.

For additional disclosures, please click here.

Michael Ballanger Disclosures

This letter makes no guarantee or warranty on the accuracy or completeness of the data provided. Nothing contained herein is intended or shall be deemed to be investment advice, implied or otherwise. This letter represents my views and replicates trades that I am making but nothing more than that. Always consult your registered advisor to assist you with your investments. I accept no liability for any loss arising from the use of the data contained on this letter. Options and junior mining stocks contain a high level of risk that may result in the loss of part or all invested capital and therefore are suitable for experienced and professional investors and traders only. One should be familiar with the risks involved in junior mining and options trading and we recommend consulting a financial adviser if you feel you do not understand the risks involved.