Fear Grips Stock Market Short-Sellers — What to Make of It

“This is easily the lowest wager against rising S&P rises” in the history of the data

– By Elliott Wave International

As you may know, short-selling a stock means that a speculator is betting that the price will go down.

This is a lot riskier than taking a “long” position in a stock — or, betting that the price will go up.

The reason why is that the most a speculator can lose by going long is 100% of his investment — say, if a company goes out of business. However, the losses a short-seller can suffer is potentially unlimited, in other words, short-sellers can lose way more than their initial investment.

As a case in point, a November 2015 Marketwatch article noted that …

… an investor placed a $37,000 short position on [a micro-cap pharmaceutical firm] earlier this month, only to find out a day later that the shares had shot up about 800%.

However, despite the high risk, there are speculators who elect to play the short side.

Recently, however, their ranks have been dramatically dwindling, given the strong stock market rally since the March low.

Indeed, here’s an August 21 Bloomberg headline:

Bears Are Going Extinct

The September Elliott Wave Financial Forecast, a monthly publication which provides analysis and forecasts for major U.S. financial markets, showed this chart and noted:

The story under the Bloomberg headline features Goldman Sachs’ data on the short interest in the median S&P 500 stock, which fell to just 1.8% of market capitalization in early August. As the chart shows, this is easily the lowest wager against rising S&P prices in the 16-year history of the data. “Skeptics are a dying breed in American equities,” concluded Bloomberg.

What should market participants make of this extraordinarily low short interest in stocks?

Well, financial history shows that when bears become few and far between, it’s time for the bulls to start worrying. The same applies when the bulls become few and far between.

In other words, sentiment extremes often correlate with trend changes.

Having said that, it’s best to use sentiment measures in conjunction with the Elliott wave model.

When the two are sending the same message, an investor can arrive at a high-confidence market forecast.

If you’d like to get an in-depth understanding of the Elliott wave model, you are encouraged to read the book, Elliott Wave Principle: Key to Market Behavior, by Frost & Prechter.

Here’s a quote from the Wall Street classic:

In its broadest sense, the Wave Principle suggests the idea that the same law that shapes living creatures and galaxies is inherent in the spirit and activities of men en masse. Because the stock market is the most meticulously tabulated reflector of mass psychology in the world, its data produce an excellent recording of man’s social psychological states and trends. This record of the fluctuating self-evaluation of social man’s own productive enterprise makes manifest specific patterns of progress and regress. What the Wave Principle says is that mankind’s progress (of which the stock market is a popularly determined valuation) does not occur in a straight line, does not occur randomly, and does not occur cyclically. Rather, progress takes place in a “three steps forward, two steps back” fashion, a form that nature prefers. More grandly, as the activity of social man is linked to the Fibonacci sequence and the spiral pattern of progression, it is apparently no exception to the general law of ordered growth in the universe.

The online version of Elliott Wave Principle: Key to Market Behavior is available to you for free when you join Club EWI, an Elliott wave educational community with about 350,000 members. Club EWI membership allows you to freely access a wealth of Elliott wave resources on financial markets, investing and trading without any obligations.

Get started by following this link: Elliott Wave Principle: Key to Market Behavior — free access.

This article was syndicated by Elliott Wave International and was originally published under the headline Fear Grips Stock Market Short-Sellers — What to Make of It. EWI is the world’s largest market forecasting firm. Its staff of full-time analysts led by Chartered Market Technician Robert Prechter provides 24-hour-a-day market analysis to institutional and private investors around the world.


Billionaire tech entrepreneurs need to school financial regulators on Bitcoin

By George Prior

Billionaire tech entrepreneurs need to school financial regulators on Bitcoin and cryptocurrencies – which are the future of money – affirms the CEO of one of the world’s largest independent financial advisory and fintech organisations.

The comments from Nigel Green of deVere Group come as it was announced that Square, the payments company founded by billionaires Jack Dorsey and Jim McKelvey, has just invested $50 million in Bitcoin.

Mr Green observes: “Billionaire tech entrepreneurs, most major financial institutions, and an ever-growing number of retail and institutional investors are increasing their exposure to Bitcoin and other cryptocurrencies.

“This is not a coincidence. They are all paying attention. They know that digital currencies are to money what Amazon was to retail.”

He continues: “Yet, bizarrely, some financial regulators of major markets cannot, seemingly, see the intrinsic value of cryptocurrencies.

“They are adopting a head-in-the-sand approach and issuing bans rather than focusing on establishing robust regulatory frameworks.

“Do they honestly believe that there is no place for, and no value of, digital, global, borderless currencies in an increasingly tech-driven world?”

In recent days, the UK’s Financial Conduct Authority (FCA) published its final rules banning the sale of derivatives and exchange-traded notes (ETNs) that reference certain types of crypto assets, such as Bitcoin, Ether and Ripple (XRP) to retail consumers.

“Some regulatory bodies display a staggering lack of understanding of this sector and perhaps they need to be educated by billionaire tech entrepreneurs, amongst others, on what is the future of money,” insists Nigel Green.

Earlier this week he noted that financial watchdogs cannot ignore crypto and need to focus instead on regulation. “This will provide further protection for the growing number of people using cryptocurrencies, it will help stamp out criminal activity, the less potential risk there will be for the disruption of global financial stability, and the more opportunities there will be for economic growth and activity in those countries which introduce it.”

He concludes: “Some financial regulators exclusively believe in and are focused on the traditional, centralised system of money.

“I would suggest that they need to also be open to a new, decentralized, non-sovereign, digital, global currency.

“Whether they like it or not, the world has profoundly changed and moved on in recent years. It can’t, and won’t, go backwards.”

About:

deVere Group is one of the world’s largest independent advisors of specialist global financial solutions to international, local mass affluent, and high-net-worth clients.  It has a network of more than 70 offices across the world, over 80,000 clients and $12bn under advisement.

Metals Lower As Trump Shuns Further Stimulus

By Orbex

Gold

The yellow metal has been back under pressure this week.

Following a heavy sell-off on Tuesday, from which the market has attempted to recover, gold ends the week in the red as of writing.

The rally in equities over the week has weighed on gold prices. Risk assets have been boosted by the view that further central bank easing is growing closer as concerns over the second wave of COVID continue to flourish.

Gold prices were hit earlier in the week by news that Trump has called off negotiations over a further fiscal support package. Democrats and Republicans have been trying to hammer out a new fiscal deal over recent weeks.

However, Trump announced this week that he will be postponing talks until after the elections.

Republicans had been looking for a $1.6 trillion deal while Democrats were looking for a larger $2.4 trillion package.

Trump reassured markets that he intends to pass a major new stimulus bill should he win.

Weakness in the US dollar into the back end of the week has allowed gold prices to recover somewhat.

Speaking earlier in the week, Fed Chairman Powell called on the need for further support after praising the combined efforts of the Fed and the government.

On the back of his comments, the market has increased its expectations of further central bank easing in the coming months. This should keep gold supported in the medium term.

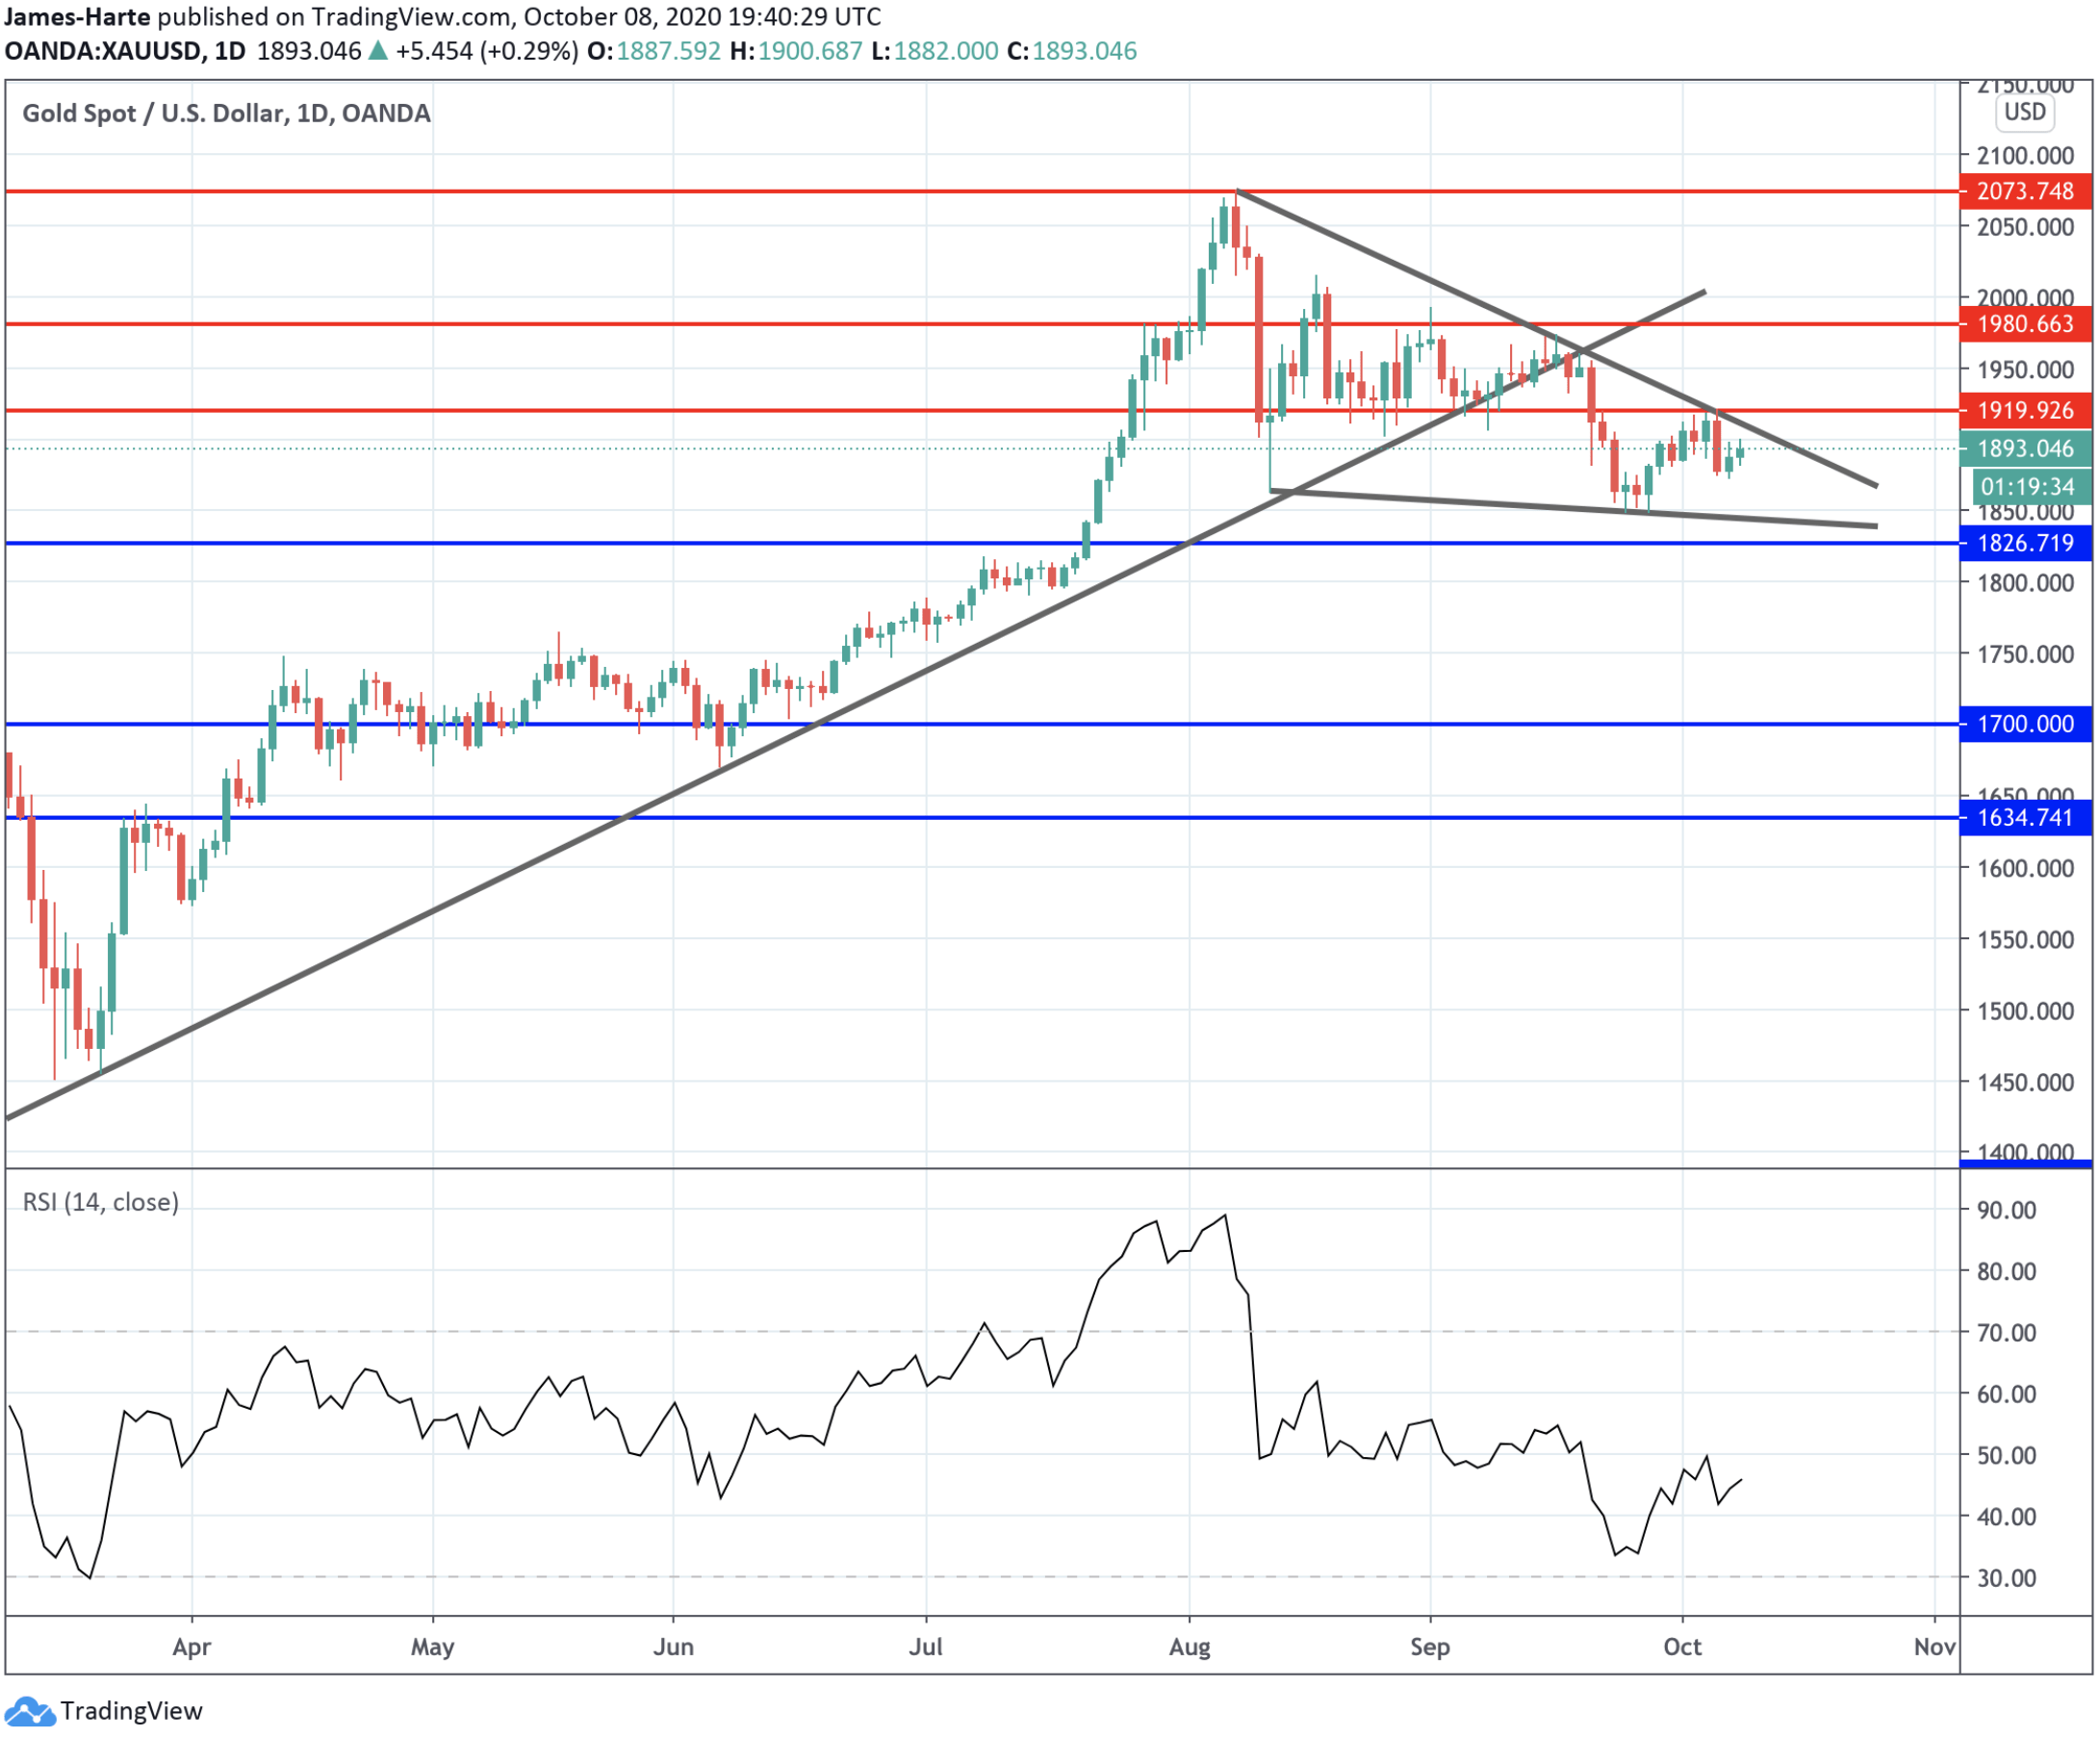
Gold Prices Trading in Falling Wedge Pattern

Having broken below the rising trend line from year to date lows, gold prices continue to trade within a falling wedge pattern which has framed the correction from all-time highs.

While still above the 1826.79 level support, focus remains on further upside.

Silver

Silver prices have traded in the same manner as gold this week with price fighting to recover from Tuesday’s sell-off.

Despite more subdued price action this week, silver prices remain underpinned by the firm rally in equities, particularly in industrial stocks.

With industrial indicators continuing to improve, the fundamental backdrop for silver remains positive.

However, fears of fresh lockdowns in the UK and Europe pose a threat to the demand outlook and traders continue to monitor the situation carefully.

Silver Prices Testing Rising Trend Line

Silver prices continue to find support at the 23.52 level, underpinned by the rising trend line from 2020 lows. While prices holds here, the focus remains on further upside with the 25.97 level the next key resistance to note.

Should price slip back below the trend line, signaling a deeper reversal, the next level to watch will be the 19.62 region.

By Orbex

US Stocks: Don’t Stop Believing

By Han Tan, Market Analyst, ForexTime

US and European equity futures are rising, although Asian stocks are mixed, as investors hold on to hope that the US economy will see another round of fiscal stimulus sooner rather than later. The White House seems to have made another shift in its negotiating tactics, now reportedly wanting to reach a fiscal stimulus deal with Democrats, despite US President Donald Trump calling off talks as recently on Tuesday.

Investors have clearly been sensitive to the on-again, off-again US fiscal stimulus talks, as US equities appear primarily driven by market expectations surrounding the outcome of these talks. Amidst the drama between the White House and Democrats, which add to the political charades leading up to the November presidential elections, it’s evident that investors are clinging on to any sliver of hope that the world’s largest economy will see additional fiscal aid; it’s now just a matter of timing.

Amidst the political wrangling, the S&P 500 has shown its resilience, having climbed about 6.5 percent since flirting with a technical correction in late September. The US equities benchmark is set to register its second consecutive weekly gain, and is now just some 3.7 percent away from its record high.


Meanwhile, the Nasdaq 100 Index is about seven percent off its own record high, on the cusp of posting its third straight week of gains. The tech-heavy index is chipping away at the 12.78 percent peak-to-trough gap evident during last month’s selloff.


This rebound in US equities, while still relatively nascent, is once again testament to the overall supportive environment for the asset class. The tremendously accommodative monetary policy stances around the world ensures that the downside for equities is limited. Though the September pullback was necessary to remove some of the market froth that had built up since March, it has in turn allowed investors to buy the dip, taking advantage of the opportunities that had manifested in recent weeks.

Still, investors remain wary of the risks that lay ahead. While a Biden win and a “Blue Sweep” would assure a larger fiscal stimulus for the US economy, the risk of a protracted wait for the election’s outcome cannot yet be ruled out completely. Such an outcome could leave investors in limbo, which may trigger a bout of risk aversion in the markets.

Unless the fiscal stimulus deal is agreed to before November 3rd, a delayed result from the polls also in turn starves the world’s largest economy of some much-needed aid. The latest US weekly jobless claims show that the number of Americans who are applying for unemployment benefits remains stubbornly high. Although the number of continuing claims has fallen below the psychologically-important 11 million mark for the first time since the pandemic broke out in the US, it still remains well above pre-pandemic levels that numbered fewer than two million.

An agreement over the next US fiscal stimulus package would certainly justify the recent climb in US equities, while potentially encouraging these indices to restore more of its gains. However, these advances are not yet fully assured, as political risks and a stalling global economic recovery could still drag riskier assets lower.


Disclaimer: The content in this article comprises personal opinions and should not be construed as containing personal and/or other investment advice and/or an offer of and/or solicitation for any transactions in financial instruments and/or a guarantee and/or prediction of future performance. ForexTime (FXTM), its affiliates, agents, directors, officers or employees do not guarantee the accuracy, validity, timeliness or completeness, of any information or data made available and assume no liability as to any loss arising from any investment based on the same.


Forex-Time-LogoArticle by ForexTime

ForexTime Ltd (FXTM) is an award winning international online forex broker regulated by CySEC 185/12 www.forextime.com

The Analytical Overview of the Main Currency Pairs on 2020.10.09

by JustForex

The EUR/USD currency pair

Technical indicators of the currency pair:
  • Prev Open: 1.17600
  • Open: 1.17572
  • % chg. over the last day: -0.02
  • Day’s range: 1.17554 – 1.17809
  • 52 wk range: 1.0637 – 1.2012

The US dollar shows ambiguous results against currency majors. EUR/USD quotes are consolidating in the range of 1.1750-1.1780. Investors continue to monitor the progress of the new stimulus package for the US economy. ECB officials are concerned about the prospects for economic recovery in the Eurozone. The regulator is ready to expand financial incentives if necessary. We recommend opening positions from key levels.

Today, the publication of important economic reports is not planned.

EUR/USD

Indicators do not give accurate signals: 50 MA has crossed 200 MA.

The MACD histogram has started growing, which indicates the bullish sentiment.

Stochastic Oscillator is in the neutral zone, the %K line is below the %D line, which gives a signal to sell EUR/USD.

Trading recommendations
  • Support levels: 1.1750, 1.1725, 1.1700
  • Resistance levels: 1.1780, 1.1800, 1.1850

If the price fixes below 1.1750, EUR/USD quotes are expected to fall. The movement is tending to 1.1725-1.1700.

An alternative could be the growth of the EUR/USD currency pair to 1.1800-1.1840.

The GBP/USD currency pair

Technical indicators of the currency pair:
  • Prev Open: 1.29107
  • Open: 1.29113
  • % chg. over the last day: +0.01
  • Day’s range: 1.29133 – 1.29688
  • 52 wk range: 1.1409 – 1.3516

GBP/USD quotes are in a sideways trend. The technical pattern is ambiguous. At the moment, the local support and resistance levels are 1.2930 and 1.2975, respectively. The trading instrument is tending to recover. Financial market participants expect additional drivers. The Brexit talks and a new stimulus package in the US Congress are still in the spotlight. Positions should be opened from key levels.

The UK has published a series of weak economic releases.

GBP/USD

Indicators signal the power of buyers: the price has fixed above 100 MA.

The MACD histogram is in the positive zone, which indicates the bullish sentiment.

Stochastic Oscillator is located near the overbought zone, the %K line has crossed the %D line. There are no signals at the moment.

Trading recommendations
  • Support levels: 1.2930, 1.2900, 1.2865
  • Resistance levels: 1.2975, 1.3000, 1.3050

If the price fixes above 1.2975, further growth of the GBP/USD currency pair is expected. The movement is tending to 1.3000-1.3030.

An alternative could be a drop in GBP/USD quotes to 1.2900-1.2870.

The USD/CAD currency pair

Technical indicators of the currency pair:
  • Prev Open: 1.32596
  • Open: 1.31949
  • % chg. over the last day: -0.45
  • Day’s range: 1.31703 – 1.31976
  • 52 wk range: 1.2949 – 1.4669

The USD/CAD currency pair shows a steady downtrend. The trading instrument has updated its two-week lows. The loonie is currently testing 1.3170. The 1.3210 level is the nearest resistance. USD/CAD quotes have the potential for further decline. We recommend paying attention to the dynamics of “black gold” prices. Positions should be opened from key levels.

At 15:30 (GMT+3:00), the report on Canada’s labor market will be published.

USD/CAD

Indicators signal the power of sellers: the price has fixed below 50 MA and 100 MA.

The MACD histogram is in the negative zone, which indicates the bearish sentiment.

Stochastic Oscillator is in the neutral zone, the %K line has crossed the %D line. There are no signals at the moment.

Trading recommendations
  • Support levels: 1.3170, 1.3130, 1.3100
  • Resistance levels: 1.3210, 1.3235, 1.3250

If the price fixes below 1.3170, a further fall in USD/CAD quotes is expected. The movement is tending to 1.3140-1.3120.

An alternative could be the growth of the USD/CAD currency pair to 1.3240-1.3260.

The USD/JPY currency pair

Technical indicators of the currency pair:
  • Prev Open: 105.967
  • Open: 106.021
  • % chg. over the last day: +0.05
  • Day’s range: 105.808 – 106.034
  • 52 wk range: 101.19 – 112.41

The USD/JPY currency pair continues to consolidate. There is no defined trend. Investors expect additional drivers. At the moment, the key support and resistance levels are 105.80 and 106.10, respectively. We recommend paying attention to the dynamics of US government bonds yield. Positions should be opened from key levels.

The news feed on Japan’s economy is calm.

USD/JPY

Indicators do not give accurate signals: the price has fixed between 50 MA and 100 MA.

The MACD histogram has started declining, which indicates the bearish sentiment.

Stochastic Oscillator is in the neutral zone, the %K line has started crossing the %D line. There are no signals at the moment.

Trading recommendations
  • Support levels: 105.80, 105.55, 105.40
  • Resistance levels: 106.10, 106.50

If the price fixes above 106.10, further growth of USD/JPY quotes is expected. The movement is tending to 106.40-106.60.

An alternative could be a decline in the USD/JPY currency pair to 105.60-105.40.

by JustForex


This article reflects a personal opinion and should not be interpreted as an investment advice, and/or offer, and/or a persistent request for carrying out financial transactions, and/or a guarantee, and/or a forecast of future events.

Pelosi Pushes For 25th Amendment

By Orbex

Stubborn Jobless Claims Weigh In

The US index ended indecisively on Thursday as unemployment claims in America remained elevated.

Analysts believe that the labor market will continue cooling down through Q4 as the number of coronavirus cases continues to rise.

House Speaker Nancy Pelosi put her weight behind a 25th amendment bill.

This gives Congress a role in determining whether the President will be forced out of office because he is incapable of doing his job.

However, with this coming so close to the election, the chances of the bill being passed are pretty slim.

ECB Keeping a ‘Free Hand’ on Euro Exchange Rate

The euro finished 0.10% lower on Thursday as the pace of the currency’s appreciation was again called into question.

A further rise in the euro would be a “risk to both growth and inflation”, according to European Central Bank policymakers.

Yesterday’s meeting also highlighted that the current inflation outlook was highly dependent on the amount of fiscal and monetary stimulus.

Sterling Closes in on 1.30

The pound shrugged off potential restriction woes by closing 0.15% higher yesterday.

The hospitality sector will take another hit today, with certain parts of Scotland closing bars and restaurants for a two-week period from 6 pm.

Sterling will hope that a Brexit deal does not hit any further hurdles if it wants to break through the 1.30 handle.

Indices Maintain Their Grip

All major US indices were trading almost 1% higher on Thursday as talks of further stimulus continued.

The White House seems to have made another shift in its negotiating tactics, now reportedly wanting to reach a fiscal stimulus deal with Democrats.

Nancy Pelosi said that she would not support a tighter stimulus bill. This reminded investors that it remains all or nothing for a fiscal and coronavirus relief package, with party leaders still far apart on its size and scope.

Gold Heading for Another Push?

Gold closed in on the $1900 handles as it ended yesterday’s session up 0.32%.

Stimulus talks and the run-up to the presidency could see a continued shift in risk appetite. Bulls will be waiting for the next sell-off in the greenback for the potential for another push to record highs.

OPEC Rebuffs Claims of Oil Peak

Oil settled above $41 as it closed 0.17% higher yesterday.

The output of WTI decreased as further shutdowns of oil refineries in the Gulf of Mexico drove prices up. We can expect Hurricane Delta to make landfall later today.

OPEC recently dismissed concerns that a peak in oil demand was close. The thought of inventories increasing to pandemic levels was quickly put to bed by exporting organizations.

By Orbex

Will stocks breakout to new highs?

By Lukman Otunuga, Research Analyst, ForexTime

The markets are beginning to increasingly look through the two-party debate over new fiscal stimulus and along with the easing concerns around a contested election result, there’s an upbeat mood on Wall Street. As the Democratic challenger’s lead widens in the polls, hopes are rising that his party, which has already agreed a $2.2 trillion recovery package, could take control of both houses and open the spending taps within the first hundred days of his Presidency.

The Dollar is fairly listless against the majors with volatility drifting somewhat and most currencies holding within their established ranges. Of course, uncertainty around the US election is never far away and with just a few weeks left until polling day, we can’t rule anything out, especially when the incumbent and former reality TV star is struggling not to become one of only four other one-term Presidents in the last hundred years.

The ECB Minutes released earlier in the morning session stated that Euro appreciation has had a material impact on the inflation outlook. They also suggested that policymakers were in no hurry to increase the size of their bond buying programme. Interestingly, bond yields in the peripheral Eurozone countries continue to hit record lows with the Italian 10-year yield last night closing at the same level as the benchmark US 10-year Treasury yield.

Q3 Earnings next week

Companies listed on the S&P500 are set to report a big year-on-year decline in earnings of potentially over 20%, which could be their worst performance since the second quarter of 2009 at the height of the credit crisis. However, this nadir should be followed by a recovery triggered by jumbo-sized policy support.

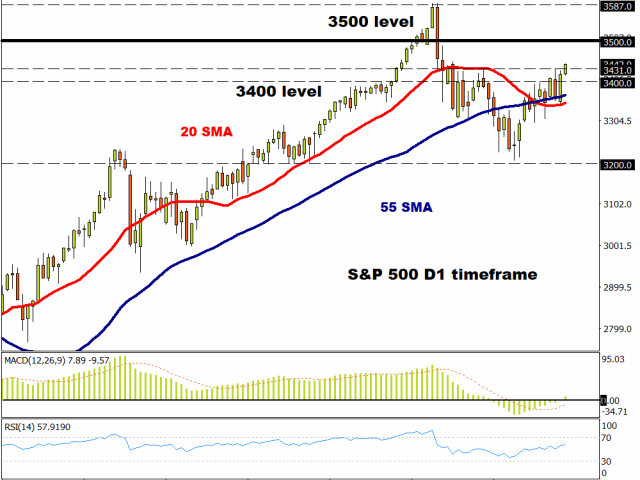
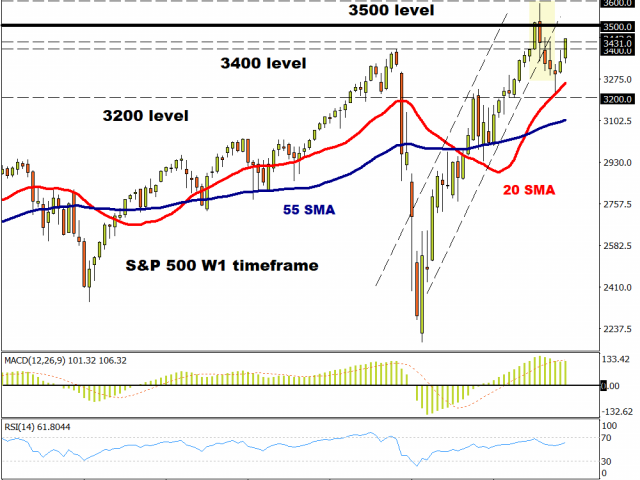
Technically, the S&P500 bounced convincingly off the 100-day MA at the end of last month and now looks to be moving out of its recent range, having consistently closed above the 55-day Moving Average all this week. If prices can close above 3431, then bulls will set their sights on the all-time highs at 3587.

Disclaimer: The content in this article comprises personal opinions and should not be construed as containing personal and/or other investment advice and/or an offer of and/or solicitation for any transactions in financial instruments and/or a guarantee and/or prediction of future performance. ForexTime (FXTM), its affiliates, agents, directors, officers or employees do not guarantee the accuracy, validity, timeliness or completeness, of any information or data made available and assume no liability as to any loss arising from any investment based on the same.


Forex-Time-LogoArticle by ForexTime

ForexTime Ltd (FXTM) is an award winning international online forex broker regulated by CySEC 185/12 www.forextime.com

The Dollar Index Is Consolidating. Investors Expect Additional Drivers

by JustForex

The greenback continues to show ambiguous results against its main competitors. Yesterday, the dollar index (#DX) closed the trading session with a slight decline (-0.07%). Investors expect additional drivers. Financial market participants continue to monitor the progress of a new stimulus package for the US economy. Donald Trump declined previous comments and said he was ready to approve support for individuals, small businesses and airlines.

The second wave of the coronavirus pandemic has come to the fore again. At the moment, the number of infected in the world has exceeded 36.4 million. Some EU countries have recorded a new anti-record for the number of infected and are planning to introduce new restrictive measures. ECB officials are concerned about the prospects for economic recovery in the Eurozone. The regulator is ready to expand financial incentives if necessary. Today, the UK has released a series of weak statistics on manufacturing output and the country’s GDP. We expect data on the labor market in Canada.

The “black gold” prices have been declining after a sharp rally the day before. At the moment, futures for the WTI crude oil are testing the $40.70 mark per barrel.

Market indicators

Yesterday, there was the bullish sentiment in the US stock market: #SPY (+0.89%), #DIA (+0.48%), #QQQ (+0.53%).

The 10-year US government bonds yield is consolidating. The indicator has reached 0.76-0.77%.

The news feed for 2020.10.09:
  • – Data on the labor market in Canada at 15:30 (GMT+3:00).

by JustForex


This article reflects a personal opinion and should not be interpreted as an investment advice, and/or offer, and/or a persistent request for carrying out financial transactions, and/or a guarantee, and/or a forecast of future events.

EURUSD significantly above 1.1600, despite rising US yields – 1,2000 soon?

By Admiral Markets

Economic Events October 09, 2020Source: Economic Events October 09, 2020 – Admiral Markets’ Forex Calendar

Into the weekly close, the economic calendar is quite thin, even though recent political developments are delivering enough fuel for potential volatility in FX markets and, thus, EURUSD.

Tuesday evening US President Donald Trump tweeted that he told his administration’s negotiators around US Treasury Mnuchin to end their current coronavirus stimulus talks with Democrats until after the US presidential election on the 3rd of November.

Here is what happened, as a result:

  • The US-Dollar saw an initial sharp push higher
  • EURUSD dropped, but the currency pair failed to gain further bearish momentum and stabilized around the short-term important support of 1.1680/1700
  • In less than 24 hours, EURUSD traded slightly below 1.1800 again

This underlines that US-Dollar long engagements should be taken, if at all, very cautiously.

That may be especially true since the US-Dollar hasn’t shown any signs of further strength or an acceleration of its recent short squeeze with 10-year US yields pushing to the highest levels since June.

In fact, we consider the implicit USD weakness over recent days as proof of our overall bullish EURUSD take, expecting it to trade around 1.2500 and even higher 6 to 12 months from now.

While we still foresee a stint to below 1.1600 and the currency pair testing the region around a potential mid-term long-trigger around 1.1450/1500, the US-Dollar could see heavier selling pressure, especially if the FED issues a Corona relief package for further monetary stimulus by significantly ballooning its balance sheet beyond the 7 trillion USD, thus, levelling the path back to 1.2000 in the days to come:

Admiral Markets MT5 with MT5SE Add-on EURUSD Daily chartSource: Admiral Markets MT5 with MT5SE Add-on EURUSD Daily chart (between July 03, 2019, to October 08, 2020). Accessed: October 08, 2020, at 10:00 PM GMT. Please note: Past performance is not a reliable indicator of future results, or future performance.


In 2015, the value of the EURUSD fell by 10.2%, in 2016, it fell by 3.2%, in 2017, it increased by 13.92%, in 2018, it fell by 4.4%, and in 2019, it fell by 2.2%, meaning that in five years, it was down by 7.3%.

Discover the world’s #1 multi-asset platform

Admiral Markets offers professional traders the ability to trade with MetaTrader 5, allowing you to experience trading at a significantly higher, more rewarding level than with MetaTrader 4. Experience benefits such as the addition of the Market Heat Map, so you can compare various currency pairs to see which ones might be lucrative investments, access real-time trading data, and so much more. Click the banner below to start your FREE download of MT5!

Trade With MetaTrader 5

Disclaimer: The given data provides additional information regarding all analysis, estimates, prognosis, forecasts or other similar assessments or information (hereinafter “Analysis”) published on the website of Admiral Markets. Before making any investment decisions please pay close attention to the following:

  1. This is a marketing communication. The analysis is published for informative purposes only and are in no way to be construed as investment advice or recommendation. It has not been prepared in accordance with legal requirements designed to promote the independence of investment research, and that it is not subject to any prohibition on dealing ahead of the dissemination of investment research.
  2. Any investment decision is made by each client alone whereas Admiral Markets shall not be responsible for any loss or damage arising from any such decision, whether or not based on the Analysis.
  3. Each of the Analysis is prepared by an independent analyst (Jens Klatt, Professional Trader and Analyst, hereinafter “Author”) based on the Author’s personal estimations.
  4. To ensure that the interests of the clients would be protected and objectivity of the Analysis would not be damaged Admiral Markets has established relevant internal procedures for prevention and management of conflicts of interest.
  5. Whilst every reasonable effort is taken to ensure that all sources of the Analysis are reliable and that all information is presented, as much as possible, in an understandable, timely, precise and complete manner, Admiral Markets does not guarantee the accuracy or completeness of any information contained within the Analysis. The presented figures that refer to any past performance is not a reliable indicator of future results.
  6. The contents of the Analysis should not be construed as an express or implied promise, guarantee or implication by Admiral Markets that the client shall profit from the strategies therein or that losses in connection therewith may or shall be limited.
  7. Any kind of previous or modelled performance of financial instruments indicated within the Publication should not be construed as an express or implied promise, guarantee or implication by Admiral Markets for any future performance. The value of the financial instrument may both increase and decrease and the preservation of the asset value is not guaranteed.
  8. The projections included in the Analysis may be subject to additional fees, taxes or other charges, depending on the subject of the Publication. The price list applicable to the services provided by Admiral Markets is publicly available from the website of Admiral Markets.
  9. Leveraged products (including contracts for difference) are speculative in nature and may result in losses or profit. Before you start trading, you should make sure that you understand all the risks.

By Admiral Markets

Japanese Candlesticks Analysis 08.10.2020 (EURUSD, USDJPY, EURGBP)

Article By RoboForex.com

EURUSD, “Euro vs. US Dollar”

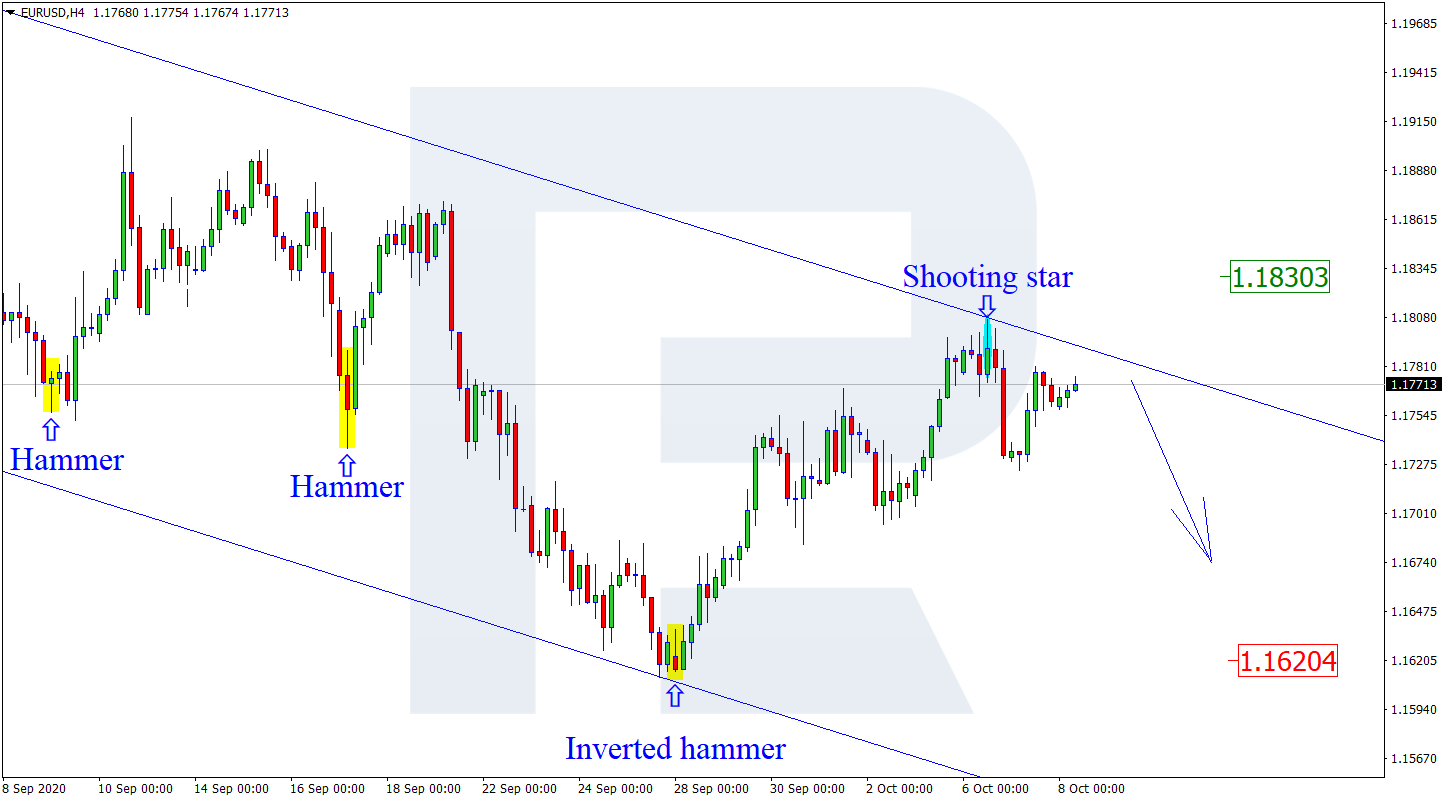
As we can see in the H4 chart, the asset is finishing the correction within the downtrend. By now, EURUSD has formed several reversal patterns, such as Harami and Shooting Star, close to the channel’s upside border. Possibly, the pair may reverse and resume its decline. In this case, the downside target may be the next support level at 1.1620. At the same time, an alternative scenario says that the instrument may grow to reach 1.1830 before resuming the downtrend.

EURUSD
Risk Warning: the result of previous trading operations do not guarantee the same results in the future

USDJPY, “US Dollar vs. Japanese Yen”

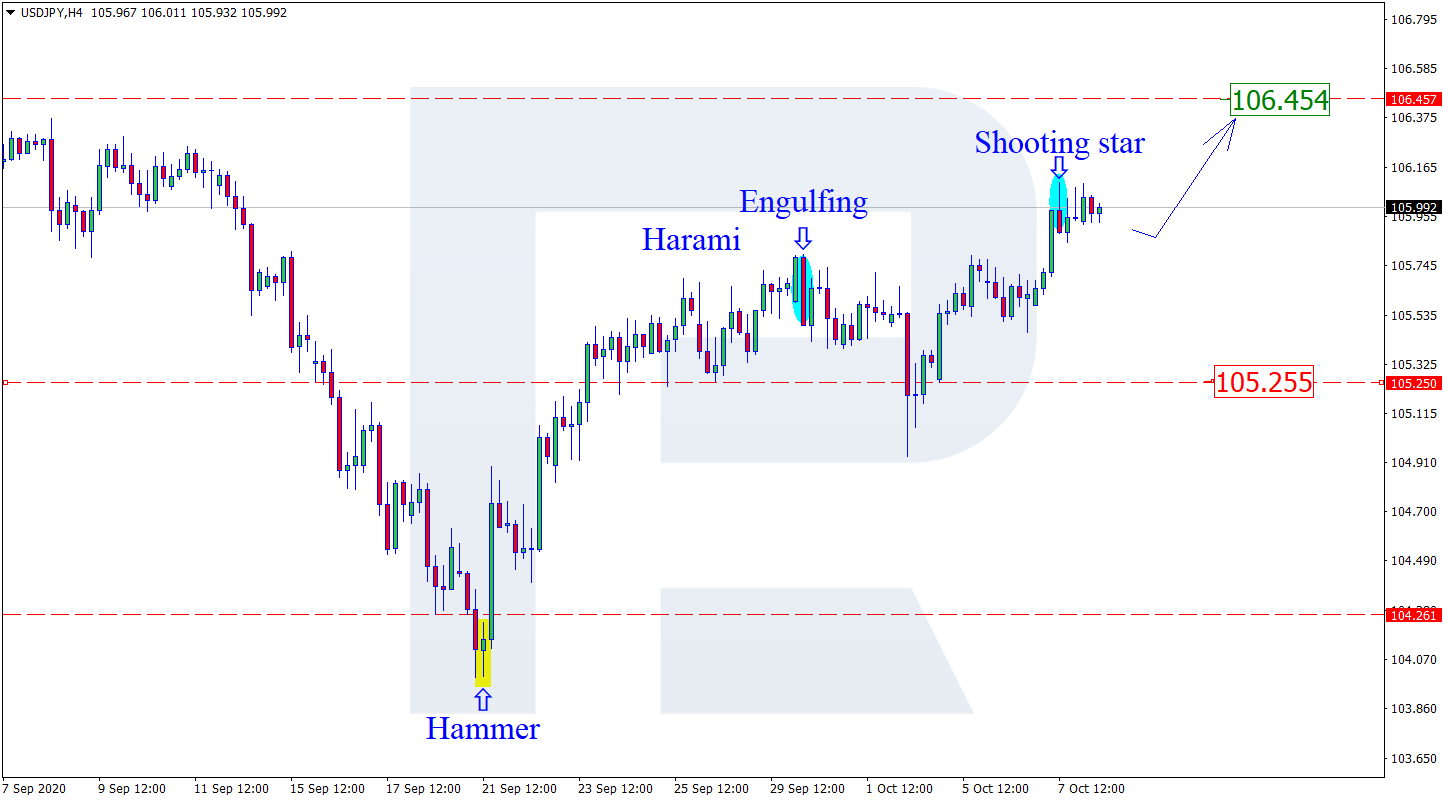
As we can see in the H4 chart, the uptrend continues. After forming several reversal patterns, such as Shooting Star, not far from the resistance level, USDJPY may reverse, form a slight correction, and then resume the ascending tendency. In this case, the upside target is the resistance level at 106.45. Still, there is an opposite scenario, which says that the instrument may correct towards 105.25 before resuming the uptrend.

USDJPY
Risk Warning: the result of previous trading operations do not guarantee the same results in the future

EURGBP, “Euro vs. Great Britain Pound”

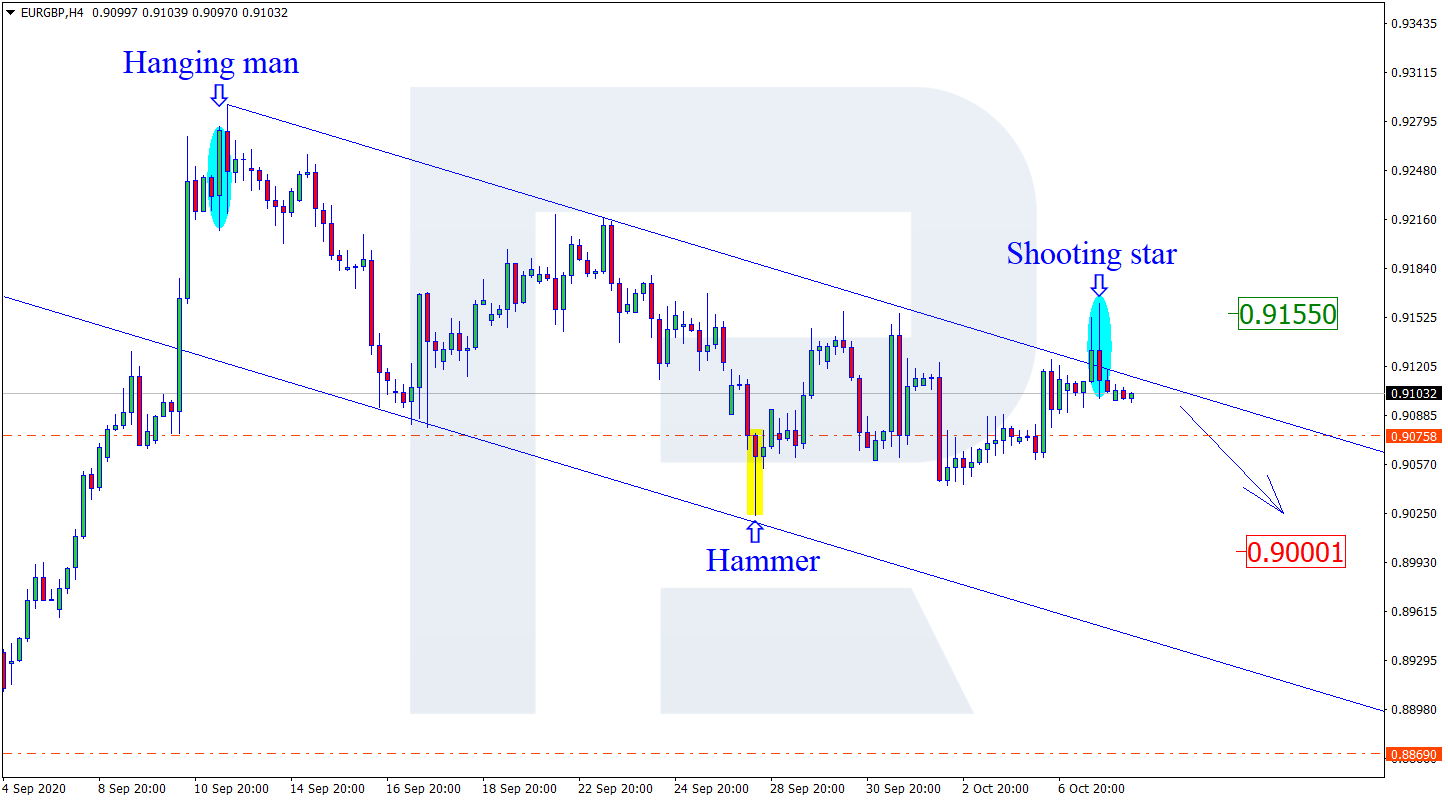
As we can see in the H4 chart, the asset is completing the correction within the descending tendency. After forming several reversal patterns, including Shooting Star, close to the resistance level, EURGBP is still reversing. The downside target is the support level at 0.9000. However, there might be another scenario, according to which the asset may return to 0.9155 without reversing.

EURGBP

Article By RoboForex.com

Attention!
Forecasts presented in this section only reflect the author’s private opinion and should not be considered as guidance for trading. RoboForex LP bears no responsibility for trading results based on trading recommendations described in these analytical reviews.