Mixed markets as stocks fall

By Han Tan, Market Analyst, ForexTime

A week is a long time…in markets!

It’s been a volatile few sessions for risk assets with disappointing results from the Tech titans adding to the fickle and rather febrile sentiment currently swirling around. Perhaps that’s to be expected with investors now focused more on what could go wrong as election week approaches. Markets have been playing the post-election reflation trade for the global economy into 2021, but there is certainly room for disappointment and especially if it takes a lot longer to figure out the eventual occupant of the Oval Office for the next four years.

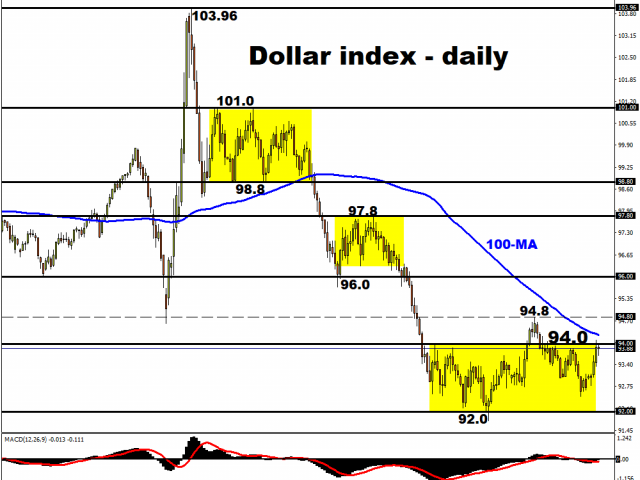
King Dollar is mixed on the day and checked by the 94 mark, but the greenback is on track for its strongest weekly performance in five amid the heightened risk aversion. It seems there is now a lot more talk of a closer US election than previously thought, with some of the key swing states like Pennsylvania, Michigan and Wisconsin unable to start counting early votes until Tuesday, meaning it is highly unlikely they will able to make a final announcement on election night.
The gloomy mood has been exacerbated by last night’s Big Tech earnings which beat analyst expectations, but disappointed on various other issues. For example, Apple and Facebook are both down around five percent, the former reflecting disappointment that the company did not release holiday quarter revenue guidance, while Facebook is still scolded by the bruising hearing from both Republicans and Democrats this week.

No support from record Eurozone GDP

The deteriorating situation in Europe concerning the rising infection and hospitalisation rates has overshadowed the (mixed) data released this morning. The region’s economy expanded by 12.7 percent in the third quarter after an 11.8 percent contraction in the previous quarter. But the record rebound still leaves Eurozone growth over four percent below its late-2019 high. A drop in the final quarter of this wretched year is now likely, which of course is prompting the ECB to pre-commit to extra stimulus measures in December. Will a determined Lagarde be pushed into action sooner?

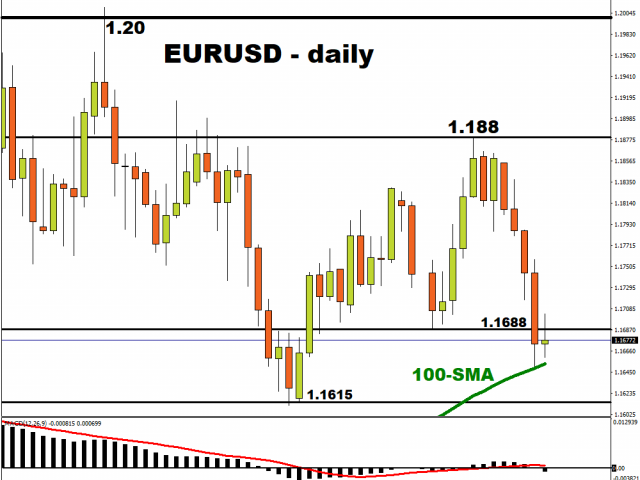
The 100-day moving average in EURUSD is acting as support at the moment with the world’s most heavily traded currency pair bouncing off yesterday’s low. The weekly close will be important to see if prices can hold below 1.1688 and break previous weekly support over the last few weeks. There looks like little support until 1.1615 after this.
 

Disclaimer: The content in this article comprises personal opinions and should not be construed as containing personal and/or other investment advice and/or an offer of and/or solicitation for any transactions in financial instruments and/or a guarantee and/or prediction of future performance. ForexTime (FXTM), its affiliates, agents, directors, officers or employees do not guarantee the accuracy, validity, timeliness or completeness, of any information or data made available and assume no liability as to any loss arising from any investment based on the same.


Forex-Time-LogoArticle by ForexTime

ForexTime Ltd (FXTM) is an award winning international online forex broker regulated by CySEC 185/12 www.forextime.com

Friday’s falling markets suggest trend acceleration as Gaps get filled

By TheTechnicalTraders 

– My research team and I have identified a series of Gaps and Gap Fills that may become very telling for the markets over the next 30 to 60+ days.  We have highlighted some Gaps in previous markets over the past 12+ months in some of our other research articles, but we believe the current Gap setups in the SPY, Dow Jones, and Transportation Index suggests extreme volatility should be expected from the markets over the next 60+ days.

First, let’s discuss what creates a gap in price and why it is important for Technical Analysis.  A Gap in price occurs when some major price event takes place between bars – causing a complete price void to take place (a Gap) in price.  Typically, this type of price activity is common as volatility expands and/or as price becomes very illiquid in trading.  Generally, Gaps do not occur often in trading as liquidity and price exploration normally provide enough depth to allow price to operate without Gaps.

Large bar Gaps are something we need to pay very close attention to as Technical Traders.  These types of price Gaps happen because of extreme fear or greed with heavy volume while trading.  They are completely different than low volume, low volatility price gaps that are a result of very illiquid market price activity.

SPY GAP ACTIVITY

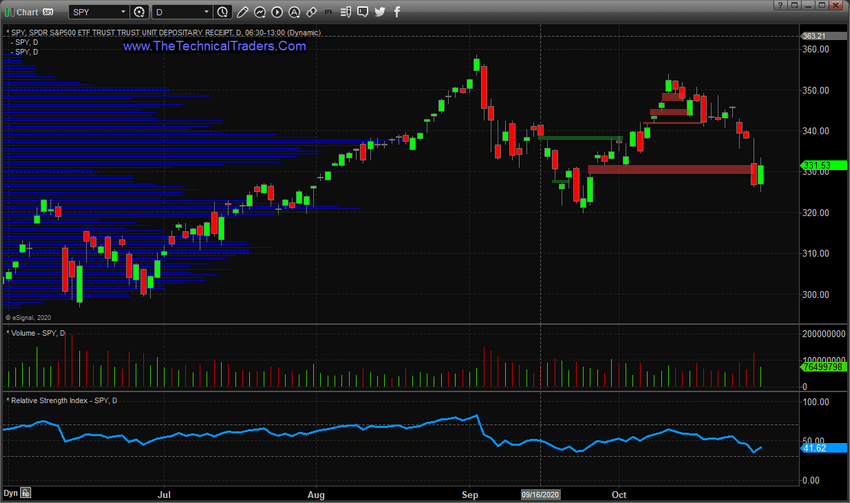
We can see a number of Gaps fill to the downside on the SPY Daily chart below.  We have highlighted the Upside Gaps with RED Rectangles and the Downside Gaps with GREEN Rectangles.  What I have found interesting is that the recent rotation in the SPY price over the past 60+ days has filled almost all of the recent Gaps in price and has recently closed a big Upside price Gap that originated near the end of September.  If the trend continues lower, downside trending may continue to seek out lower gaps from these levels.

INDU GAP ACTIVITY

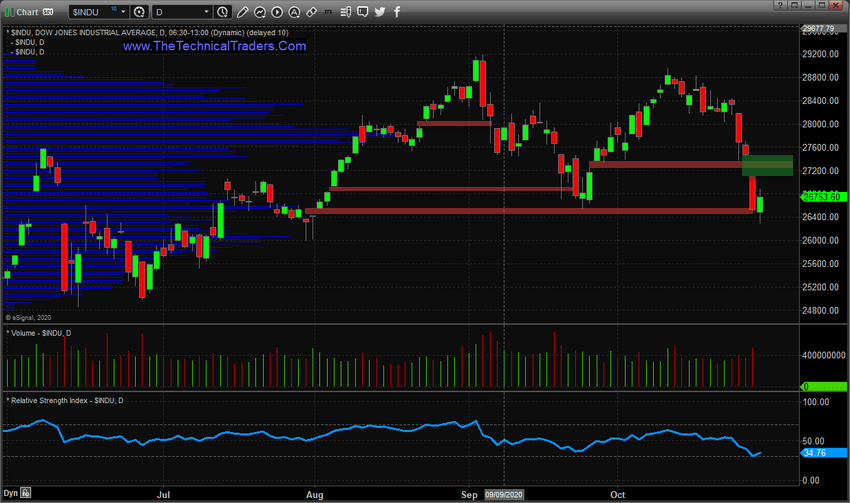
The INDU (Dow Jones Industrial Average) Daily chart below highlights the same type of Upside and Downside price Gaps.  You can see how nearly all of the recent Upside price Gaps have been filled by the current downside price move.  Yet, a new Downside price Gap was created by the big breakdown in price on October 28, 2020.  This massive Downside price Gap suggests downward trending was severe as fear drove a huge price void overnight.  Yet it also suggests that, at some point in the future, price will attempt to recover to “fill this gap”.

What is also interesting is that we can see an original gap (RED Upside Price Gap) was also skipped by the October 28, 2020 price gap.  This creates a “Double Gap” setup on this chart which indicates a potential for a very strong downside price trend at the current moment and suggests that these Gaps will be filled by upside price activity at some point in the future.  As long as these gaps stay Open, they represent a very key price level for future price activity and suggest this “Price Void” is a key price trend level.

Additionally, pay attention to how the INDU Daily chart was able to establish a new lower low price level recently compared to the previous low price trough.  When we take into consideration the failure of the recent price peak to break the previous price peak high, this suggests a bearish price trend may be tart to initiate based on simple Fibonacci Price Theory.

TRANSPORTATION INDEX GAP ACTIVITY

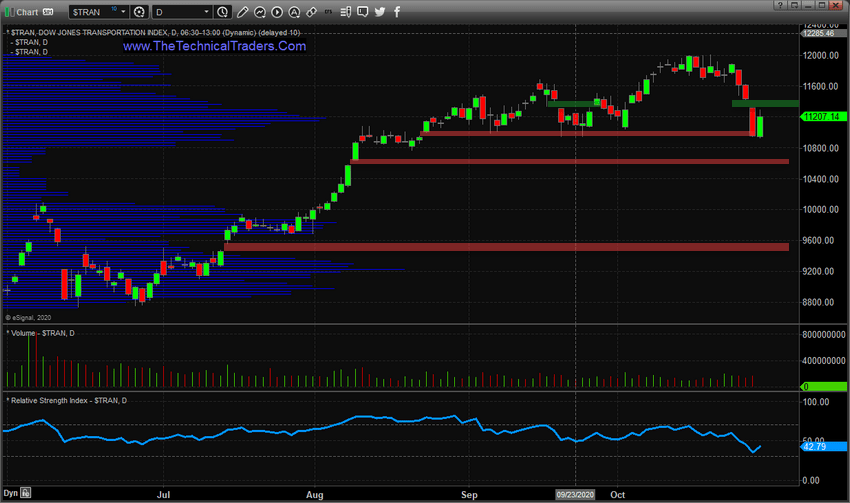
The following Daily Transportation Index also shows the same October 28, 2020 price Gap as the INDU chart.  My research team believes the uniformity of these Gaps suggests that price trending has entered a new phase as we head into the November Elections.  The TRAN chart highlights really only one Downside price Gap, which is a critical level on the chart for traders. The 11,420 level will likely become critical resistance at some point in the near future.

Also, pay attention to how the Transportation Index setup a new lower low price recently.  Although it may be difficult to see on this chart, the new lower low price confirms an attempted downside price trend is setting up and confirmed simple Fibonacci Price Theory that suggests the markets may be poised for big trends soon.

We have highlighted the 26,000 level on the Dow Jones as critical support.  It is important that this level continues to act as a floor for price.  This would translate to a level of 315 for the SPY and 10,650 for the TRAN.

Any future price breakdown below these levels would indicate the markets have broken key support levels and are attempting to head lower.  Currently, though, the market price levels are still above these key levels.  This suggests the recent price Gaps will likely be filled as price attempts to find a bottom and resume an upward price trend after the elections.

One thing is certain, this extended volatility and price rotation presents some real opportunities for skilled traders as long as one properly addresses risk and volatility concerns.  To learn how we are tackling these price trends, visit TheTechnicalTraders.com to sign up for your daily pre-market report, walking you through the charts of the major asset classes.

Chris Vermeulen
Chief Market Strategist
www.TheTechnicalTraders.com

NOTICE AND DISCLAIMER: Our free research does not constitute a trade recommendation or solicitation for our readers to take any action regarding this research.  It is provided for educational purposes only – read our FULL DISCLAIMER here.


Chaotic contested presidential election? Investors should prepare now

By George Prior

Investors should be expecting and preparing for significant market volatility in the event of a disputed outcome of the U.S. presidential election in five days’ time, warns the CEO of one of the world’s largest independent financial advisory and fintech organizations.

The warning from Nigel Green, the chief executive and founder of deVere Group, which has $12bn under advisement, comes as President Donald Trump and his Democratic White House rival Joe Biden both hold rallies in the critical election state of Florida.

Biden maintains a substantial lead over Trump nationwide, according to most polls.

Mr Green says: “Biden is leading in the polls and the markets have already priced-in victory for the Democrats.

“This is demonstrated by investors in recent weeks piling into renewables, industrials and other sectors that could benefit from a Joe Biden administration.

“However, history has taught us not to underestimate Trump. More than 81 million people may have already voted ahead of election day on 3 November, but these voters are more likely to be Democrats and Republicans.

“Indeed, Trump has urged supporters to wait and vote on the day itself due to alleged concerns on mail-in voting.

“As such, we could see an important shift in numbers, with Trump making gains on Biden.”

He continues: “Trump has repeatedly signalled he could contest the election outcome if it is unfavourable to him.

“Should Trump reject the result it would lead to a long-winded post-election struggle in the courts – and on the streets – that could last for months.

“This major political uncertainty in the world’s largest economy would generate significant market volatility across the globe.”

Investors should now be expecting and preparing for this possible scenario, according to the deVere CEO.

“Volatility is not always a bad thing – in fact, it can be useful to investors. They should now be asking themselves: ‘Is my portfolio best-positioned to mitigate the potential risks but to seize the opportunities?’”

He goes on to add: “Markets loathe uncertainty, so in the event of a contested result, safe-haven assets will get a boost – especially non-sovereign classes such as gold and Bitcoin.”

Mr Green concludes: “The uneasy reality is that the political stalemate in the U.S. could continue into 2021.

“Should this happen, the markets will reflect the chaos and remain meaningfully turbulent.

“As ever, to grow and protect their wealth, investors are urged to remain in the market and ensure adequate portfolio diversification in order to take advantage of the opportunities that will inevitably be presented.”

About:

deVere Group is one of the world’s largest independent advisors of specialist global financial solutions to international, local mass affluent, and high-net-worth clients.  It has a network of more than 70 offices across the world, over 80,000 clients and $12bn under advisement.

The Policy Changes That Could Come With A Biden Presidency

By Orbex

Like with all elections, there is a difference between what politicians say they will do, and what they actually end up accomplishing. Or whether they even try in the first place.

The market doesn’t care about the promises of politicians. So, traders need to focus on what is likely to happen regardless of political inclination.

Although polls are narrowing, projections by most analysts still indicate a Joe Biden win.

We already know what a Donald Trump presidency looks like, so what might change?

The market reaction

Historically, when there is a new President, the market doesn’t do so well.

There is a diverse range of explanations for it, but the S&P 500 averaged a gain of just 5% in the six months following a change in president over the last thirty years.

Compare that to a little over 30% gain when the president was reelected.

Also, from the same time span, Democratic presidencies have seen faster growth in the stock market than Republican ones, contrary to popular perception.

However, Democratic presidents have had to deal with having at least one of the chambers of Congress in Republican control for most of their term.

Which brings us to a major caveat of a potential Biden presidency.

It’s more about what you can do than what you want to do

The same polls that suggest Biden is the favorite to win the presidency also suggest that Republicans will retain control of the Senate.

Even if Democrats retake the Senate, it’s very, very unlikely they will obtain 60 seats. And that is the magic number needed to stop Republicans from filibustering motions.

In other words, even in the best-case scenario for Democrats, Biden will have to at least negotiate with Republicans. He’ll also have to potentially modify significant portions of his program.

That is, unless the Democrats follow through on some of their rhetoric about modifying Senate procedure, such as getting rid of the filibuster.

What to expect

Out of the myriad policy proposals available on Biden’s campaign site, there are relatively few that we can expect to directly impact the market. The three key ones are:

1. Raising taxes

Biden has promised to “undo” the Trump tax cuts. However, seeing that many “average” Americans also benefited from them, Biden has modified his stance, saying he would only raise taxes on the “wealthy” and corporations.

Higher corporate taxes and, in particular, a financial transactions tax as advanced by his predecessor would likely weigh substantially on the stock market.

2. Environmental spending

Biden has both endorsed and rejected the “Green New Deal” which envisions massive infrastructure spending.

Regardless of that particular talking point, it’s pretty sure a Biden presidency would curtail fracking to some extent. It would also substantially increase spending on renewable energy.

3. Bidencare

The details are still nowhere to be found, but the general idea is a more robust form of Obamacare.

Increased government spending on health care without eliminating private insurance would likely support the financial and health care sector, leading it to outperform other areas in the market.

Finally, Biden would likely put an end to US trade wars. While the other three points require negotiation with Congress, trade policy is almost exclusively a presidential prerogative.

By Orbex

Metals Turn Lower As USD Recovers

By Orbex

Gold

The yellow metal has been firmly lower this week, in response to the rally which has taken place in the US dollar.

It seems that amidst the building fears around a second wave of COVID-19, safe haven flows have gravitated back towards the dollar.

Fresh lockdowns have been announced in France and Germany this week. And there are expectations that other countries, including the UK, will soon follow.

It seems the market is shifting back towards the dynamic seen during the height of wave one of the pandemic. Then, too, equities and gold fell in tandem as the dollar traded higher. Interestingly, the dollar looks to also be deriving some support from better recent polling results for Donald Trump.

The US president has seen a small increase in his national rankings over recent days. He has also made gains in battleground states, with Florida now switching in favor of Trump.

At the very least, the dollar looks to be gaining on the reduced likelihood of the Democrats gaining control of both the Senate and the White House.

As we head through to the elections next week, the market will become highly sensitive to polling results. And we can expect plenty of volatility in reaction to the elections, regardless of who wins.


Gold Reverses From Key Resistance

Gold prices have once again turned lower from the 1919.92 level which continues to act as a firm resistance. While below here, we can expect a test of the 1826.71 level.

Bulls will need to defend this level to keep the medium-term view bullish. A break below there would affect a shift in view towards gold.

Silver

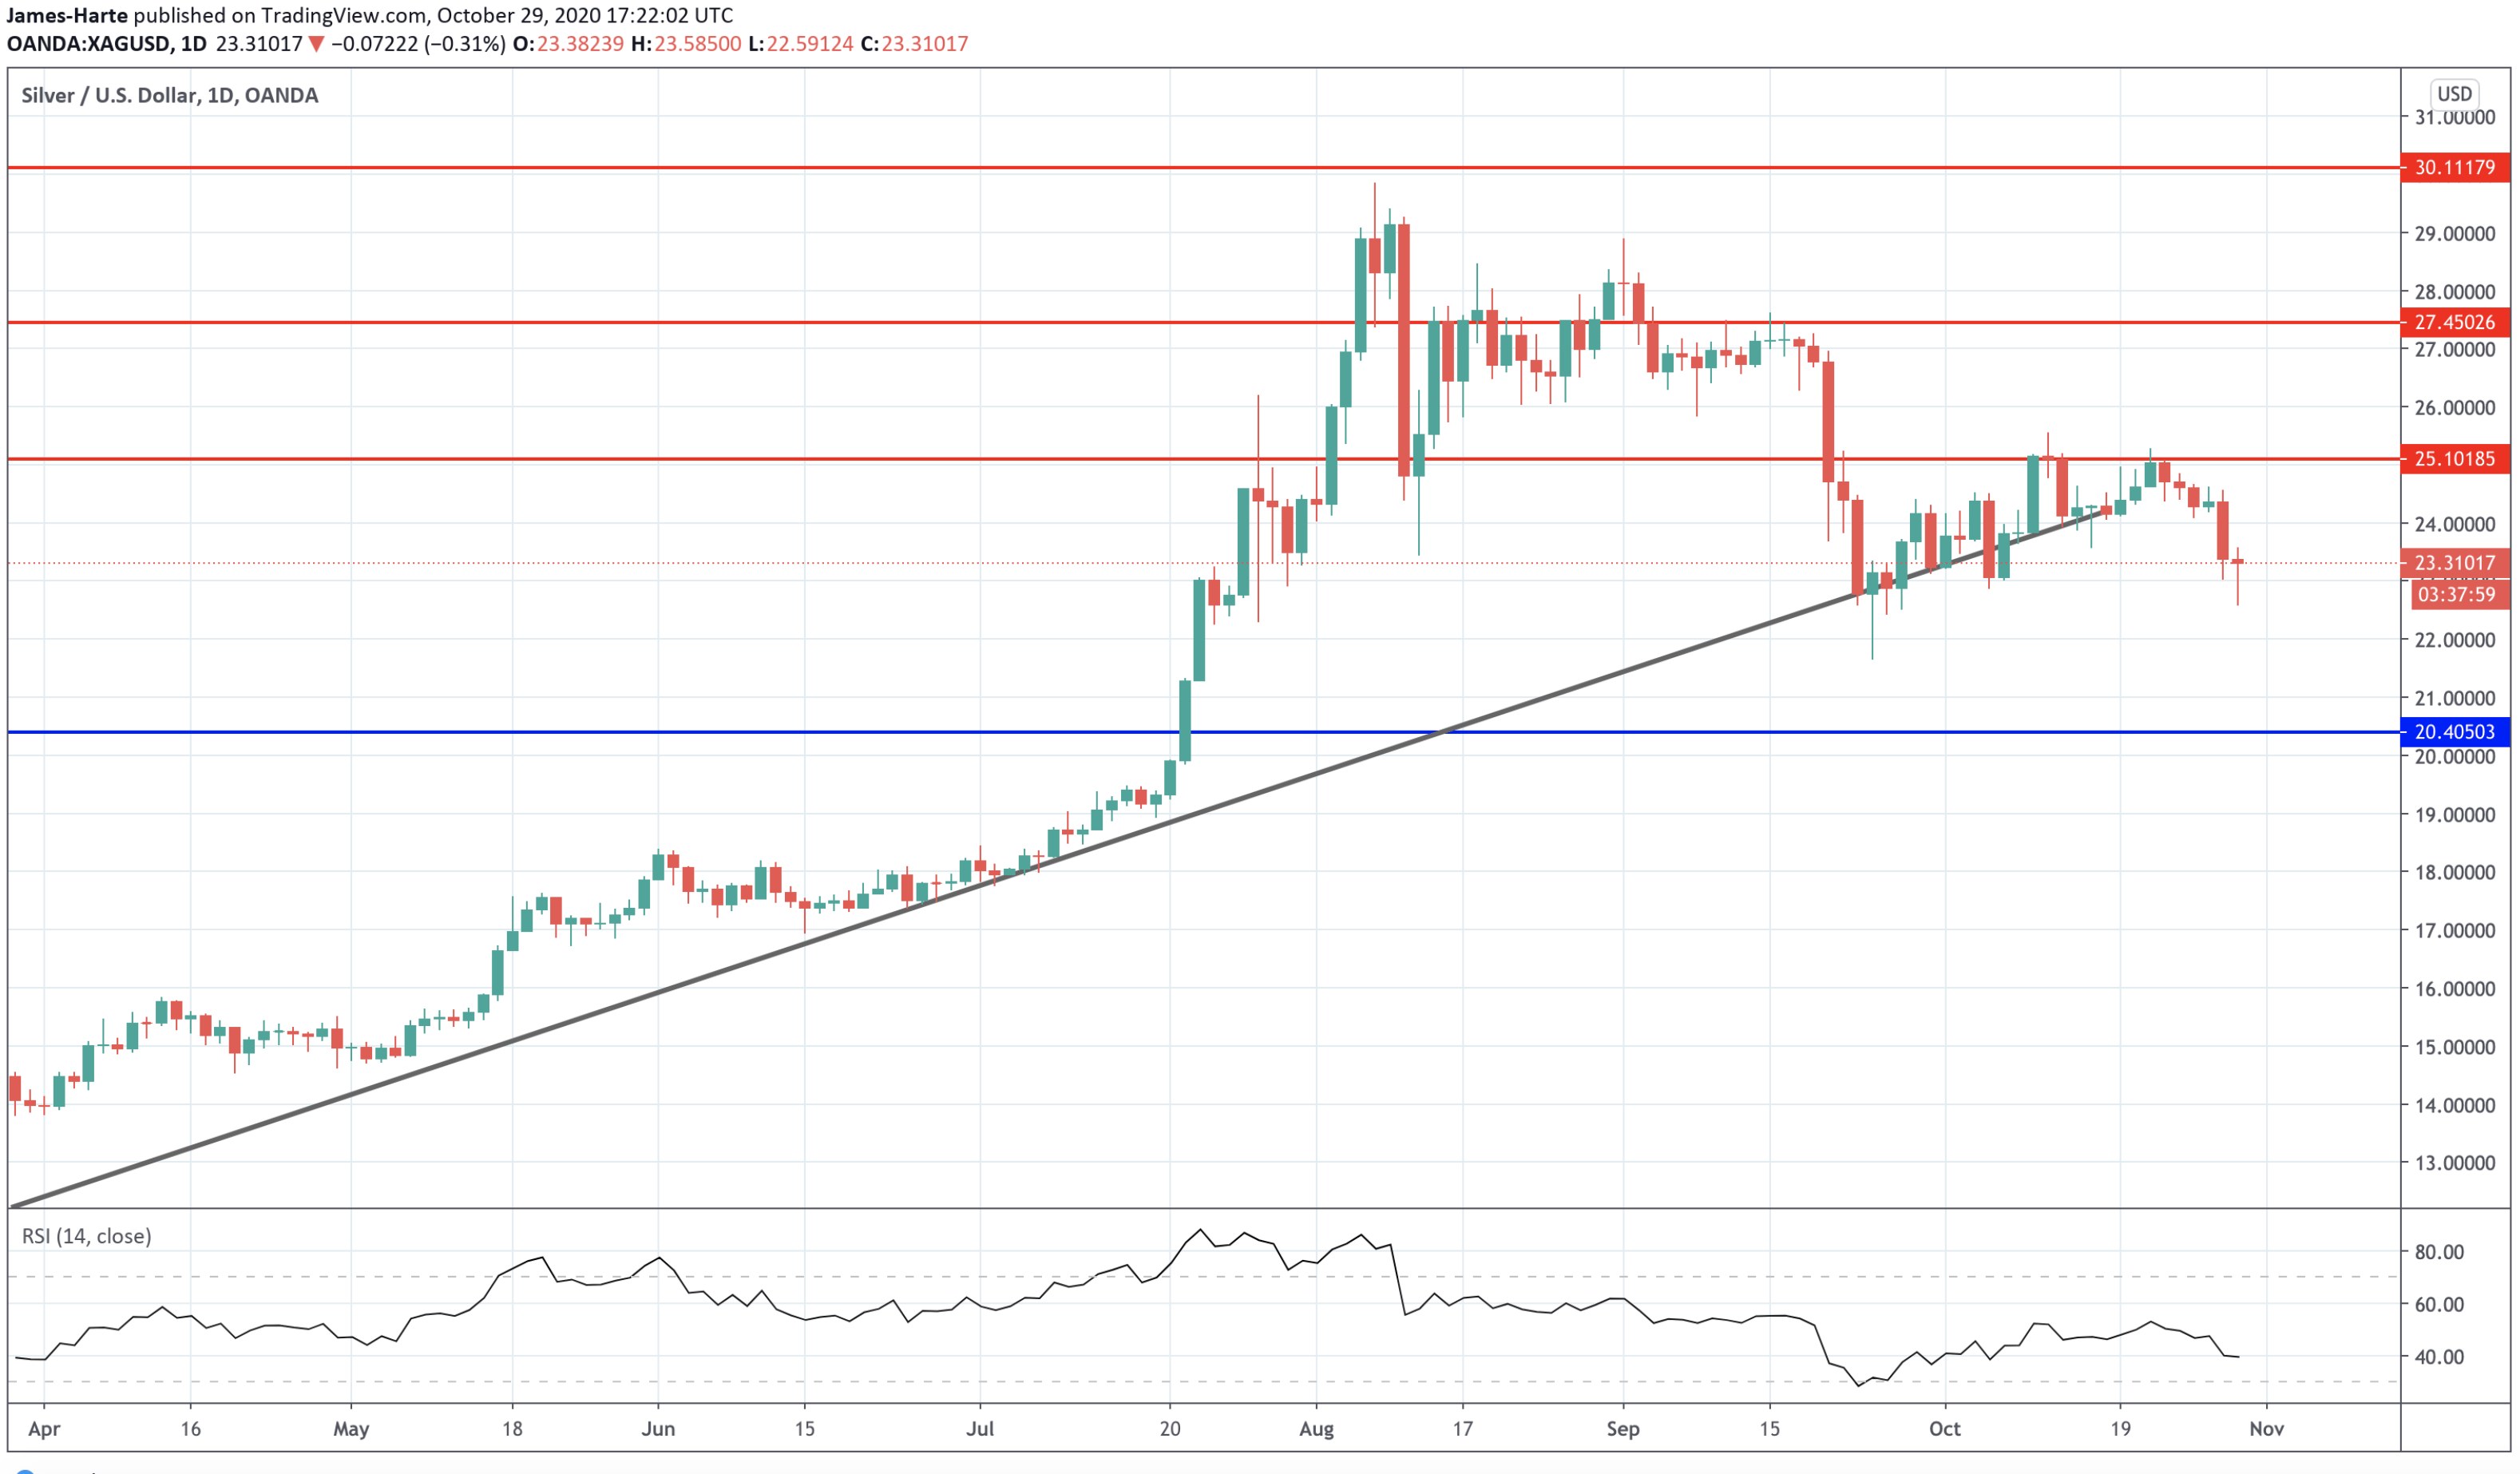
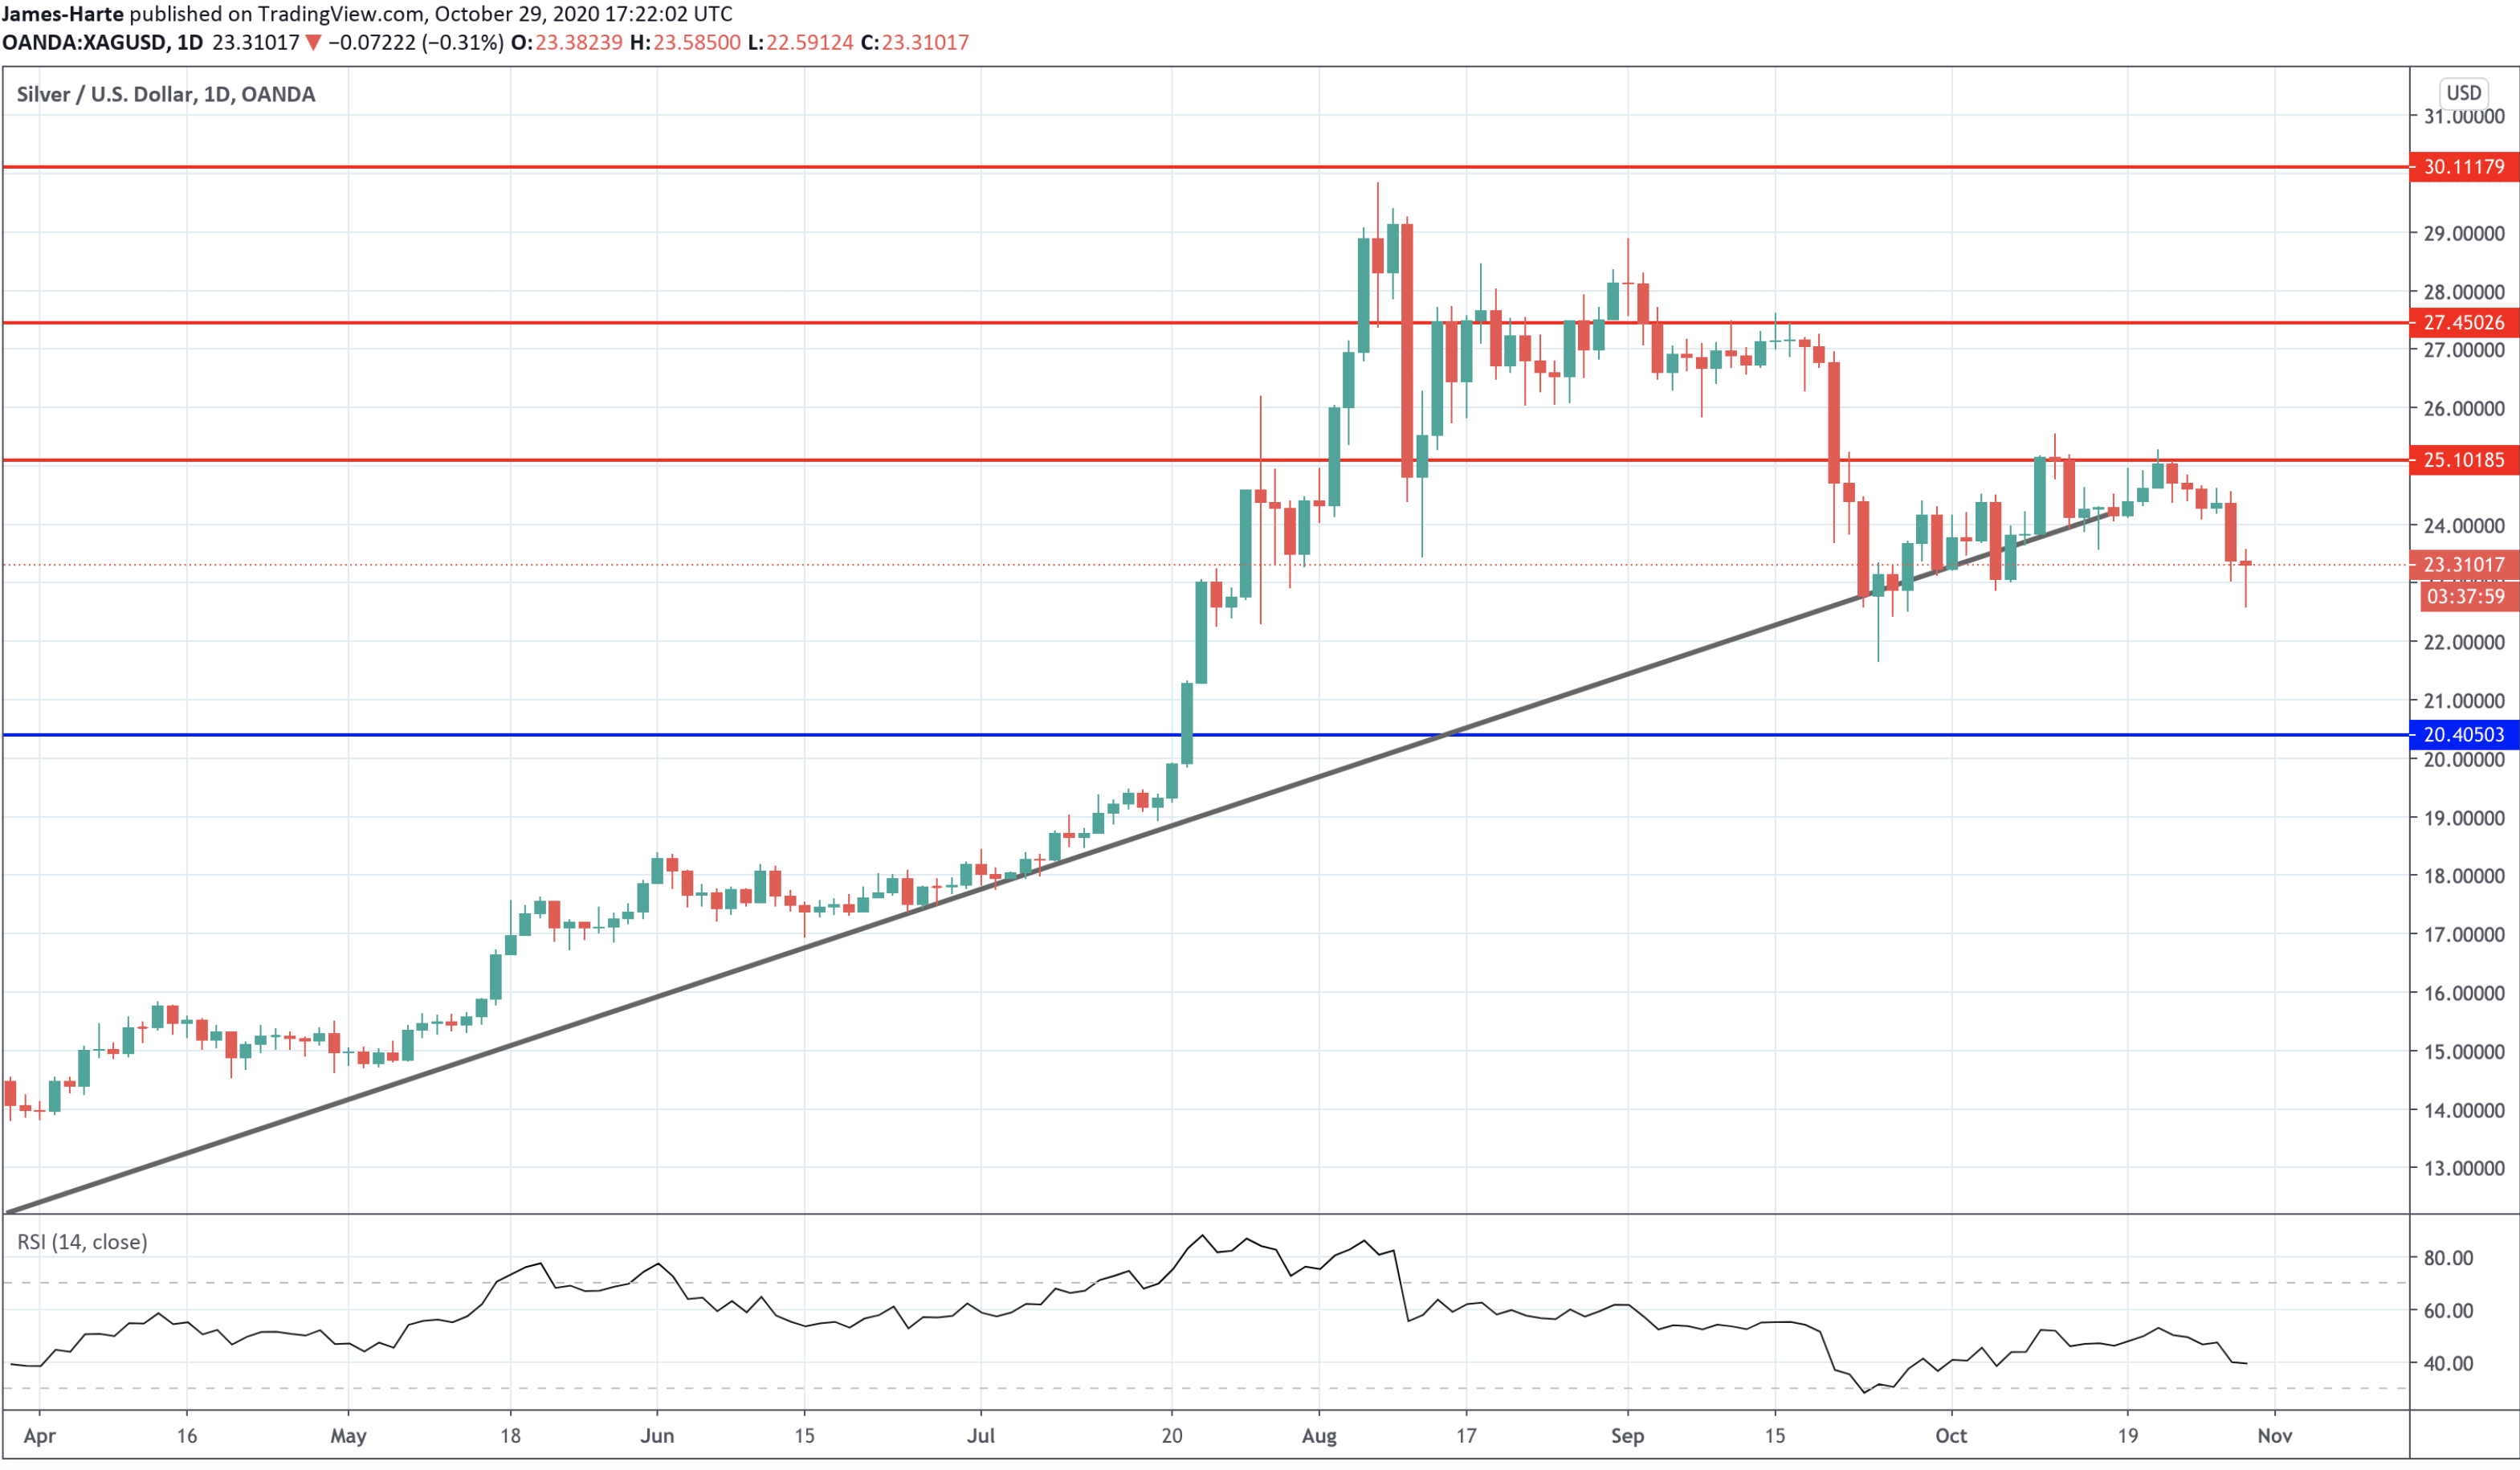
Silver prices have been knocked lower this week also. The metal has been weighed upon not only by the downside moves in gold and upward action in the US dollar but also by the sell-off in equities markets.

Last week’s manufacturing readings showed that the factory sector has seen a heavy loss of momentum in the UK and the US. This raises concerns over the demand outlook for silver in the near term.

With European countries now starting to move back into lockdown, the outlook for silver doesn’t look too encouraging here.

Silver Turning Lower Again

Silver prices have once again failed to break above the 25.1018 level resistance. And, while below there, the market remains vulnerable to a further move lower towards the 20.4050 level next.

To the topside, any break back above the 25.1018 level, will turn attention back to the 27.4502 level next.

By Orbex

Ichimoku Cloud Analysis 30.10.2020 (BTCUSD, USDCHF, BRENT)

Article By RoboForex.com

BTCUSD, “Bitcoin vs US Dollar”

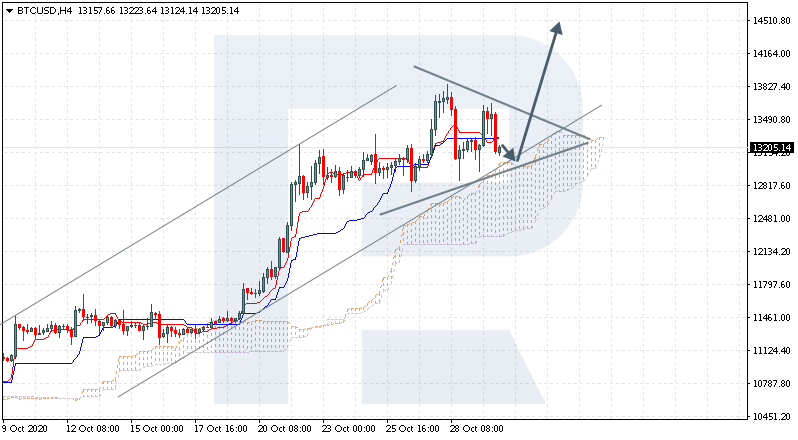
BTCUSD is trading at 13205.00; the instrument is moving above Ichimoku Cloud, thus indicating an ascending tendency. The markets could indicate that the price may test the cloud’s upside border at 13055.00 and then resume moving upwards to reach 14515.00. Another signal in favor of further uptrend will be a rebound from the downside border of a Triangle pattern. However, the bullish scenario may no longer be valid if the price breaks the cloud’s downside border and fixes below 12145.00. In this case, the pair may continue falling towards 11705.00. To confirm further growth, the asset must break the pattern’s upside border and fix above 13405.00.

BTCUSD
Risk Warning: the result of previous trading operations do not guarantee the same results in the future

USDCHF, “US Dollar vs Swiss Franc”

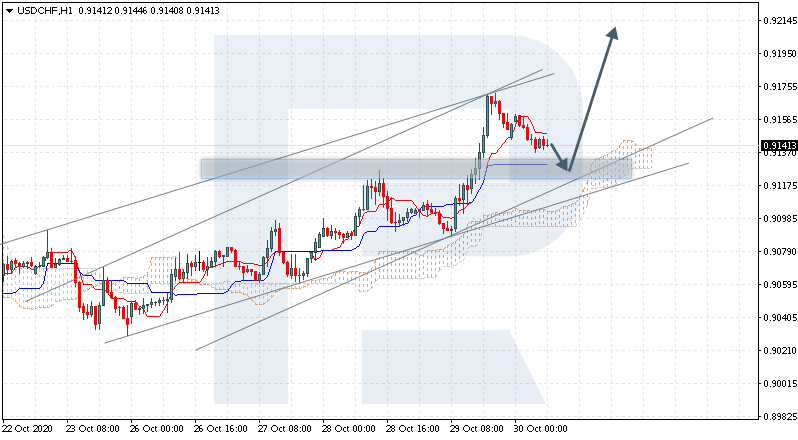
USDCHF is trading at 0.9141; the instrument is moving above Ichimoku Cloud, thus indicating an ascending tendency. The markets could indicate that the price may test Tenkan-Sen and Kijun-Sen at 0.9125 and then resume moving upwards to reach 0.9215. Another signal in favor of further uptrend will be a rebound from the rising channel’s downside border. However, the bullish scenario may no longer be valid if the price breaks the cloud’s downside border and fixes below 0.9075. In this case, the pair may continue falling towards 0.8995.

USDCHF
Risk Warning: the result of previous trading operations do not guarantee the same results in the future

BRENT

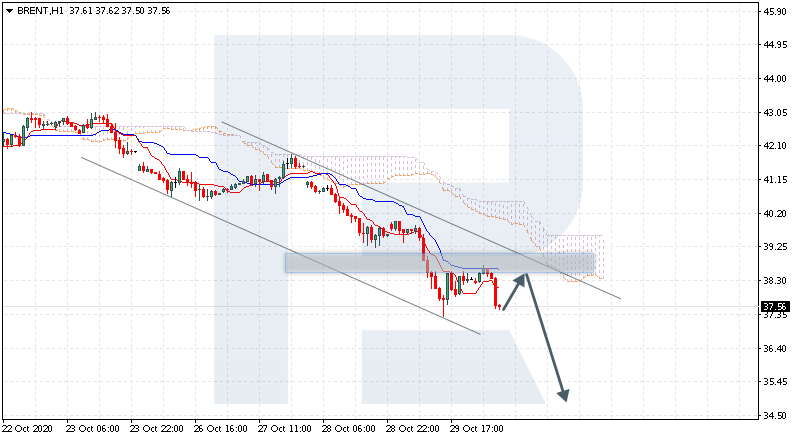
Brent is trading at 37.56; the instrument is moving below Ichimoku Cloud, thus indicating a descending tendency. The markets could indicate that the price may test Tenkan-Sen and Kijun-Sen at 38.30 and then resume moving downwards to reach 34.85. Another signal in favor of further downtrend will be a rebound from the descending channel’s upside border. However, the bearish scenario may no longer be valid if the price breaks the cloud’s upside border and fixes above 40.35. In this case, the pair may continue growing towards 41.55.

BRENT

Article By RoboForex.com

Attention!
Forecasts presented in this section only reflect the author’s private opinion and should not be considered as guidance for trading. RoboForex LP bears no responsibility for trading results based on trading recommendations described in these analytical reviews.

Fibonacci Retracements Analysis 30.10.2020 (BITCOIN, ETHEREUM)

Article By RoboForex.com

BTCUSD, “Bitcoin vs US Dollar”

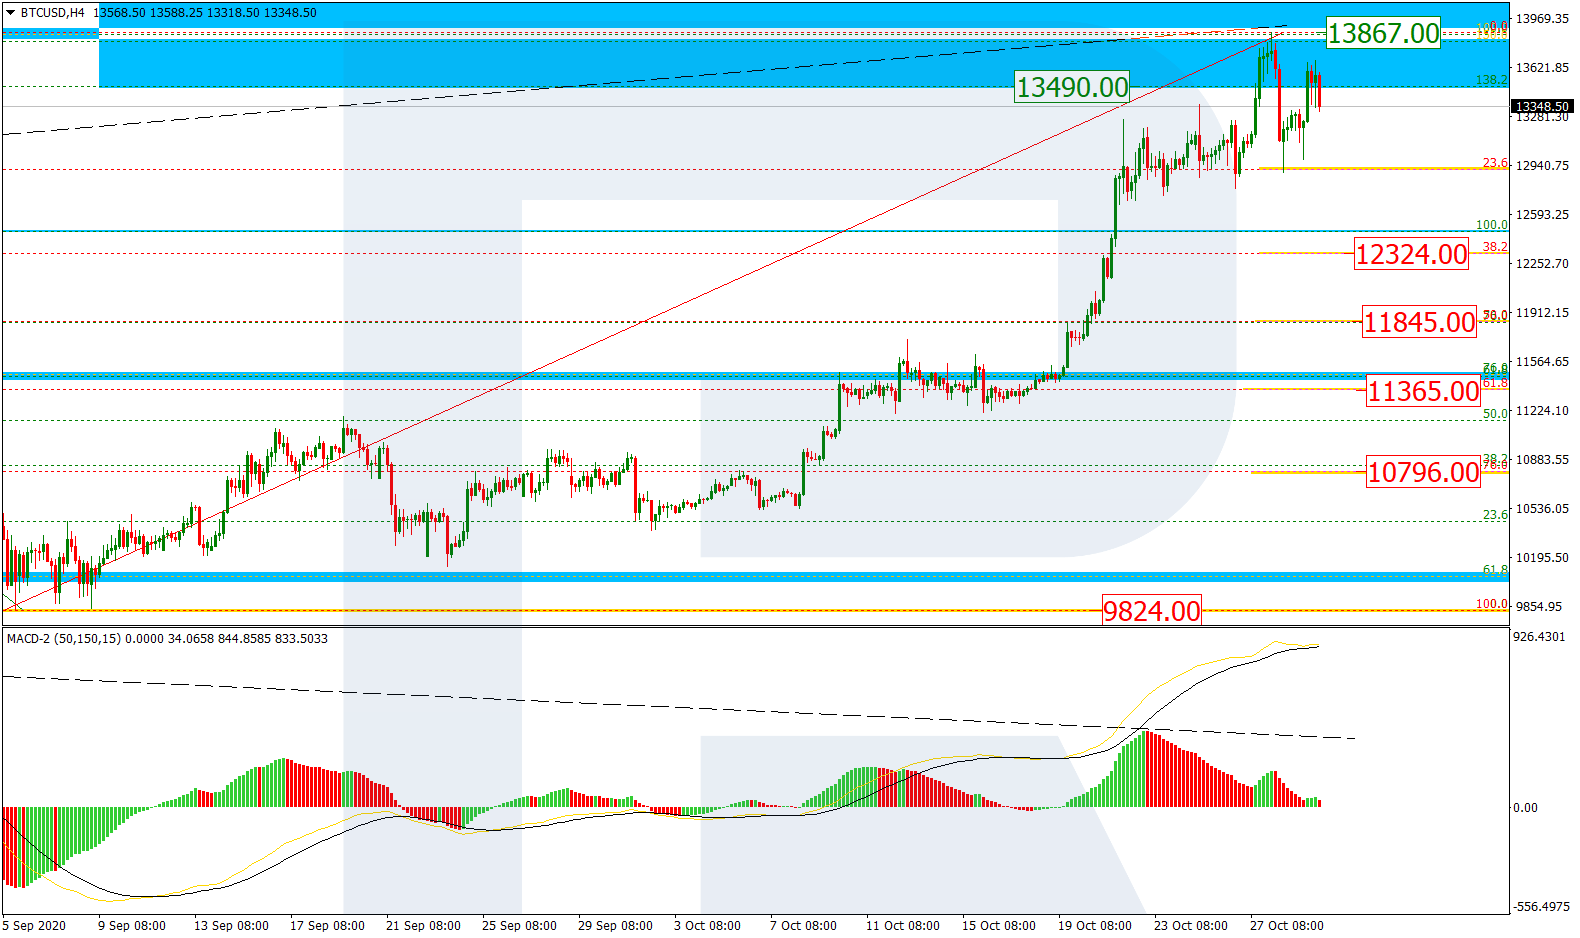
In the H4 chart, after updating its two-year high, BTCUSD has tested the post-correctional extension area between 138.2% and 161.8% fibo at 13490.00 and 14115.00 respectively. At the same time, there is a divergence within the uptrend, which may indicate a possible pullback or reversal. The key downside target will be the fractal support at 9824.00.

BTCUSD_H4
Risk Warning: the result of previous trading operations do not guarantee the same results in the future

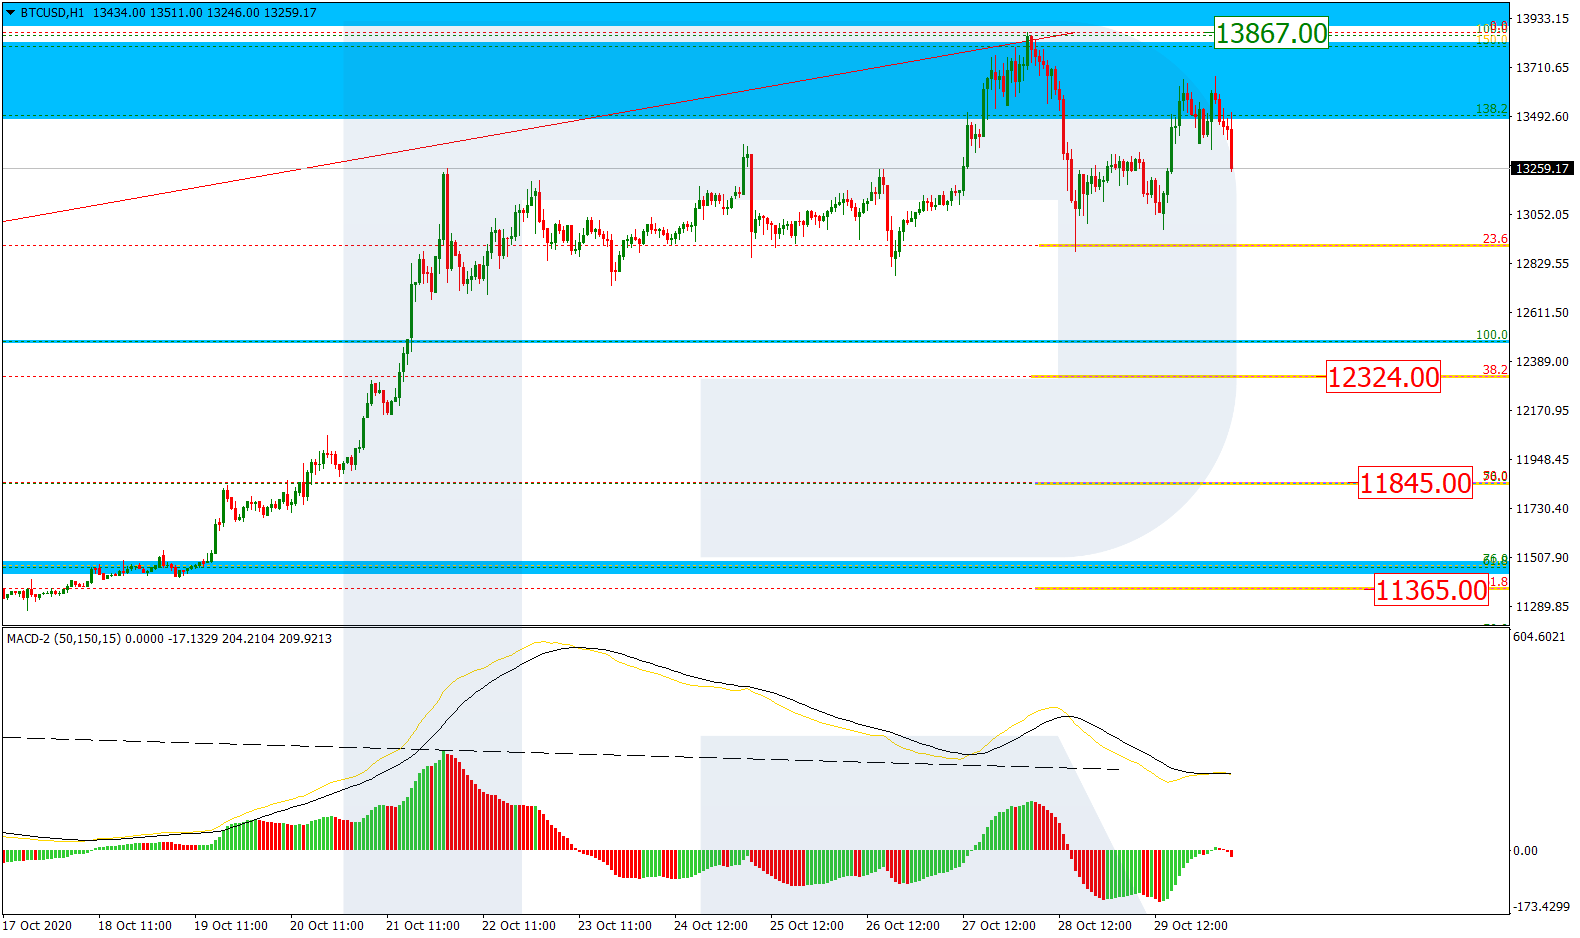
The H1 chart shows the start of a new decline after the divergence on MACD. After reaching and testing 23.6% fibo, this descending movement may continue towards 38.2%, 50.0%, and 61.8% fibo at 12324.00, 11845.00, and 11365.00 respectively. The resistance is the high at 13867.00.

BTCUSD_H1
Risk Warning: the result of previous trading operations do not guarantee the same results in the future

ETHUSD, “Ethereum vs. US Dollar”

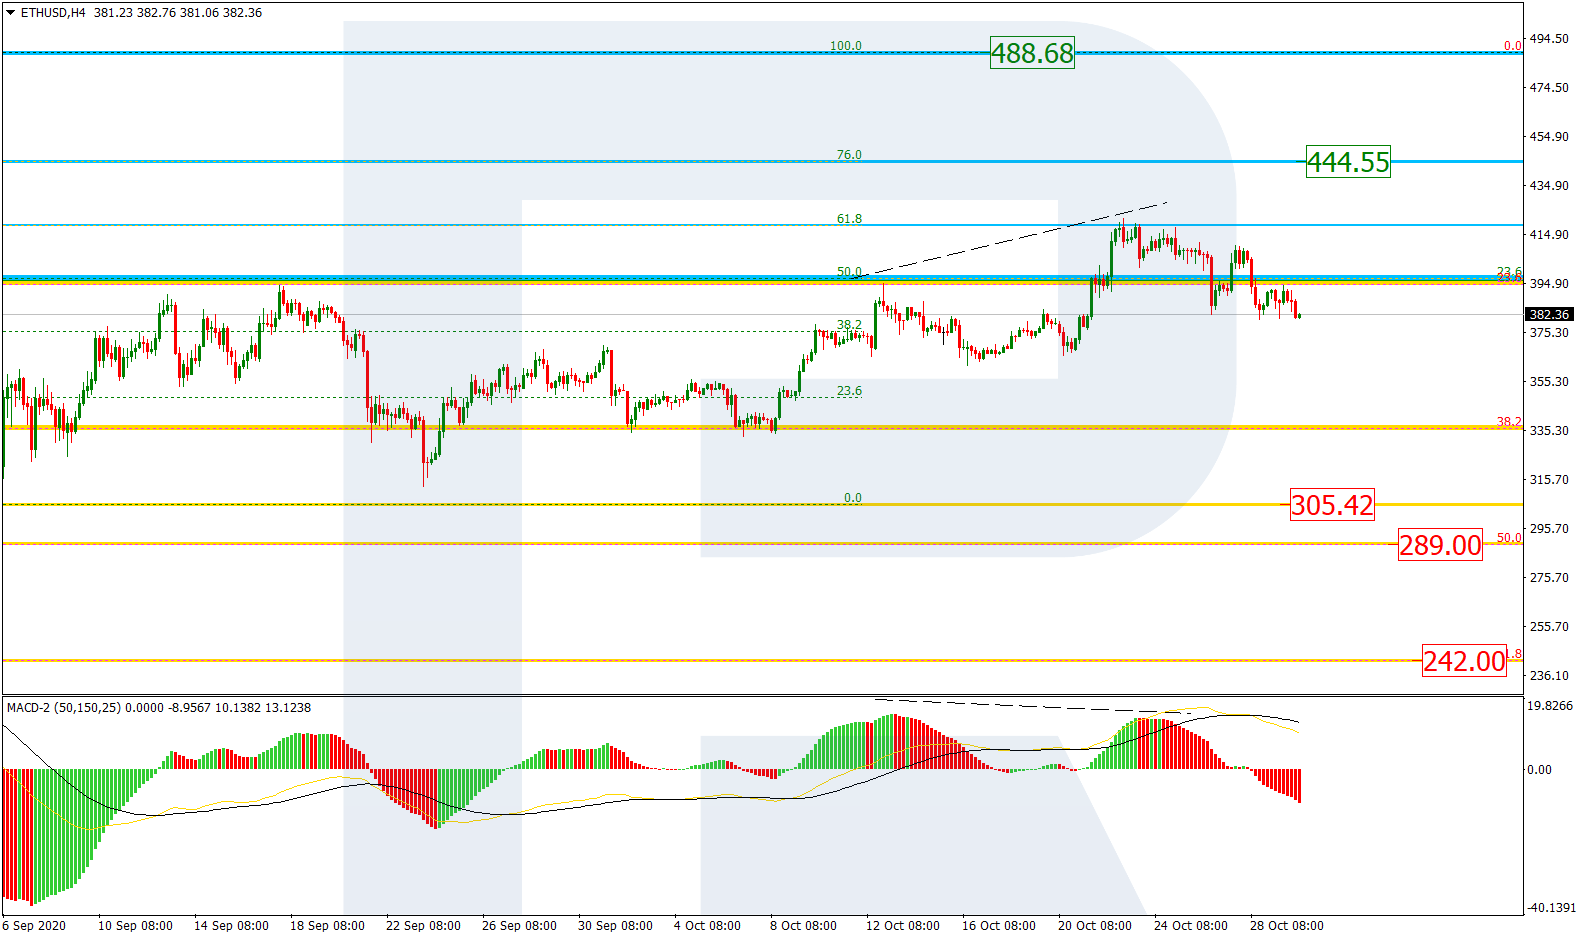
As we can see in the H4 chart, after completing the descending structure, ETHUSD has reached 61.8% fibo and may yet continue growing to reach 76.0% fibo at 444.55. However, there is a divergence on MACD, which may hint at a new descending structure with the key target at the low at 305.42. The mid-term bearish scenario implies further decline towards 50.0% and 61.8% fibo at 289.00 and 242.00 respectively.

ETHUSD_H4
Risk Warning: the result of previous trading operations do not guarantee the same results in the future

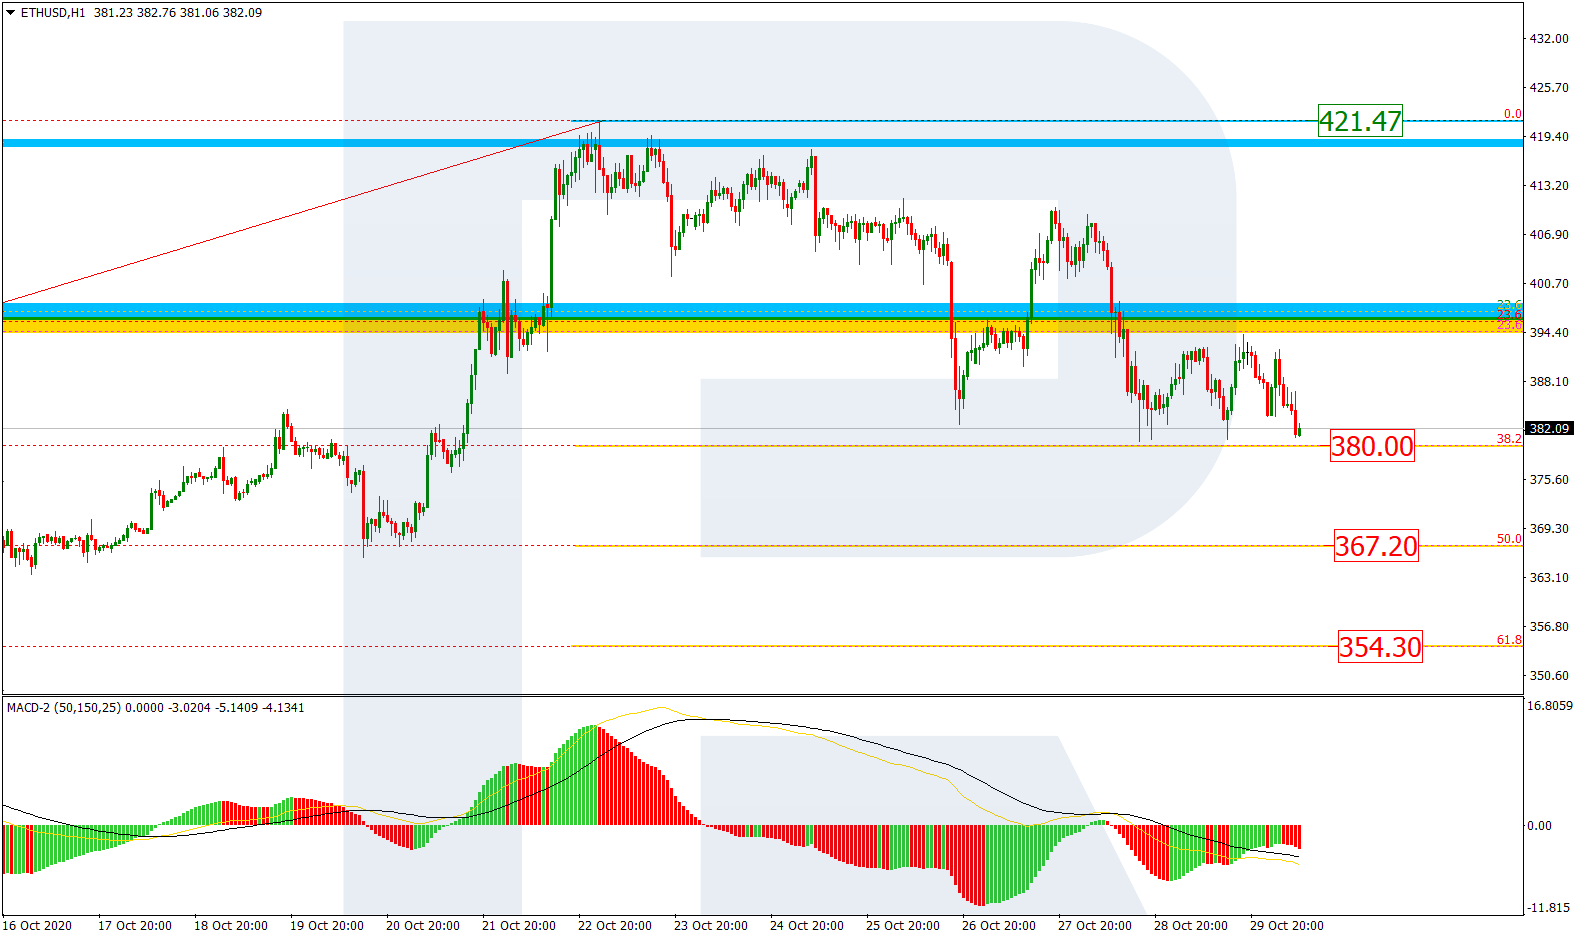
In the H1 chart, the descending correction is approaching 38.2% fibo at 380.00. The next downside targets are 50.0% and 61.8% fibo at 367.20 and 354.30 respectively. The local resistance is the high at 421.47.

ETHUSD_H1

Article By RoboForex.com

Attention!
Forecasts presented in this section only reflect the author’s private opinion and should not be considered as guidance for trading. RoboForex LP bears no responsibility for trading results based on trading recommendations described in these analytical reviews.

The Analytical Overview of the Main Currency Pairs on 2020.10.30

by JustForex

The EUR/USD currency pair

Technical indicators of the currency pair:
  • Prev Open: 1.17467
  • Open: 1.16717
  • % chg. over the last day: -0.60
  • Day’s range: 1.16649 – 1.16945
  • 52 wk range: 1.0637 – 1.2012

The greenback has continued its growth against the basket of world currencies. EUR/USD quotes have updated local lows. The US currency was supported by an optimistic report on US GDP. The ECB, as expected, kept interest rates at the same level. At the same time, the regulator signaled the introduction of additional financial incentives by the end of the year to combat the impact of COVID-19. At the moment, the EUR/USD currency pair is consolidating in the range of 1.1650-1.1695. We expect economic releases from Germany, the Eurozone and the US. Positions should be opened from key levels.

The news feed on 2020.10.30:
  • – Data on the GDP of Germany at 11:00 (GMT+2:00);
  • – Eurozone consumer price index at 12:00 (GMT+2:00);
  • – Eurozone GDP report at 12:00 (GMT+2:00);
  • – Personal spending in the US at 14:30 (GMT+2:00).
EUR/USD

Indicators signal the power of sellers: the price has fixed below 50 MA and 100 MA.

The MACD histogram is in the negative zone, which indicates the bearish sentiment.

Stochastic Oscillator is in the neutral zone, the %K line is below the %D line, which also gives a signal to sell EUR/USD.

Trading recommendations
  • Support levels: 1.1650, 1.1600
  • Resistance levels: 1.1695, 1.1725, 1.1760

If the price fixes below 1.1650, a further fall in EUR/USD quotes is expected. The movement is tending to the round level of 1.1600.

An alternative could be the growth of the EUR/USD currency pair to 1.1725-1.1760.

The GBP/USD currency pair

Technical indicators of the currency pair:
  • Prev Open: 1.29848
  • Open: 1.29236
  • % chg. over the last day: -0.42
  • Day’s range: 1.28987 – 1.29392
  • 52 wk range: 1.1409 – 1.3516

Sales prevail on the GBP/USD currency pair. The British pound has updated its local lows again. At the moment, GBP/USD quotes are consolidating. The trading instrument is testing the following support and resistance levels: 1.2885 and 1.2960, respectively. A further decline in the GBP/USD currency pair is possible. Positions should be opened from key levels.

The news feed on the UK economy is calm.

GBP/USD

Indicators signal the power of sellers: the price has fixed below 50 MA and 100 MA.

The MACD histogram is in the negative zone, which indicates the bearish sentiment.

Stochastic Oscillator is located near the oversold zone, the %K line has crossed the %D line. There are no signals at the moment.

Trading recommendations
  • Support levels: 1.2885, 1.2850, 1.2800
  • Resistance levels: 1.2960, 1.2995, 1.3025

If the price fixes below 1.2885, a further fall in GBP/USD quotes is expected. The movement is tending to 1.2850-1.2830.

An alternative could be the growth of GBP/USD quotes to 1.3000-1.3020.

The USD/CAD currency pair

Technical indicators of the currency pair:
  • Prev Open: 1.33185
  • Open: 1.33226
  • % chg. over the last day: +0.03
  • Day’s range: 1.32941 – 1.33458
  • 52 wk range: 1.2949 – 1.4669

USD/CAD quotes have become stable after a prolonged rally. At the moment, the loonie is consolidating in the range of 1.3280-1.3345. Traders expect additional drivers. In the near future, a technical correction of the trading instrument is possible. Today, Canada’s GDP report will be the key event. We recommend paying attention to the dynamics of “black gold” prices. Positions should be opened from key levels.

At 14:30 (GMT+2:00), Canada’s GDP data will be published.

USD/CAD

Indicators signal the power of buyers: the price has fixed above 50 MA and 100 MA.

The MACD histogram is in the positive zone, which gives a signal to buy USD/CAD.

Stochastic Oscillator is located near the overbought zone, the %K line has crossed the %D line. There are no signals at the moment.

Trading recommendations
  • Support levels: 1.3280, 1.3250, 1.3220
  • Resistance levels: 1.3345, 1.3390

If the price fixes above 1.3345, further growth in USD/CAD quotes is expected. The movement is tending to 1.3390-1.3420.

An alternative could be a decline in the USD/CAD currency pair to 1.3250-1.3220.

The USD/JPY currency pair

Technical indicators of the currency pair:
  • Prev Open: 104.322
  • Open: 104.605
  • % chg. over the last day: +0.31
  • Day’s range: 104.124 – 104.628
  • 52 wk range: 101.19 – 112.41

There is an ambiguous technical pattern on the USD/JPY currency pair. The trading instrument is in a sideways trend. At the moment, the following key support and resistance levels can be distinguished: 104.05 and 104.45, respectively. The demand for safe assets is still high. We do not exclude a further decline in USD/JPY quotes. We recommend paying attention to the dynamics of US government bonds yield. Positions should be opened from key levels.

Japan published optimistic industrial production data for September.

USD/JPY

Indicators do not give accurate signals: the price has crossed the 50 MA.

The MACD histogram has started declining, which indicated the bearish sentiment.

Stochastic Oscillator is in the neutral zone, the %K line is above the %D line, which gives a signal to buy USD/JPY.

Trading recommendations
  • Support levels: 104.05, 103.70, 103.50
  • Resistance levels: 104.45, 104.70, 104.90

If the price fixes below 104.05, a further drop in USD/JPY quotes is expected. The movement is tending to 103.70-103.50.

An alternative could be the growth of the USD/JPY currency pair to 104.70-104.90.

by JustForex


This article reflects a personal opinion and should not be interpreted as an investment advice, and/or offer, and/or a persistent request for carrying out financial transactions, and/or a guarantee, and/or a forecast of future events.

Ethereum Has Soared in 2020; Is It Overpriced?

The price of Ethereum has more than doubled since the beginning of the year and shows few signs of slowing. Are we witnessing a bubble or genuinely sustainable growth?

(Image via Pexels)

The crypto market has seen an investment boom this year. That’s especially true of Ethereum, which is sitting at or around $400, a significant increase from its humble beginnings of $130 at the beginning of the year.

According to the analytics firm TokenInsights, trading volume for cryptocurrency derivatives nearly doubled in the second half of 2019, and 2020 was expected to show similar trends. That projection was made before COVID-19 hit and millions of new retail accounts were registered on popular consumer platforms like eToro and Robinhood.

It owes this boom in part to the evolution of the Decentralized Finance (DeFi) sector and the wider crypto market picking up again. ETH “hodlers” will cite this as proof that the currency is set for the moon but there are still many questions surrounding its price sustainability.

Ethereum’s Price Is Driven by DeFi and ETH 2.0 Hype

Setting aside the impact of Bitcoin’s price, there are two primary drivers of ETH’s price: The DeFi sector and the Ethereum 2.0 update, with the former driving hype about the latter.

DeFi is one of the most interesting advances in the crypto sector over the past few years. DeFi apps seek to replicate decentralized versions of many of the financial instruments necessary to a modern economy.

There are many kinds of DeFi apps but by far the most impactful in 2020 were decentralized lending platforms and decentralized exchanges.

Exchanges

Decentralized exchanges like UniSwap are popular because they provide an easy way to exchange tokens without being forced to go through centralized exchanges with high fees, such as Coinbase.

As important as UniSwap is, however, the real driver of growth has been lending platforms.

Lending Platforms

There is currently around $11 billion locked into lending platforms. This rapid growth has been driven by the controversial practice of rate farming.

Lending platforms need both lenders and borrowers. In order to ensure that there is liquidity on the platforms, many offer artificially inflated interest rates. This encourages lenders to lock value into the platform and has helped to fuel the rapid growth of DeFi lending.

DeFi-Strain Highlights the Importance of Ethereum 2.0

The reason that DeFi is such an important price driver for Ethereum is that the majority are built on Ethereum’s ERC20 standard. This means that they rely upon the Ethereum blockchain in order to process transactions. This is good because it increases demand for ETH and gas. But it also increases the load on the network.

During the DeFi boom, the number of transactions on the Ethereum network skyrocketed. As a result, miners made more than $168.7 million in September, a 39% increase over the previous month.

These high fees, and slower transactions, highlighted a key problem with Ethereum. Proof of Work (PoW) consensus is not scalable. Miners require high fees, and if high network usage makes transactions slow or expensive,there will be a ceiling on adoption.

Beacon Chain and Casper

The planned Ethereum 2.0 update is designed to fix this. The first and most important step is the roll-out of a new blockchain network, the beacon chain. This will build the foundation that Ethereum needs to move away from a PoW system to a Proof of Stake (PoS) blockchain called Casper.

This new system will remove the need for miners and enable users to earn rewards for securing the network by locking 32 ETH into a smart contract. An equal amount of ETH will be created on the new blockchain and kept there until the new and old systems are merged.

This means that once the switch happens it will be possible for users to monetize Ethereum without liquidating the currency. This in turn will increase demand for Ethereum as a return-generating asset.

Additionally, as miners are cut out from the system it will remove the scalability problems currently faced by Ethereum and ensure that the DeFi boom benefits the blockchain in the long term, rather than breaking it.

Ethereum Has Strong Fundamentals

The fate of Ethereum is inexorably tied to that of the DeFi sector. This means that the current price might be slightly inflated based on current fundamentals, but is justifiable based on Ethereum’s long term fundamentals.

If Ethereum is able to successfully roll out the 2.0 update then it will likely retain the bulk of new DeFi projects. In the long term, this means that Ethereum is likely set to continue growing.

By Taylor Wilman

White-Knuckle Ride Ain’t Over Yet

By Han Tan, Market Analyst, ForexTime

Asian stocks are a sea of red while US equity futures are extending their declines for the week, as markets continue taking stock of the potent mix of major downside risks, from Covid-19’s resurgence in major economies to the looming US political uncertainty.

While Americans have been casting their votes early in droves, with an estimated 81 million votes already cast either in-person or via mail-in ballots, equity investors appear to have opted to leave it late – a mere week before polling day. Without the veneer of an imminent fiscal stimulus package for the US economy, riskier assets finally had to face up to the threat of a double-dip global recession and a contested US election outcome.

For the past six weeks, the VIX had been content staying close to its pandemic-era average of 30. Now, any remaining sense of complacency is being wrung out of investors by the market’s wild moves this week, with the VIX spiking above the psychologically-important 40 mark, before moderating amid Thursday’s rebound. Still, with US futures pointing to further losses at the Friday open, the VIX could end the week above this level if today’s session mirrors the volatility from earlier this week.

The S&P 500 is about to post its second consecutive weekly decline, and is just 30 basis points away from matching the 4.78 percent drop registered for the trading week ending June 12th. With this benchmark US equity index set to break below its 100-day simple moving average, such a technical episode could herald further declines in the sessions leading up to the November 3rd vote, and even after. And with its 14-day relative strength index yet to reach the 30 mark, which typically denotes oversold levels, it suggests there could be more downside to be explored.

Given the very real chance of a delayed outcome to the 2020 US presidential elections, investors may opt to continue paring down their exposures to risk until there’s more clarity as to who will occupy the White House for the next four years. Over the coming days, developments pertaining to US voting trends could have an outsized influence over broader market sentiment. Should risk aversion rule the roost, King Dollar could then solidify its claim to its throne, having regained its status as the preferred safe haven asset.

Even tech stocks, which had assumed the safe-haven mantle amid the Covid-19 storm, have been found wanting of late. Big Tech now isn’t immune to this latest rout, judging by Thursday’s after-market moves, despite releasing some better than expected quarterly earnings. Without thesejuggernauts, which have been a stalwart in driving US benchmark indices’ tremendous gains since the pandemic broke out, equity bulls have little else to go on over the immediate future.

With market participants becoming increasingly harder to satisfy, traditional safe havens might be tempted to make hay over the immediate term, until the market narrative shifts positively away from the pandemic and the US elections. Perhaps headlines pertaining to fresh waves of fiscal and monetary stimulus across Europe and the US could do the trick.

In the meantime, strap in tight. This roller coaster ride isn’t quite over yet.

Disclaimer: The content in this article comprises personal opinions and should not be construed as containing personal and/or other investment advice and/or an offer of and/or solicitation for any transactions in financial instruments and/or a guarantee and/or prediction of future performance. ForexTime (FXTM), its affiliates, agents, directors, officers or employees do not guarantee the accuracy, validity, timeliness or completeness, of any information or data made available and assume no liability as to any loss arising from any investment based on the same.


Forex-Time-LogoArticle by ForexTime

ForexTime Ltd (FXTM) is an award winning international online forex broker regulated by CySEC 185/12 www.forextime.com