Biogen, AMP, Nokia & Twitter lead the Weekly Top Gainers/Losers

By IFCMarkets.com

Top Gainers – The World Market

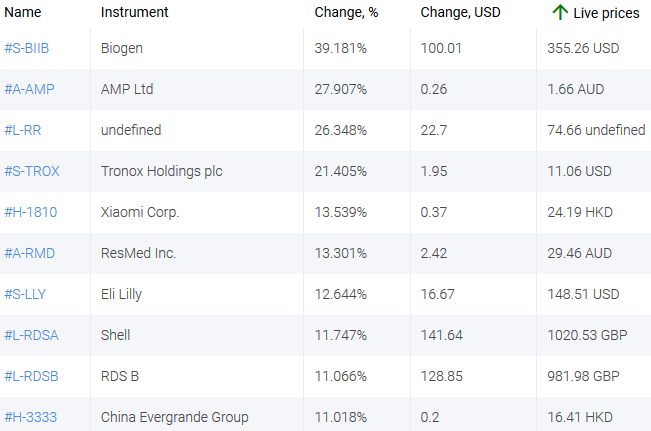
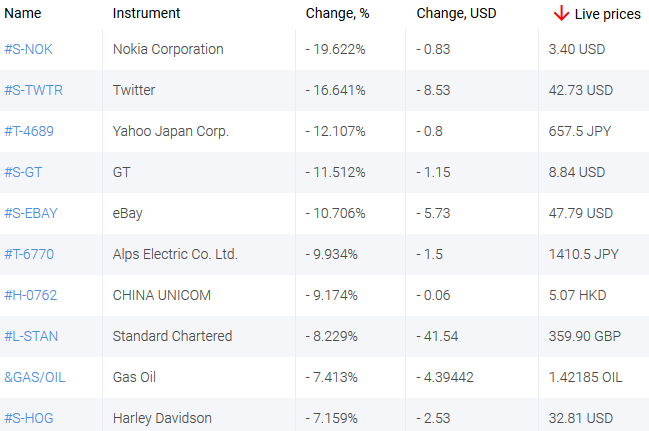
Stocks of biopharmaceutical companies, including Biogen, went up amid an increase in the number of new coronavirus cases in the world. Twitter shares fell in price due to low growth in the number of new users. Worldwide quarantine has intensified the competition among social networks. The Russian ruble weakened amid falling world oil prices.

1.Biogen Inc ., 39,2% – an American biopharmaceutical company.

2. AMP Ltd, 27,9% – an Australian financial company.

market sentiment ratio long short positions

 Top Losers – The World Market

1. Nokia Corporation – a Finnish telecommunications company.

2. Twitter Inc. – an American social network.

market sentiment ratio long short positions

 Top Gainers – Foreign Exchange Market (Forex)

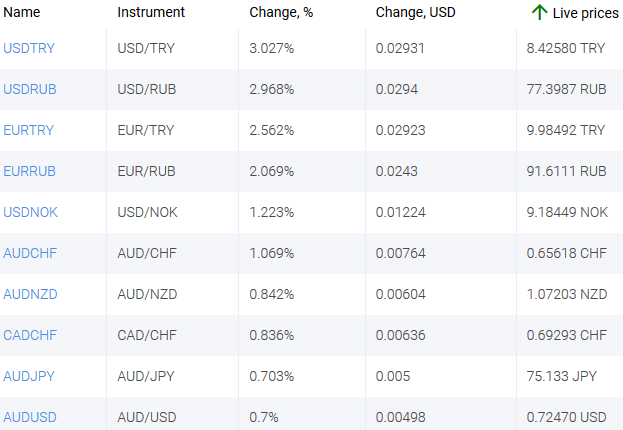
1. USDTRY, EURTRY – the growth of these charts means the strengthening of the US dollar and the euro against the Turkish lira.

2. EURRUB, USDRUB – the growth of these charts means the weakening of the Russian ruble against the euro and the US dollar.

market sentiment ratio long short positions

 Top Losers – Foreign Exchange Market (Forex)

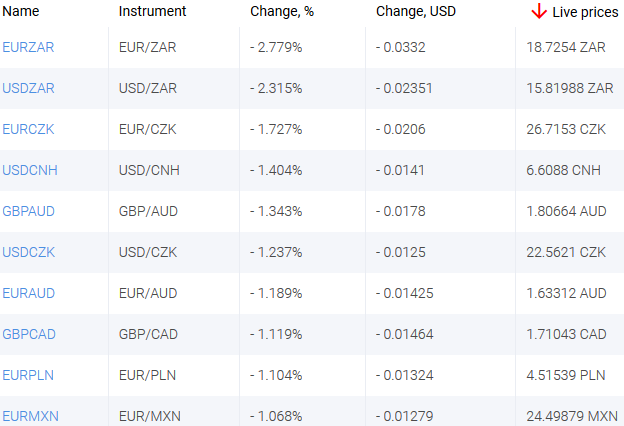
1. USDZAR, EURZAR – the drop of these charts means the weakening of the US dollar and euro against the South African rand.

2. EURCZK, USDCNH – the drop of these charts means the weakening of the euro against the Czech koruna, and the US dollar against the Chinese yuan.

market sentiment ratio long short positions
Market Analysis provided by IFCMarkets.com

Ichimoku Cloud Analysis 06.11.2020 (USDJPY, LTCUSD, BRENT)

Article By RoboForex.com

USDJPY, “US Dollar vs Japanese Yen”

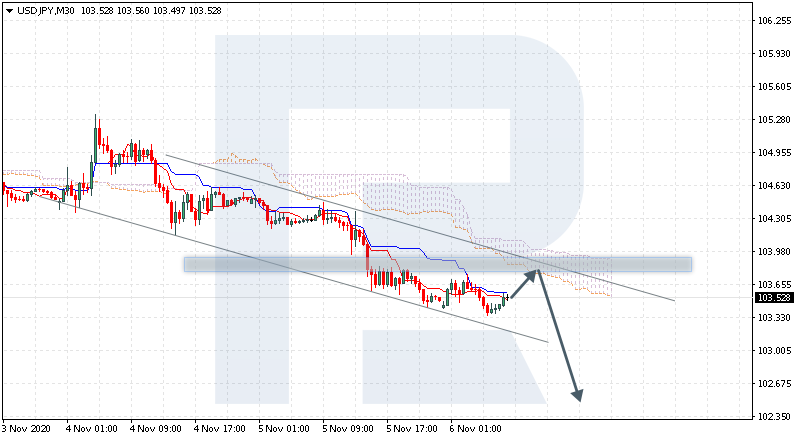
USDJPY is trading at 103.52; the instrument is moving below Ichimoku Cloud, thus indicating a descending tendency. The markets could indicate that the price may test the cloud’s downside border at 103.70 and then resume moving downwards to reach 102.55. Another signal in favor of further downtrend will be a rebound from the descending channel’s upside border. However, the bearish scenario may no longer be valid if the price breaks the cloud’s upside border and fixes above 104.25. In this case, the pair may continue growing towards 105.20.

USDJPY
Risk Warning: the result of previous trading operations do not guarantee the same results in the future

LTCUSD, “Litecoin vs US Dollar”

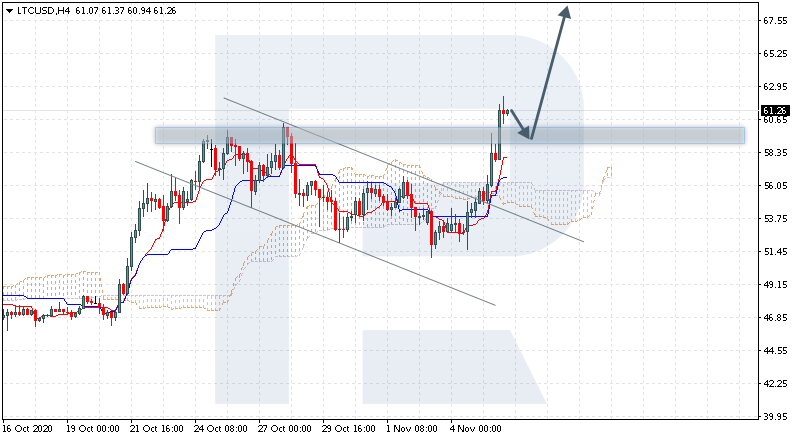
LTCUSD is trading at 61.65; the instrument is moving above Ichimoku Cloud, thus indicating an ascending tendency. The markets could indicate that the price may test Tenkan-Sen and Kijun-Sen at 59.25 and then resume moving upwards to reach 68.05. Another signal in favor of further uptrend will be a rebound from the support level. However, the bullish scenario may no longer be valid if the price breaks the cloud’s downside border and fixes below 51.55. In this case, the pair may continue falling towards 50.25.

LTCUSD
Risk Warning: the result of previous trading operations do not guarantee the same results in the future

BRENT

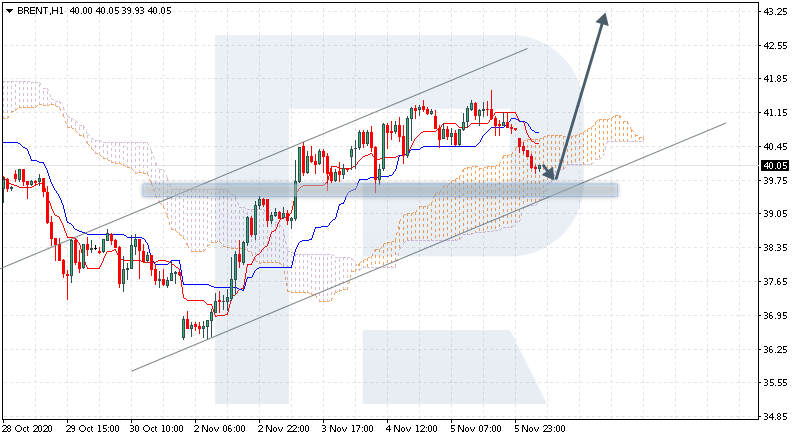
Brent is trading at 40.05; the instrument is moving inside Ichimoku Cloud, thus indicating a sideways tendency. The markets could indicate that the price may test the cloud’s downside border at 39.60 and then resume moving upwards to reach 43.25. Another signal in favor of further uptrend will be a rebound from the rising channel’s downside border. However, the bullish scenario may no longer be valid if the price breaks the cloud’s downside border and fixes below 38.95. In this case, the pair may continue falling towards 36.55. To confirm further growth, the asset must break the cloud’s upside border and fix above 41.35.

BRENT

Article By RoboForex.com

Attention!
Forecasts presented in this section only reflect the author’s private opinion and should not be considered as guidance for trading. RoboForex LP bears no responsibility for trading results based on trading recommendations described in these analytical reviews.

Fibonacci Retracements Analysis 06.11.2020 (BITCOIN, ETHEREUM)

Article By RoboForex.com

BTCUSD, “Bitcoin vs US Dollar”

In the daily chart, after updating its two-year high, BTCUSD continues the uptrend and has already tested 16000.00. The next upside targets are inside the post-correctional extension area between 138.2% and 161.8% fibo at 17626.00 and 20022.00 respectively. If the asset decides to start a new pullback, its target will be at 13857.20.

BTCUSD_D1
Risk Warning: the result of previous trading operations do not guarantee the same results in the future

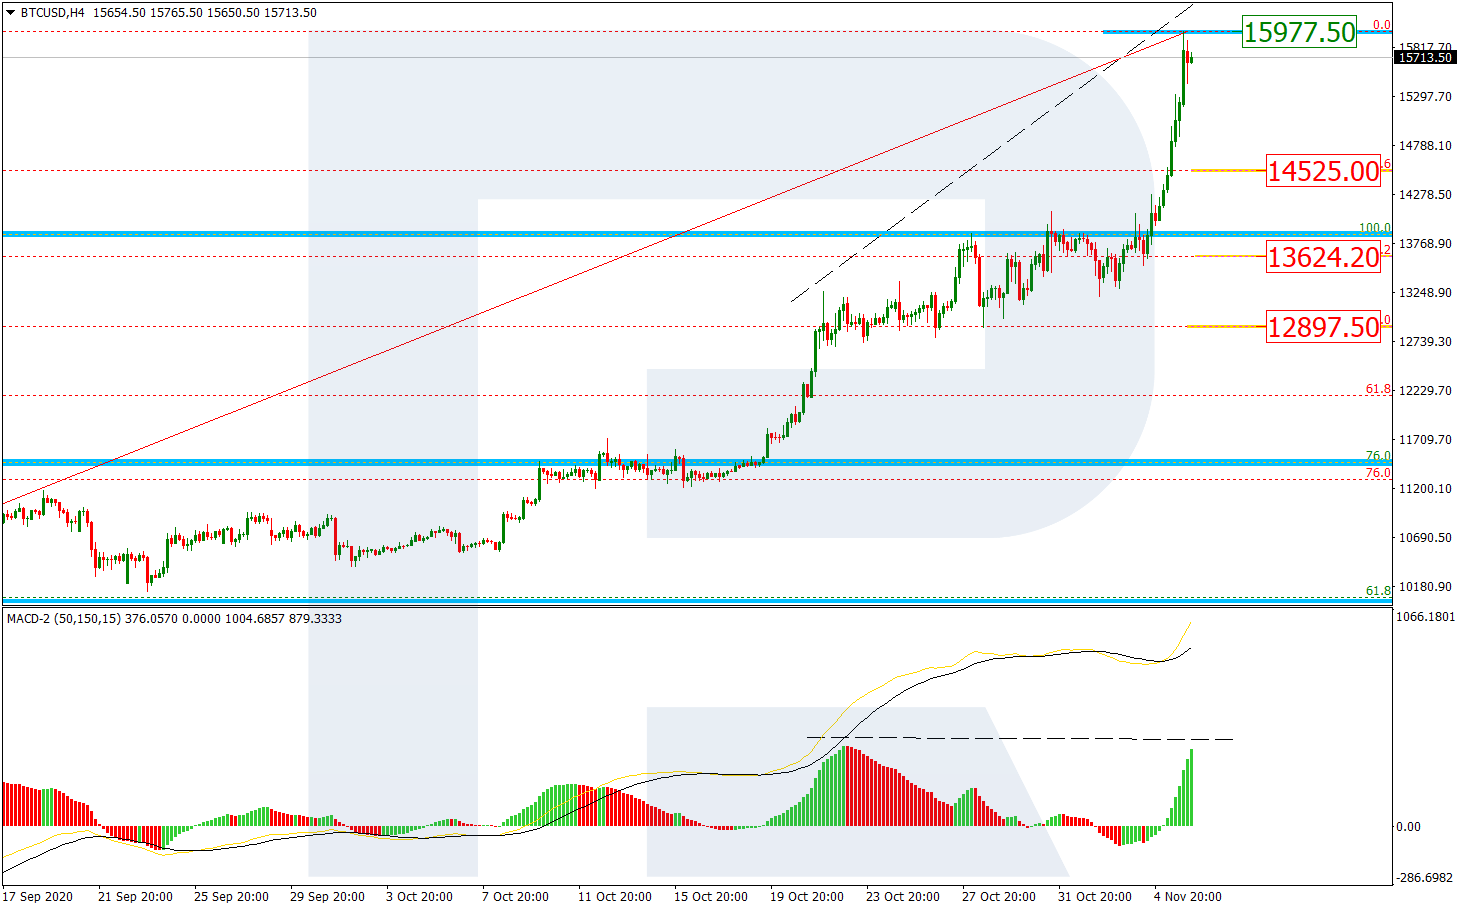
The H1 chart shows a divergence on MACD. In this case, the pair is expected to start a descending correction towards 23.6%, 38.2%, and 50.0% fibo at 14525.00, 13624.20, and 12897.50 respectively. The resistance is the high at 15977.50.

BTCUSD_H4
Risk Warning: the result of previous trading operations do not guarantee the same results in the future

ETHUSD, “Ethereum vs. US Dollar”

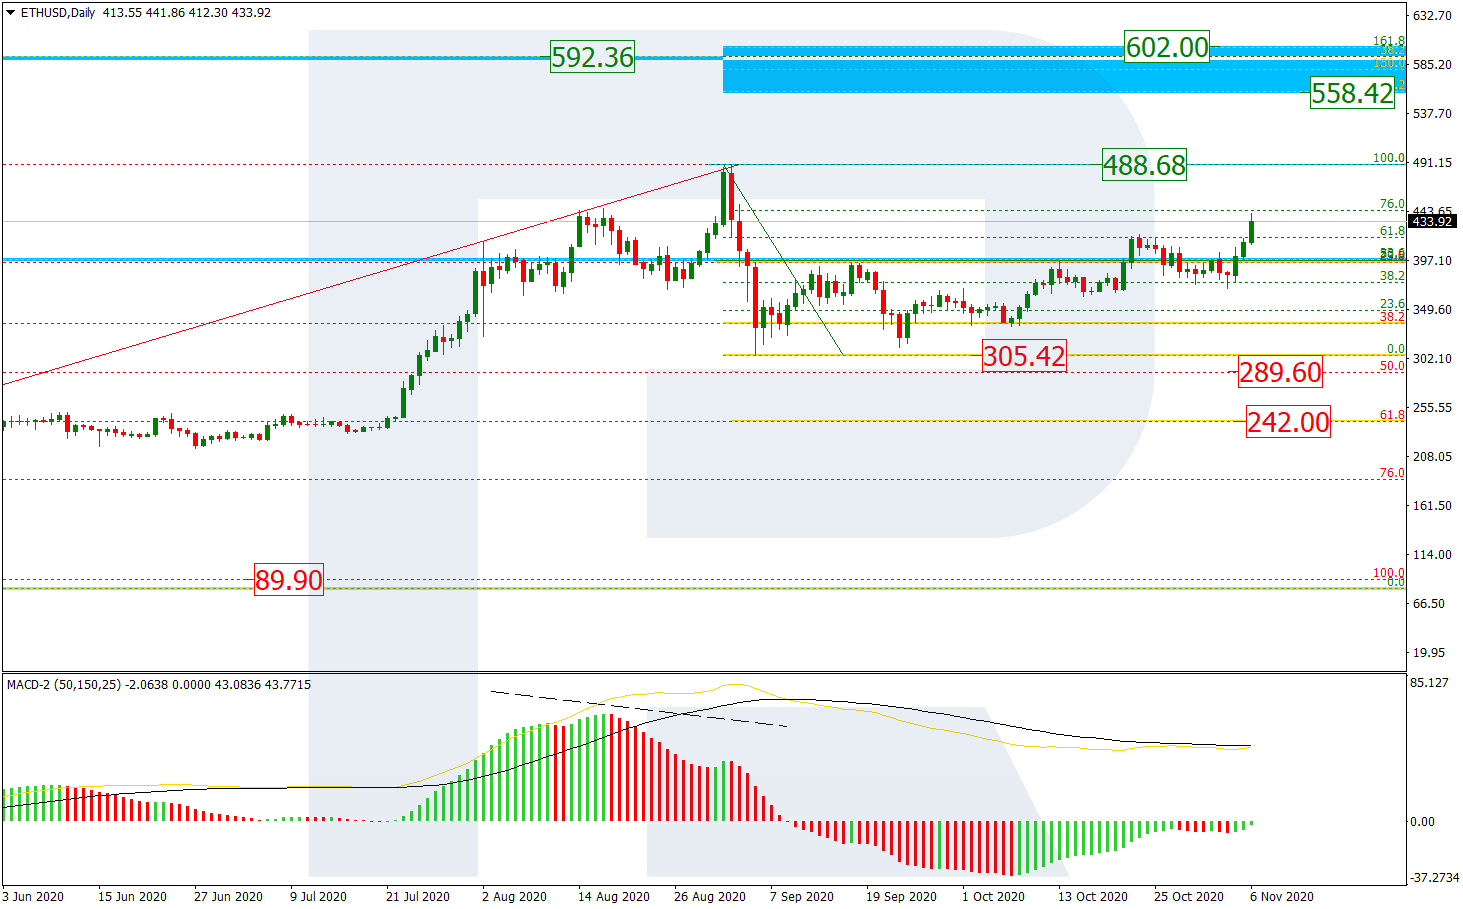
Ethereum clearly wants to keep pace with Bitcoin but as long as the cryptocurrency is trading below the high at 488.68, the correction won’t be over. As we can see in the daily chart, after the first descending correctional wave reached 38.2% fibo, the second one has broken the low at 305.42 and may later reach 50.0% and 61.8% fibo at 289.60 and 242.00 respectively. However, if the asset breaks the high after all, the instrument may continue growing to reach the long-term 38.2% fibo at 592.36, as well as the post-correctional extension area between 138.2% and 161.8% fibo at 558.42 and 602.00 respectively.

ETHUSD_D1
Risk Warning: the result of previous trading operations do not guarantee the same results in the future

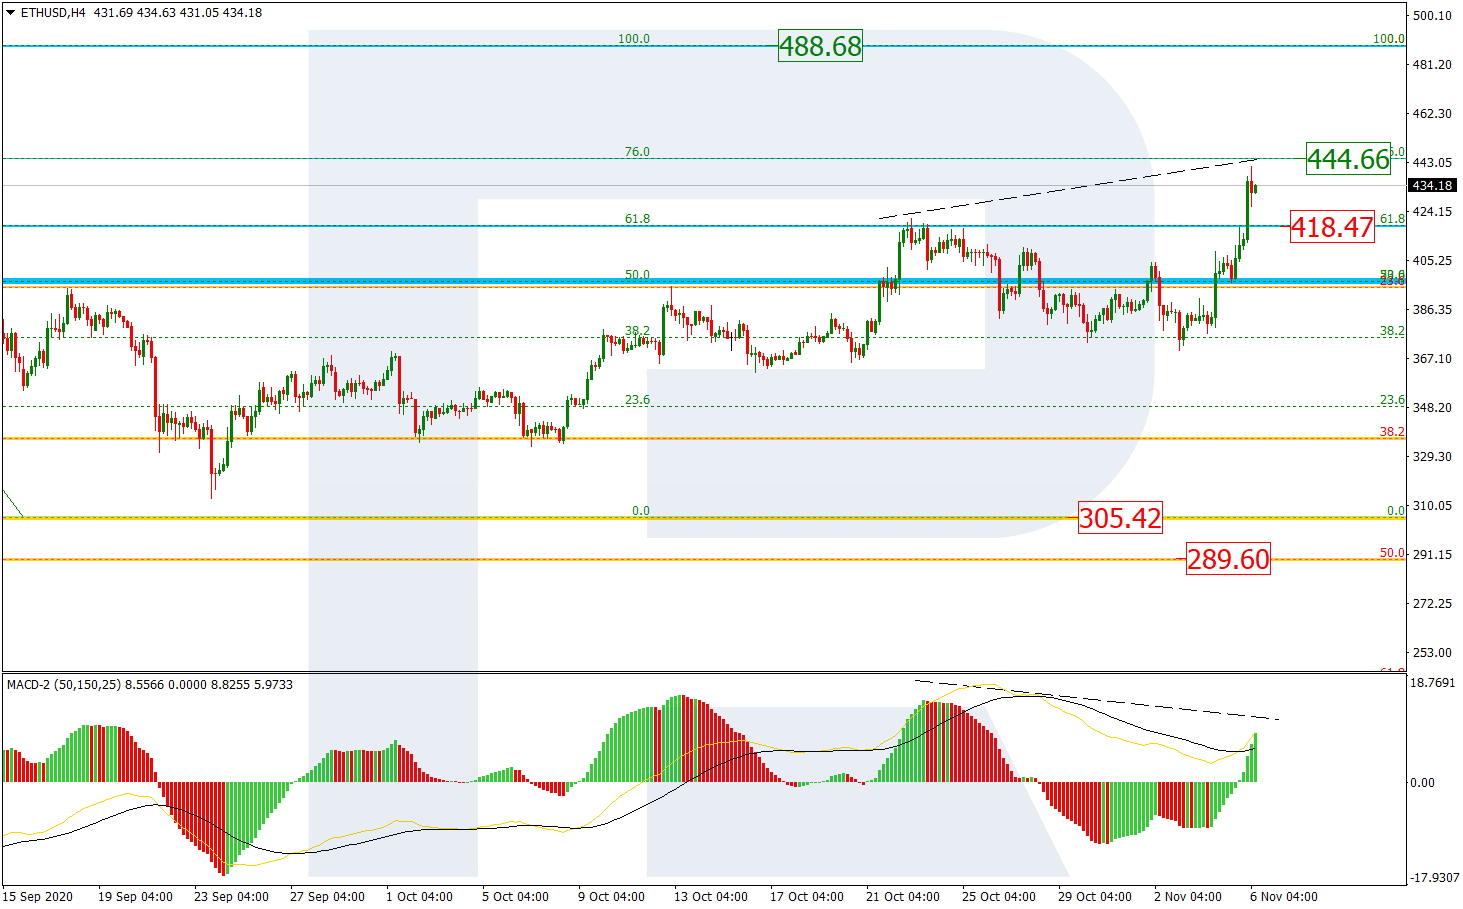
In the H1 chart, the ascending correction is approaching 76.0% fibo at 444.66. Taking into account a divergence on MACD, in the nearest future, the asset may start a new decline towards 61.8% fibo at 418.47, which was broken earlier.

ETHUSD_H4

Article By RoboForex.com

Attention!
Forecasts presented in this section only reflect the author’s private opinion and should not be considered as guidance for trading. RoboForex LP bears no responsibility for trading results based on trading recommendations described in these analytical reviews.

Metals Jump On US Election Dynamics

By Orbex

Gold Surges to 5-Week High

Gold rose this week after seeing its biggest gain in 5 weeks. The price of the precious metal reached a high of $1953 for the week ending November 6.

However, the price action appeared to be a reflection of the current election count dynamics.

For one, a Biden win and a divided Congress will certainly keep investors on their toes. Democrats will not be able to pass legislation through Congress without facing Republicans’ resistance. (A Trump win, on the other hand, might trigger a sell-off as market participants could turn to USD for safety).

Secondly, growing prospects to halt vote counts are making investors nervous. Trump said he will bring lawsuits in Pennsylvania, Michigan, and Georgia and will request recounts in other states.

Despite gold currently trading mainly based on hopes of a Democratic challenger win, prices could see an acceleration if the US Supreme Court decides to get involved. So far, the Supreme Court has rejected any legal challenges, but with Trump campaigns on the matter continuing civil unrest concerns grow, especially in battleground states. Plunging the country into chaos will affect the prices of gold positively.

Finally, the Fed kept its interest rates unchanged and maintained its current buying program. Gold didn’t see much change to the Chair’s comments, however, with Powell reiterating the need for fiscal support, who wins the elections will play a significant role in how the Committee will make monetary policy decisions going forward.

All the while, coronavirus lockdowns continue to take place globally with many European countries extending restrictions and measures. Despite not having much of an impact now on gold, it’s another factor to keep in mind after the US election finishes.

On a different note, the deadly terror attacks in France, Germany, and most recently Austria on November 2, heighten fears of follow-up attacks. A flight to safety can be very well expected.

With gold having had an incredible rally this week, favorable sentiment could prevail into next week. However, note there is still an absence of a clear market as volatility levels remain highly elevated.

Gold Remains Tilted to The Upside
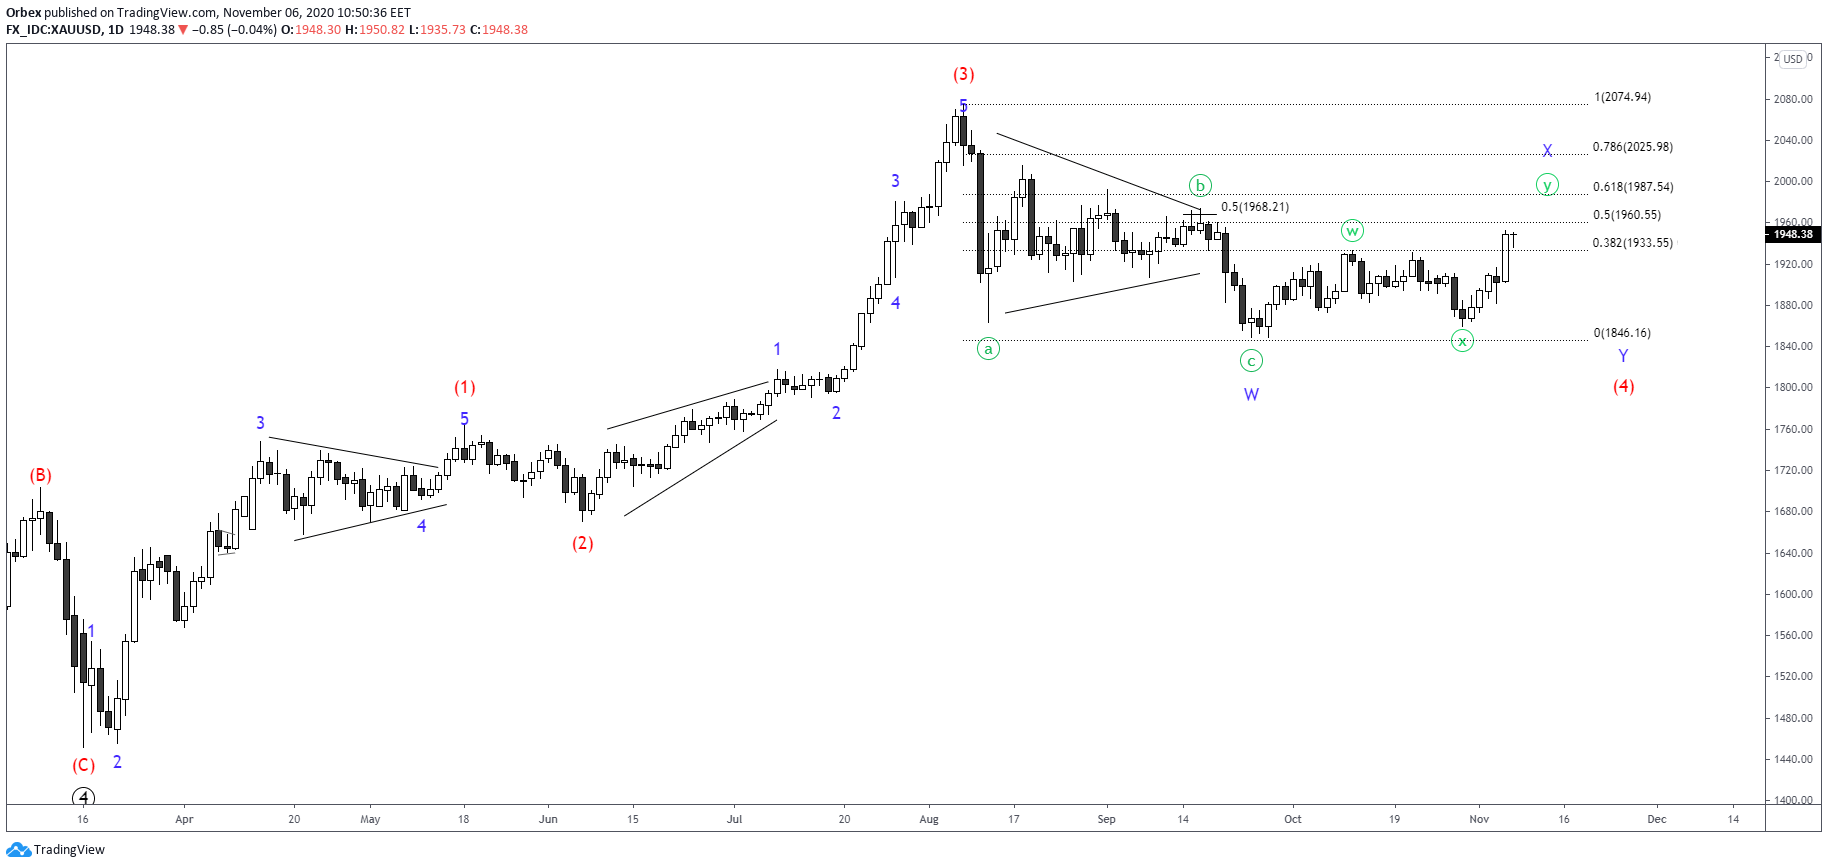
Despite the current dynamics favoring more upside in the price of gold, bulls need to break to new highs.

The first two hurdles await by the 50% FR at $1960 and by the 62% FR at $1987.

If the correction in (4) turns out incomplete, a rejection at $2K could send prices lower for a fresh multiweek low below 1846. If prices break above the $2K handle, the likelihood of reaching $2025 first will increase. There, price action will determine whether the rally from $1846 is indeed an impulse or not.

Silver Needs $30 Takeover to Validate Impulse
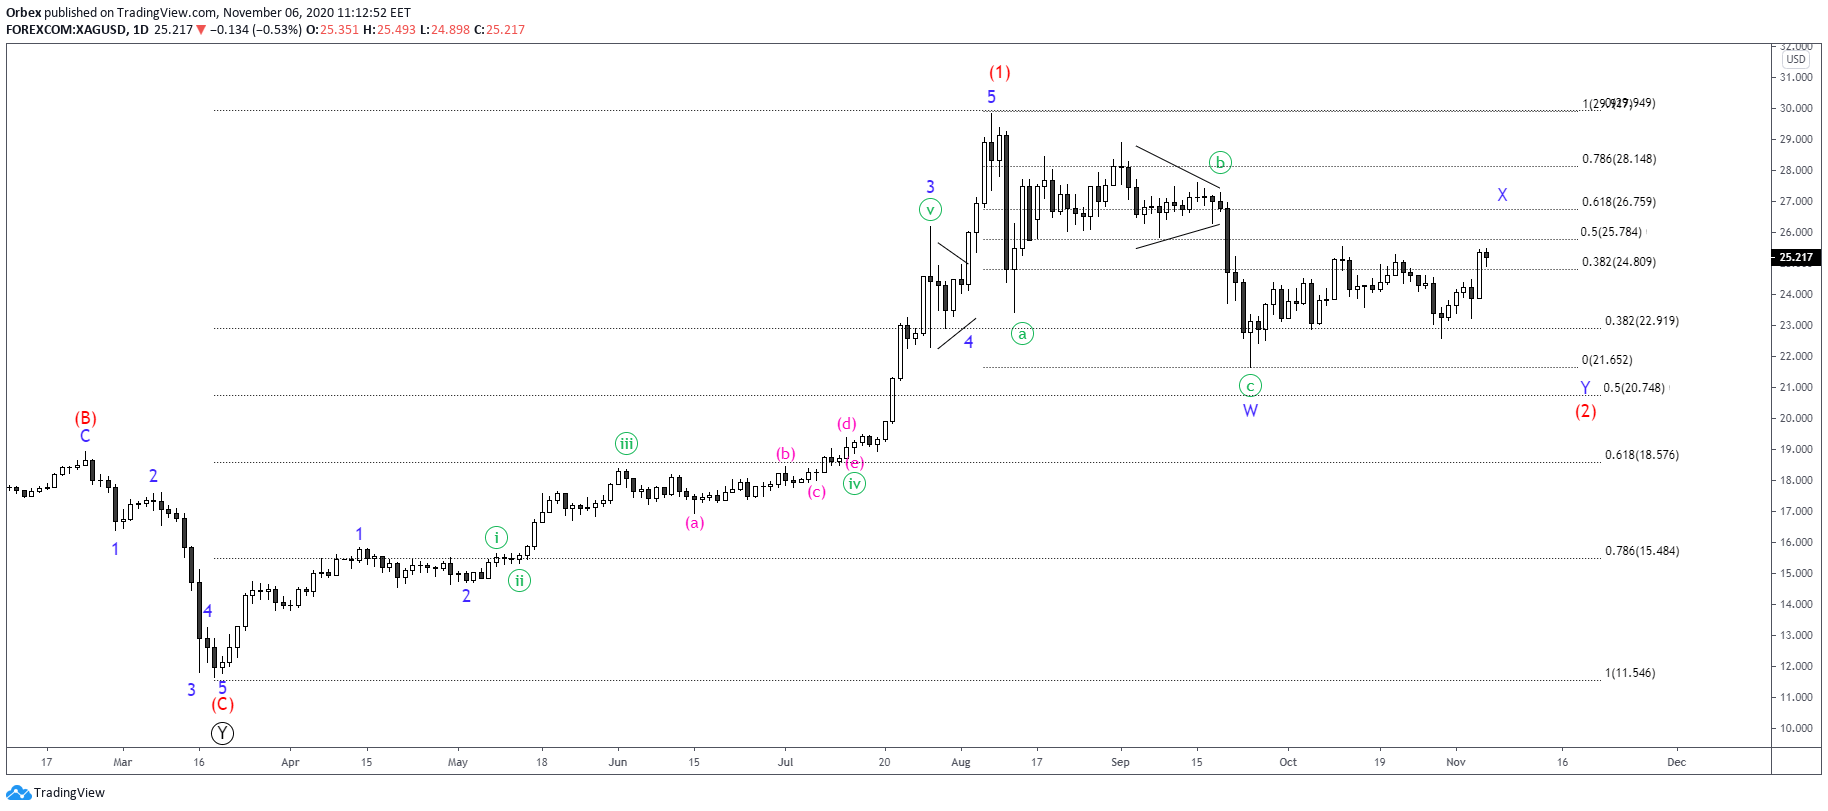
The price of silver in the current market reached a 4-week high of $25.50 only, lagging the momentum of gold.

Structural dynamics between the two commodities remain identical. However, XAGUSD is expected to complete a double zigzag in wave (2), not in wave (4). This gives leeway to medium-to-long term traders as the upside potential is of multiple degrees.

Without a break of the 50% FR at $25.76, chances of short-to-medium term correction in (2) will increase. A break of the said resistance will have to lead to a subsequent break of the 62% FR at $26.76. Otherwise, bears will remain in the battleground game.

Only when prices break above the high momentum candle mark of 29.15 chances of a simple correction in wave (2) will increase dramatically. But only a break move above the high of the $30 handle will validate the bullish impulse.

By Orbex

Biden Leading, Trump Suing

By Orbex

The Fed Holds

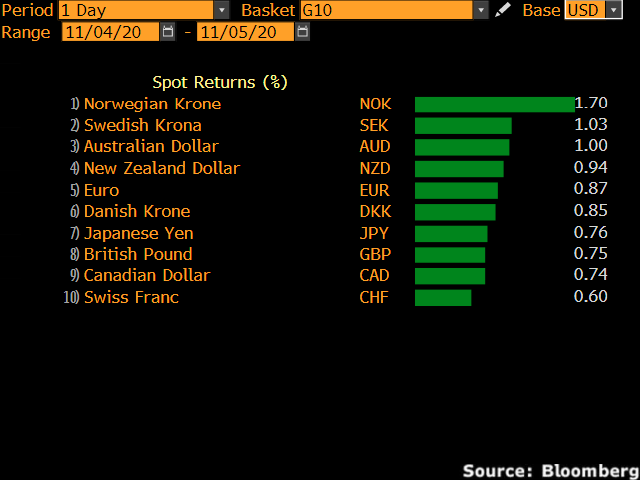
The US index fell 0.87% on Thursday, dropping to 2-months lows as the Presidential race rages on.

Joe Biden‘s lead seems to be advancing as more and more votes are confirmed. However, Donald Trump is not taking this lying down, as he made unsubstantiated claims of vote-rigging.

As markets widely expected, the Fed kept its benchmark interest rate unchanged last night. Powell stated that economic activity and employment have continued to recover but remain well below their levels at the beginning of the year.

In addition to the downturn of the greenback, initial jobless numbers barely moved from the previous week. This indicates a long road ahead for the US economy.

EURUSD Surges Past 1.18

The euro moved to a weekly high as it closed 0.85% up yesterday.

A shift in risk appetite on the US dollar was a contributing factor for the currency pair, as the eurozone looks ahead to a bleak winter.

With the increasing risk of a double-dip recession heading for the fourth quarter, there will be increased pressure on the EU for further stimulus. This is needed to revive the European recovery from the impact of the second wave.

Sterling Buoyed by BoE Announcement

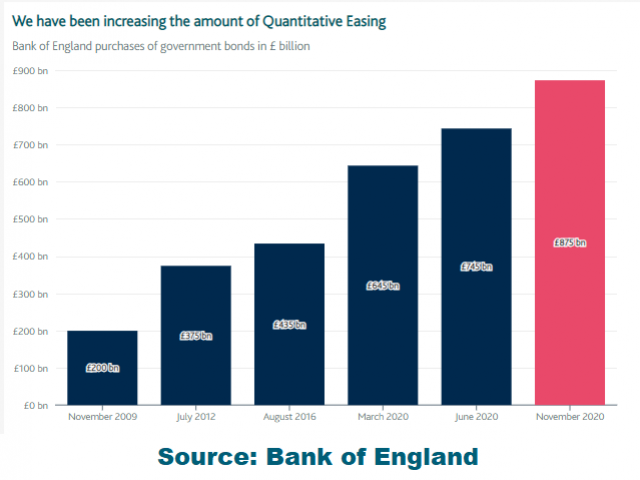
The pound rose by over 1% on Thursday as the Bank of England unleashed a further £150bn of support for the UK economy.

Governor Andrew Bailey has vowed to do everything they can to support the economy amid a resurgence of Covid-19 cases.

While the economy is expected to avoid another recession, the Bank believes unemployment will rise sharply as rates were held at 0.1%.

Chancellor Sunak also pledged to keep the Government’s furlough scheme going until next March.

Indices Continue the Rally

The three main indices all rose by almost 2% on Thursday despite no closure to the presidential contest.

The rally reflected enthusiasm at the apparent outcome of the election. This could leave Washington politically divided and pose a barrier to sweeping policy changes that could upset investors, such as tax increases.

Today marks the final day in which mail postal ballots can still be counted if they were postmarked and mailed by the 3rd of November.

Gold Jumps to $1950

Gold ended a day to remember yesterday as it closed 2.43% higher.

The yellow metal capped a fresh seven-week high after the Federal Reserve released its monetary policy decision. Gold rallied on Thursday amid a strong risk appetite, with equity markets surging and the USD on the back foot.

NFP figures released later today will give further indications as to whether traders will turn their back on the dollar and remain bullish towards gold.

WTI Loses $39 Handle

Oil fell lower by 1.43% yesterday after a relatively strong recovery during the week.

Continued concerns regarding future demand for the commodity seem to halt the ascension to the $40 handle.

All eyes will focus on the outcome of the Presidential race as a Biden win may push prices lower.

By Orbex

Market rally to pause on election fatigue?

By Lukman Otunuga, Research Analyst, ForexTime

It has been a momentous week defined by anticipation, tension and drama around the US presidential election.

The outcome of this historic election remains on a knife-edge, with Donald Trump and Democrat challenger Joe Biden going toe to toe in key swing states. Investors across the globe are likely to adopt a guarded approach amid the cliffhanger vote count with full unofficial results from key swing states – Pennsylvania and Georgia – expected later today. Although Biden may clinch the presidency with just one more state, the race for the White House remains too close to call. Even if this becomes reality, concerns are elevated over Trump contesting the results of certain states, ultimately opening the door to more uncertainty. Given how officials have already warned that it may take days or even weeks for the final results amid the huge number of postal ballots, markets could be in for a rocky ride for the rest of 2020.

Asian shares were mixed this morning as investors awaited more clarity from the presidential election, while gains in Europe may be capped if market players turn defensive ahead of the US jobs report this afternoon.

US jobs data in focus

Away from US politics, all eyes will be on the US non-farm payrolls report released later today.

The headline figure is expected to have increased by 600,000 jobs in October after rising 661,000 in September.  This would make it the smallest gain since the jobs recovery started in May and give a clear indication that rising coronavirus infections are negatively impacting the economic recovery. The unemployment rate is expected to have dipped from 7.9% to 7.7% with average hourly earnings forecast to rise to 0.2% from the 0.1% seen in the previous month.

A disappointing jobs report is likely to hit sentiment towards the US economy and the threat of a contested election that reduces the possibility of another coronavirus rescue package in 2020 may rub salt into the wound.

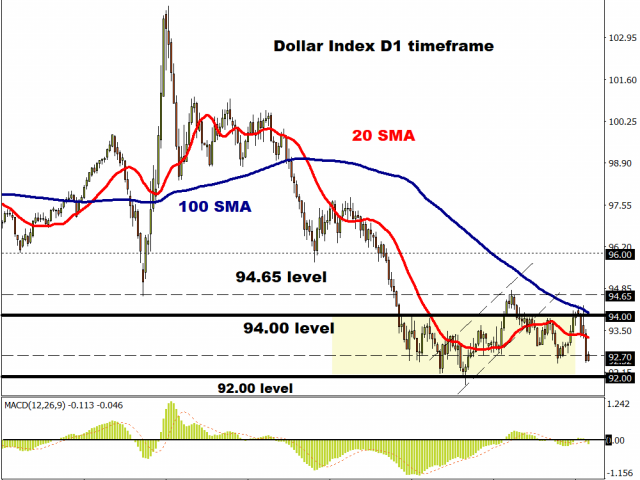
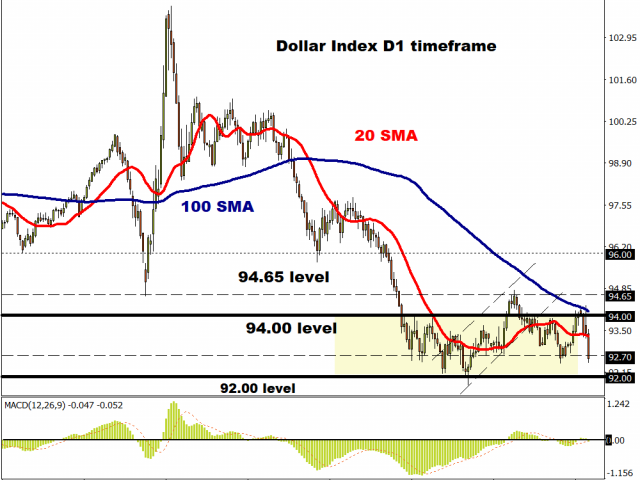
Looking at the technical picture, the Dollar Index remains under pressure on the daily charts. Prices are trading below the 20 and 100-day Simple Moving Average while the MACD trades to the downside. A daily close below 92.70 may open a path towards 92.00 in the short to medium term. But should prices push higher and break above 92.70, the Index may venture back towards 93.30.

Disclaimer: The content in this article comprises personal opinions and should not be construed as containing personal and/or other investment advice and/or an offer of and/or solicitation for any transactions in financial instruments and/or a guarantee and/or prediction of future performance. ForexTime (FXTM), its affiliates, agents, directors, officers or employees do not guarantee the accuracy, validity, timeliness or completeness, of any information or data made available and assume no liability as to any loss arising from any investment based on the same.


Forex-Time-LogoArticle by ForexTime

ForexTime Ltd (FXTM) is an award winning international online forex broker regulated by CySEC 185/12 www.forextime.com

Amid the US Presidential Election job numbers in Focus on Friday – USD weakness ahead?

By Admiral Markets

Economic Events November 06Source: Economic Events November 06, 2020 – Admiral Markets’ Forex Calendar
The head-to-head race between Donald Trump and Joe Biden in the US Presidential Election is still underway.

It remains to be seen if US president Trump would accept a Biden win or if he would move forward with his “threat” from Wednesday morning, saying he will go to the US Supreme Court – a threat which does not come as much of a surprise after several remarks over the past weeks and months.

Price action wise, a victory from Joe Biden would seem to be considered “USD weak” among market participants for two primary reasons:

  • It increases the chances of a massive fiscal package arriving sooner rather than later to stabilize the US economy
  • There would likely be an ultra-dovish approach from the US central bank FED to finance that fresh US debt.

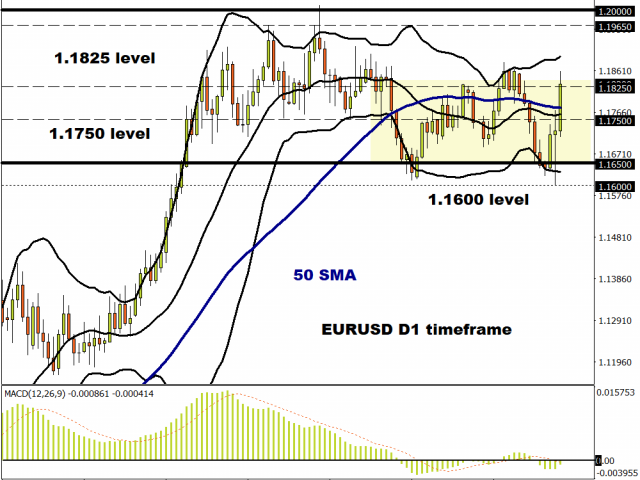
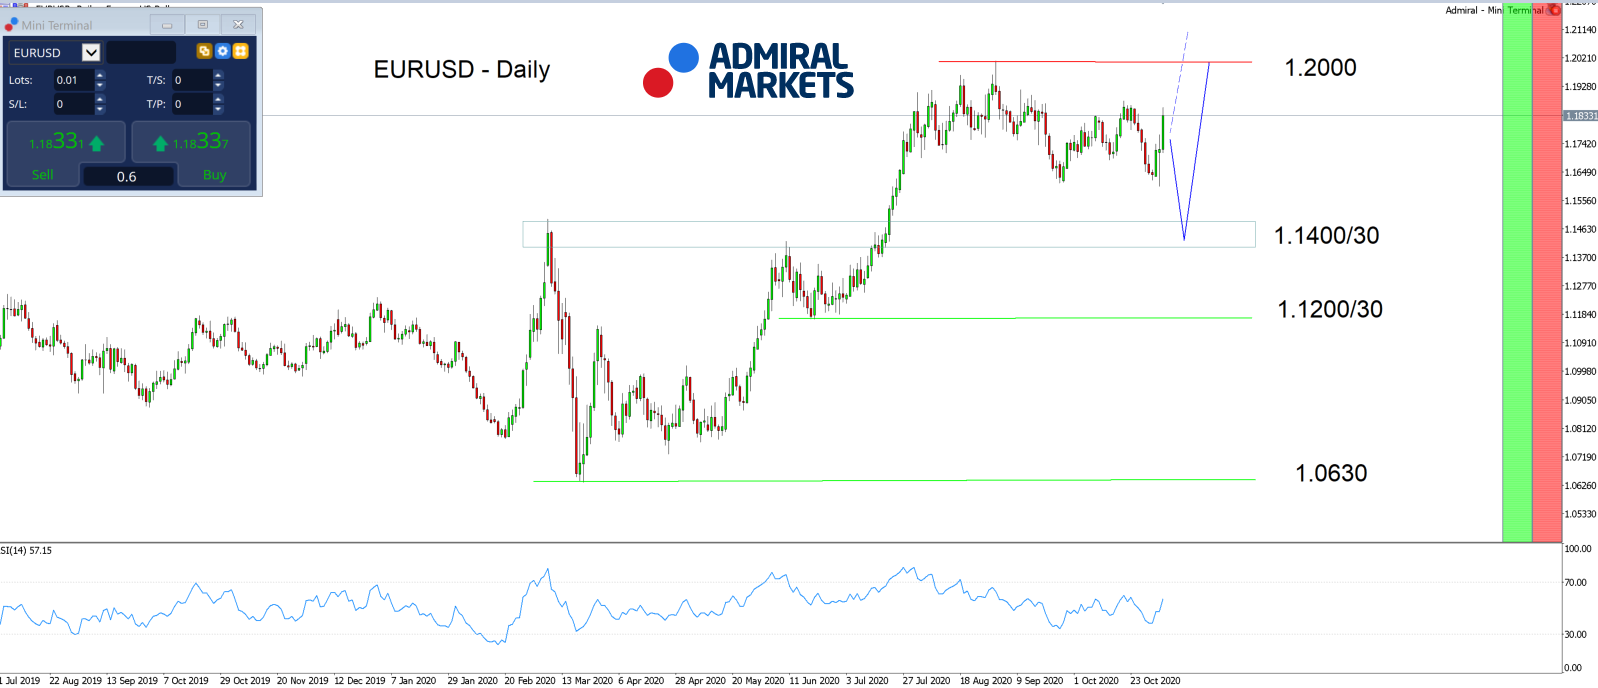
Technically, there would be a push into the region around 1.1600, the EURUSD September lows, but finding support here would be the first positive sign with further bullish momentum to be expected if the currency pair sustainably recaptured 1.1800.

In general, it seems as if the Euro can currently withstand any economic fears since France and Germany have introduced a 2nd lockdown, beginning this week onwards, raising questions if further ECB stimulus in the near-term is around the corner, potentially resulting the Euro selling on a broad scale due to the continuing expansion of the ECB balance sheet.

Given that “strong” sign, our US-Dollar scepticism and expected USD weakness in the days and weeks to come (probably triggered today by a weak US employment print), we expect a near-term stint up to 1.1870/1900 with a break higher, levelling the path up to the current yearly highs around 1.2000.

We also see chances getting smaller and smaller of a break below 1.1600 and a stint as low as 1.1450/1500 after recent developments and price action:

EURUSD Daily chart Source: Admiral Markets MT5 with MT5SE Add-on EURUSD Daily chart (from July 31, 2019, to November 05, 2020). Accessed: November 05, 2020, at 10:00 PM GMT. Please note: Past performance is not a reliable indicator of future results, or future performance.


In 2015, the value of the EURUSD fell by 10.2%, in 2016, it fell by 3.2%, in 2017, it increased by 13.92%, in 2018, it fell by 4.4%, and in 2019, it fell by 2.2%, meaning that in five years, it was down by 7.3%.

Discover the world’s #1 multi-asset platform

Admiral Markets offers professional traders the ability to trade with MetaTrader 5, allowing you to experience trading at a significantly higher, more rewarding level than with MetaTrader 4. Experience benefits such as the addition of the Market Heat Map, so you can compare various currency pairs to see which ones might be lucrative investments, access real-time trading data, and so much more. Click the banner below to start your FREE download of MT5!

Trade With MetaTrader 5

Disclaimer: The given data provides additional information regarding all analysis, estimates, prognosis, forecasts or other similar assessments or information (hereinafter “Analysis”) published on the website of Admiral Markets. Before making any investment decisions please pay close attention to the following:

  1. This is a marketing communication. The analysis is published for informative purposes only and is in no way to be construed as investment advice or recommendation. It has not been prepared in accordance with legal requirements designed to promote the independence of investment research, and that it is not subject to any prohibition on dealing ahead of the dissemination of investment research.
  2. Any investment decision is made by each client alone whereas Admiral Markets shall not be responsible for any loss or damage arising from any such decision, whether or not based on the Analysis.
  3. Each of the Analysis is prepared by an independent analyst (Jens Klatt, Professional Trader and Analyst, hereinafter “Author”) based on the Author’s personal estimations.
  4. To ensure that the interests of the clients would be protected and objectivity of the Analysis would not be damaged Admiral Markets has established relevant internal procedures for prevention and management of conflicts of interest.
  5. Whilst every reasonable effort is taken to ensure that all sources of the Analysis are reliable and that all information is presented, as much as possible, in an understandable, timely, precise and complete manner, Admiral Markets does not guarantee the accuracy or completeness of any information contained within the Analysis. The presented figures that refer to any past performance is not a reliable indicator of future results.
  6. The contents of the Analysis should not be construed as an express or implied promise, guarantee or implication by Admiral Markets that the client shall profit from the strategies therein or that losses in connection therewith may or shall be limited.
  7. Any kind of previous or modelled performance of financial instruments indicated within the Publication should not be construed as an express or implied promise, guarantee or implication by Admiral Markets for any future performance. The value of the financial instrument may both increase and decrease and the preservation of the asset value is not guaranteed.
  8. The projections included in the Analysis may be subject to additional fees, taxes or other charges, depending on the subject of the Publication. The price list applicable to the services provided by Admiral Markets is publicly available from the website of Admiral Markets.
  9. Leveraged products (including contracts for difference) are speculative in nature and may result in losses or profit. Before you start trading, you should make sure that you understand all the risks.

By Admiral Markets

Risk-on surge takes breather

By Han Tan, Market Analyst, ForexTime

After a stellar surge this week, US equities could see a dip going into the weekend. The futures contracts for the Dow, Nasdaq, and the S&P 500 are dipping into the red at the time of writing, as investors continue their wait for the declared winner of the 2020 US presidential elections.

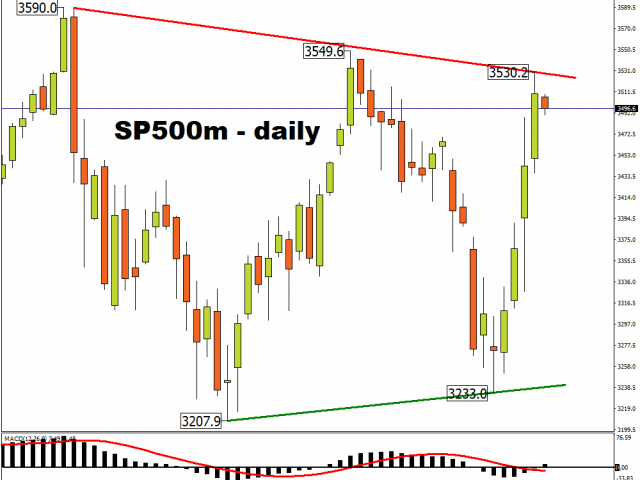
The S&P 500 Minis appear to be forming a symmetrical triangle formation, having posted lower highs and higher lows since notching a record closing price in early September. From a technical perspective, prices would have to best the 3549.6 mark in order to break out of this squeeze. Such a catalyst may arrive in the form of an official declaration over who has officially won the US elections, and such a monumental development could then spur equity bulls on to pushing US equities even higher.

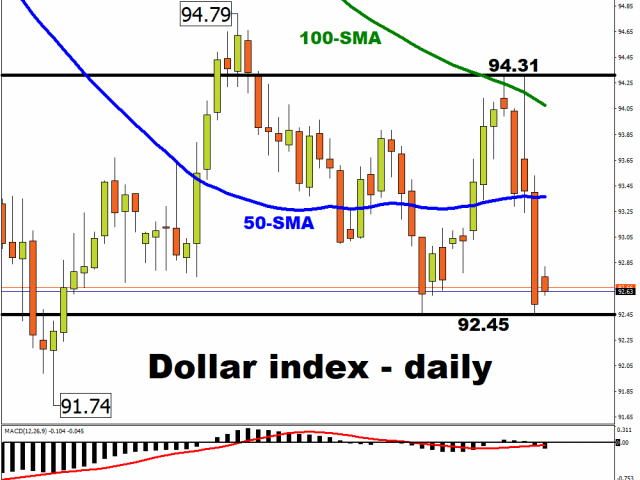
Meanwhile, the Dollar index’s (DXY) initial post-election spike was capped around its 100-day simple moving average (SMA) once more before being reacquainted with the 92.45 support level, after tumbling below its 50-day SMA yesterday.

Given the rising prospects of a President Biden, the Greenback quickly rediscovered its easing bias as a Democrat-helmed administration could hasten a fresh round of US fiscal stimulus. Still, a divided government is likely to dampen the total value of the next fiscal support package, which in turn may stop the Greenback from capitulating.

With the make-up of the US government still in limbo at the time of writing, the Fed may have to step up its support for the US economy should the outlook deteriorate in the face of stubbornly rising Covid-19 cases. Having left US interest rates near zero and its bond-buying programme unaltered this week, Fed Chair Jerome Powell appears to have left the door open for further monetary policy support at the FOMC’s December meeting.

Investors are set to receive another major health check over the state of the world’s largest economy. The October US non-farm payrolls due later Friday are expected to post a sub-600k print, which would underscore the stuttering recovery in the jobs market and underscore the dire need for further fiscal support.

In terms of swaying global risk sentiment, the hard-economic data is likely to play second-fiddle to the latest developments surrounding the US presidential race. However, that isn’t to say that the NFP release doesn’t hold the ability to move the risk pendulum. A positive NFP surprise however could shore up support for the Dollar while potentially encouraging US stocks to end the week on a positive note.


Disclaimer: The content in this article comprises personal opinions and should not be construed as containing personal and/or other investment advice and/or an offer of and/or solicitation for any transactions in financial instruments and/or a guarantee and/or prediction of future performance. ForexTime (FXTM), its affiliates, agents, directors, officers or employees do not guarantee the accuracy, validity, timeliness or completeness, of any information or data made available and assume no liability as to any loss arising from any investment based on the same.


Forex-Time-LogoArticle by ForexTime

ForexTime Ltd (FXTM) is an award winning international online forex broker regulated by CySEC 185/12 www.forextime.com

A tense week slowly comes to an end

By Lukman Otunuga, Research Analyst, ForexTime

The past few days have been tense and eventful for financial market as investors grappled with the US election cliff-hanger and surging coronavirus cases in the parts of Europe, North Africa and the United States.

As this exhausting and emotionally draining week slowly comes to an end, there still remains a strong sense of anticipation as market players await final results of the tightly contested presidential race. Exit polls are indicating a win for Democrat challenger Joe Biden with a divided Congress. While this is not the ‘blue wave’ outcome initially expected, it may open doors to a smaller stimulus package – something that continues to weaken the Dollar.


For my technical traders, the Dollar Index is under increasing pressure on the daily charts. Prices are trading below the 20 and 100 Simple Moving Average while the MACD trades to the downside. The breakdown below 92.70 could open the doors towards 92.00 in the near term. The Index may be dragged lower this evening if the Federal Reserve adopts a dovish tone and expresses concerns over COVID-19 and US economy.


Away from US politics, the British Pound received a solid boost this morning after the Bank of England expanded the Quantitative Easing (QE) program by £150 billion to £895 billion.


Why it matters?

Quantitative easing is a monetary policy tool that central banks use to inject money directly into the economy.

It involves large-scale purchases of government debt in the form of bonds which essentially pushes down the interest rates offered on loans. Lower interest rates make it cheaper for households and businesses to borrow which could stimulate consumption.

With new lockdown rules being imposed across England today, fears remain elevated over a double-dip recession. On top of all of this, Brexit uncertainty still remains a certainty!

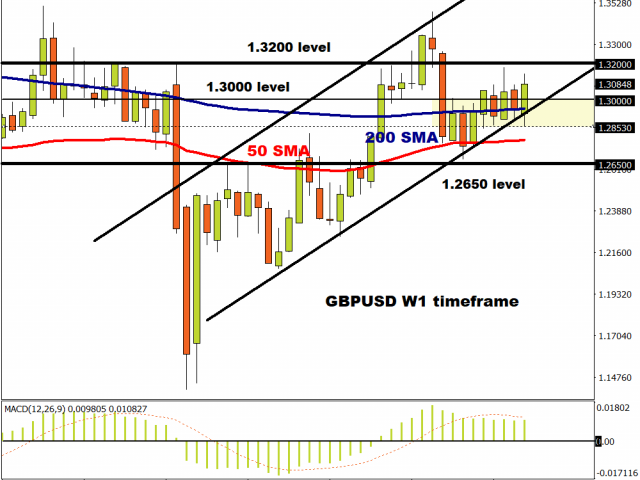
Despite the gloom and doom, the GBPUSD remains bullish on the weekly charts. Could bulls be third time lucky by securing a solid weekly close above 1.3100? Such a scenario may re-open doors back towards 1.3200.


A wild week for the EURUSD 

The EURUSD has staged a solid rebound from the 1.1600 support level this week thanks to a weaker US Dollar.

Looking at things from a purely technical perspective, bulls could be back in town if a daily close above 1.1860 is achieved. Such a move could swing open the doors to the next key resistance level at 1.1965 and 1.2000. Should prices remain trapped below 1.1825, the currency could decline back towards 1.1750.


Commodity spotlight – Gold 

Gold’s bullish price action highlights how markets are pricing in a Biden victory.

However, things could turn volatile for the precious metal if Trump contests the election results and seeks the Supreme Court’s intervention. Despite the rally in equity markets, investors remain somewhat jittery and this could fuel appetite for safe-haven Gold.

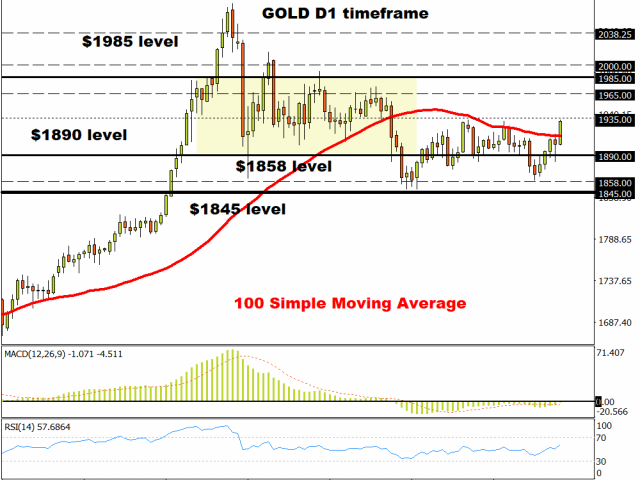
Looking at the technical picture, the precious metal is turning bullish on the daily charts. A solid breakout above $1935 may trigger an incline towards $1965.


Disclaimer: The content in this article comprises personal opinions and should not be construed as containing personal and/or other investment advice and/or an offer of and/or solicitation for any transactions in financial instruments and/or a guarantee and/or prediction of future performance. ForexTime (FXTM), its affiliates, agents, directors, officers or employees do not guarantee the accuracy, validity, timeliness or completeness, of any information or data made available and assume no liability as to any loss arising from any investment based on the same.


Forex-Time-LogoArticle by ForexTime

ForexTime Ltd (FXTM) is an award winning international online forex broker regulated by CySEC 185/12 www.forextime.com

Why the Market’s “Faith in the Fed” May Be Dwindling Fast

A chart that could be “a proxy for the market’s faith in the Fed” shows “a classic loss of momentum”

By Elliott Wave International

Legendary financier John Pierpont Morgan was — for all practical purposes — a one-man central bank before the Fed came into existence in 1913.

During the financial panic of 1907, the banking titan used his influence to provide bailouts for faltering financial institutions. And, back in 1895, he had actually loaned the federal government money during another crisis.

As the October Global Market Perspective, an Elliott Wave International monthly publication which covers 50-plus markets worldwide, noted:

The creation of the Fed had J.P. Morgan at its heart and, since then, the relationship has been very cozy (witness the Fed gifting J.P. Morgan Bear Stearns for a tenth of its value in 2008).

All of what’s been said relates to this chart and commentary — also from the October Global Market Perspective:

[The chart] shows the relative performance of J.P. Morgan to the U.S. banking sector. A very clear five-wave advance can be seen from 2002 with the fifth wave being shallower than the third, a classic loss of momentum as the impulse fades. This chart could be a proxy for the market’s faith in the Fed. If that is so, the Fed’s zenith is being crested right now.

Of course, the conventional wisdom has been that the Fed holds a lot of power over the economy and even the stock market.

The 2020 edition of Robert Prechter’s Conquer the Crash calls this the “potent directors” fallacy. Here’s a quote from the book:

It is nearly impossible to find a treatise on macroeconomics today that does not assert or assume that the Federal Reserve Board has learned to control the credit supply, interest rates, the rate of inflation and the economy. Many people believe that it also possesses immense power to manipulate the stock market.

The very idea that it can do these things is false. …

Real economic growth in the U.S. was greater in the nineteenth century without a central bank than it [had] been in the twentieth century with one.

The U.S. has experienced numerous financial crises in its history.

Here in the waning weeks of 2020, the evidence suggests that the next one may be one of the most severe. This financial earthquake will likely shake the entire globe.

Prepare now.

Let’s return to the 2020 edition of Conquer the Crash:

The discrepancy between the value of total debt outstanding and the value of its real underlying collateral is huge. It is anyone’s guess how much of that gap ultimately will have to close to satisfy the credit markets in a deflationary depression. For our purposes, it is enough to say that the gap itself, and therefore the deflationary potential, has never been larger.

Now is the time to read Elliott Wave International’s special free report: “What You Need to Know Now About Protecting Yourself from Deflation.”

This article was syndicated by Elliott Wave International and was originally published under the headline Why the Market’s “Faith in the Fed” May Be Dwindling Fast. EWI is the world’s largest market forecasting firm. Its staff of full-time analysts led by Chartered Market Technician Robert Prechter provides 24-hour-a-day market analysis to institutional and private investors around the world.