The Week Ahead: Take It Or Leave It

By Orbex

GBPCHF Consolidates as Brexit Deadline Looms
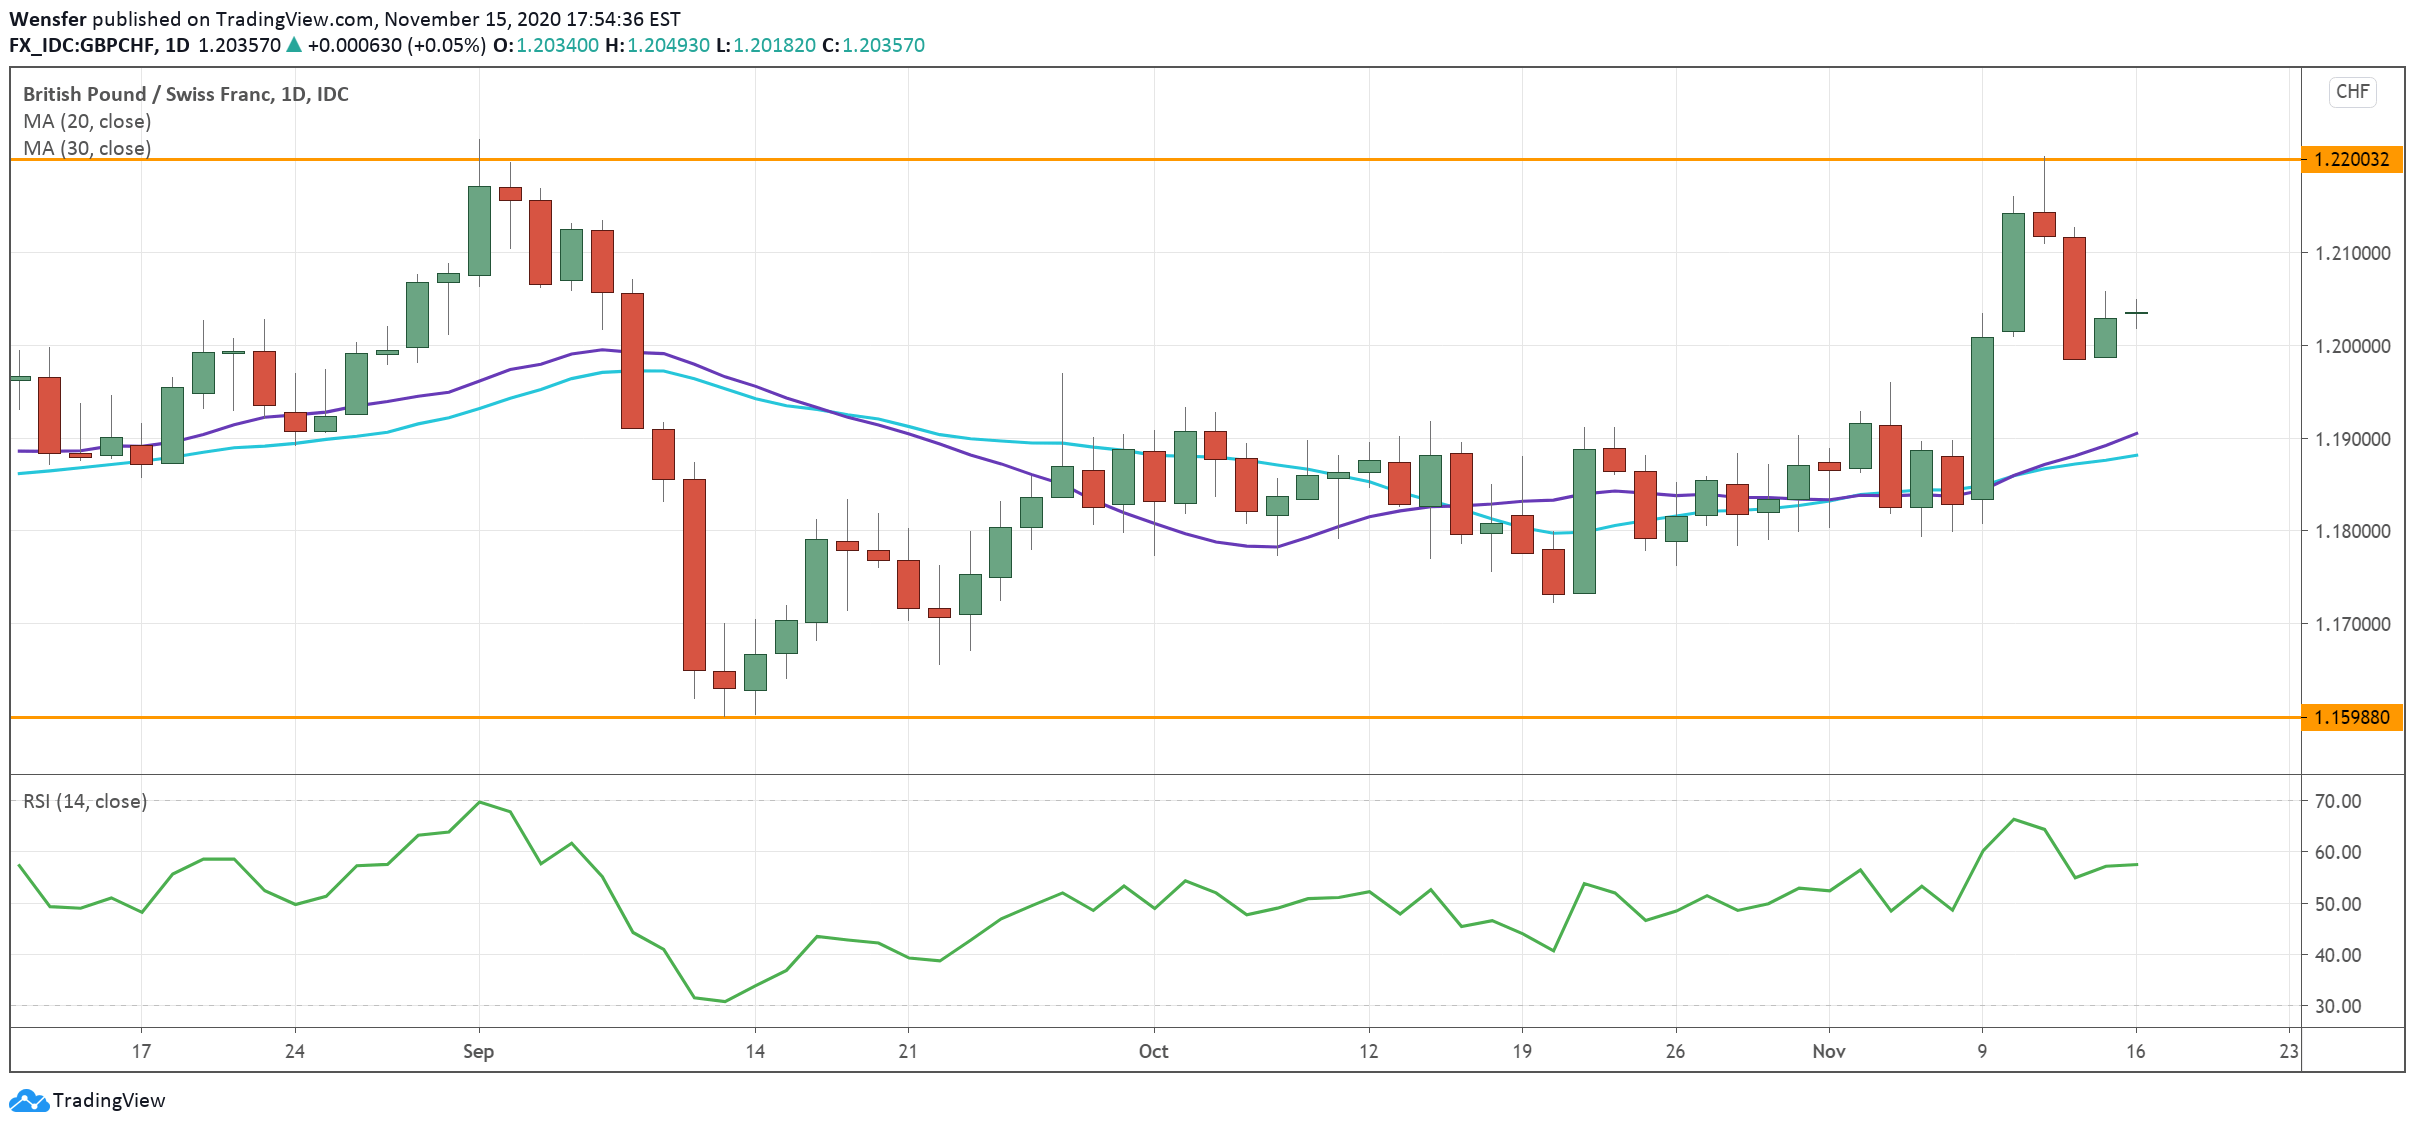
Pressure mounts as Brexit negotiations go into its crucial week. A deal must be reached by the end of November so the EU could pass it into legislation before the end of the transition period in January.

The European Council is scheduled to discuss the divorce on Thursday, and an agreement, or the lack of it, could turn the market upside down. There is still a risk of another breakdown and it would not be surprising to see an extension to the deadline.

In this case, the Sterling could give back its recent gains. The pound has fallen back from the previous high of 1.2200. 1.1600 is the lower band of the consolidation range.

USDCAD Recovers on Profit-Taking
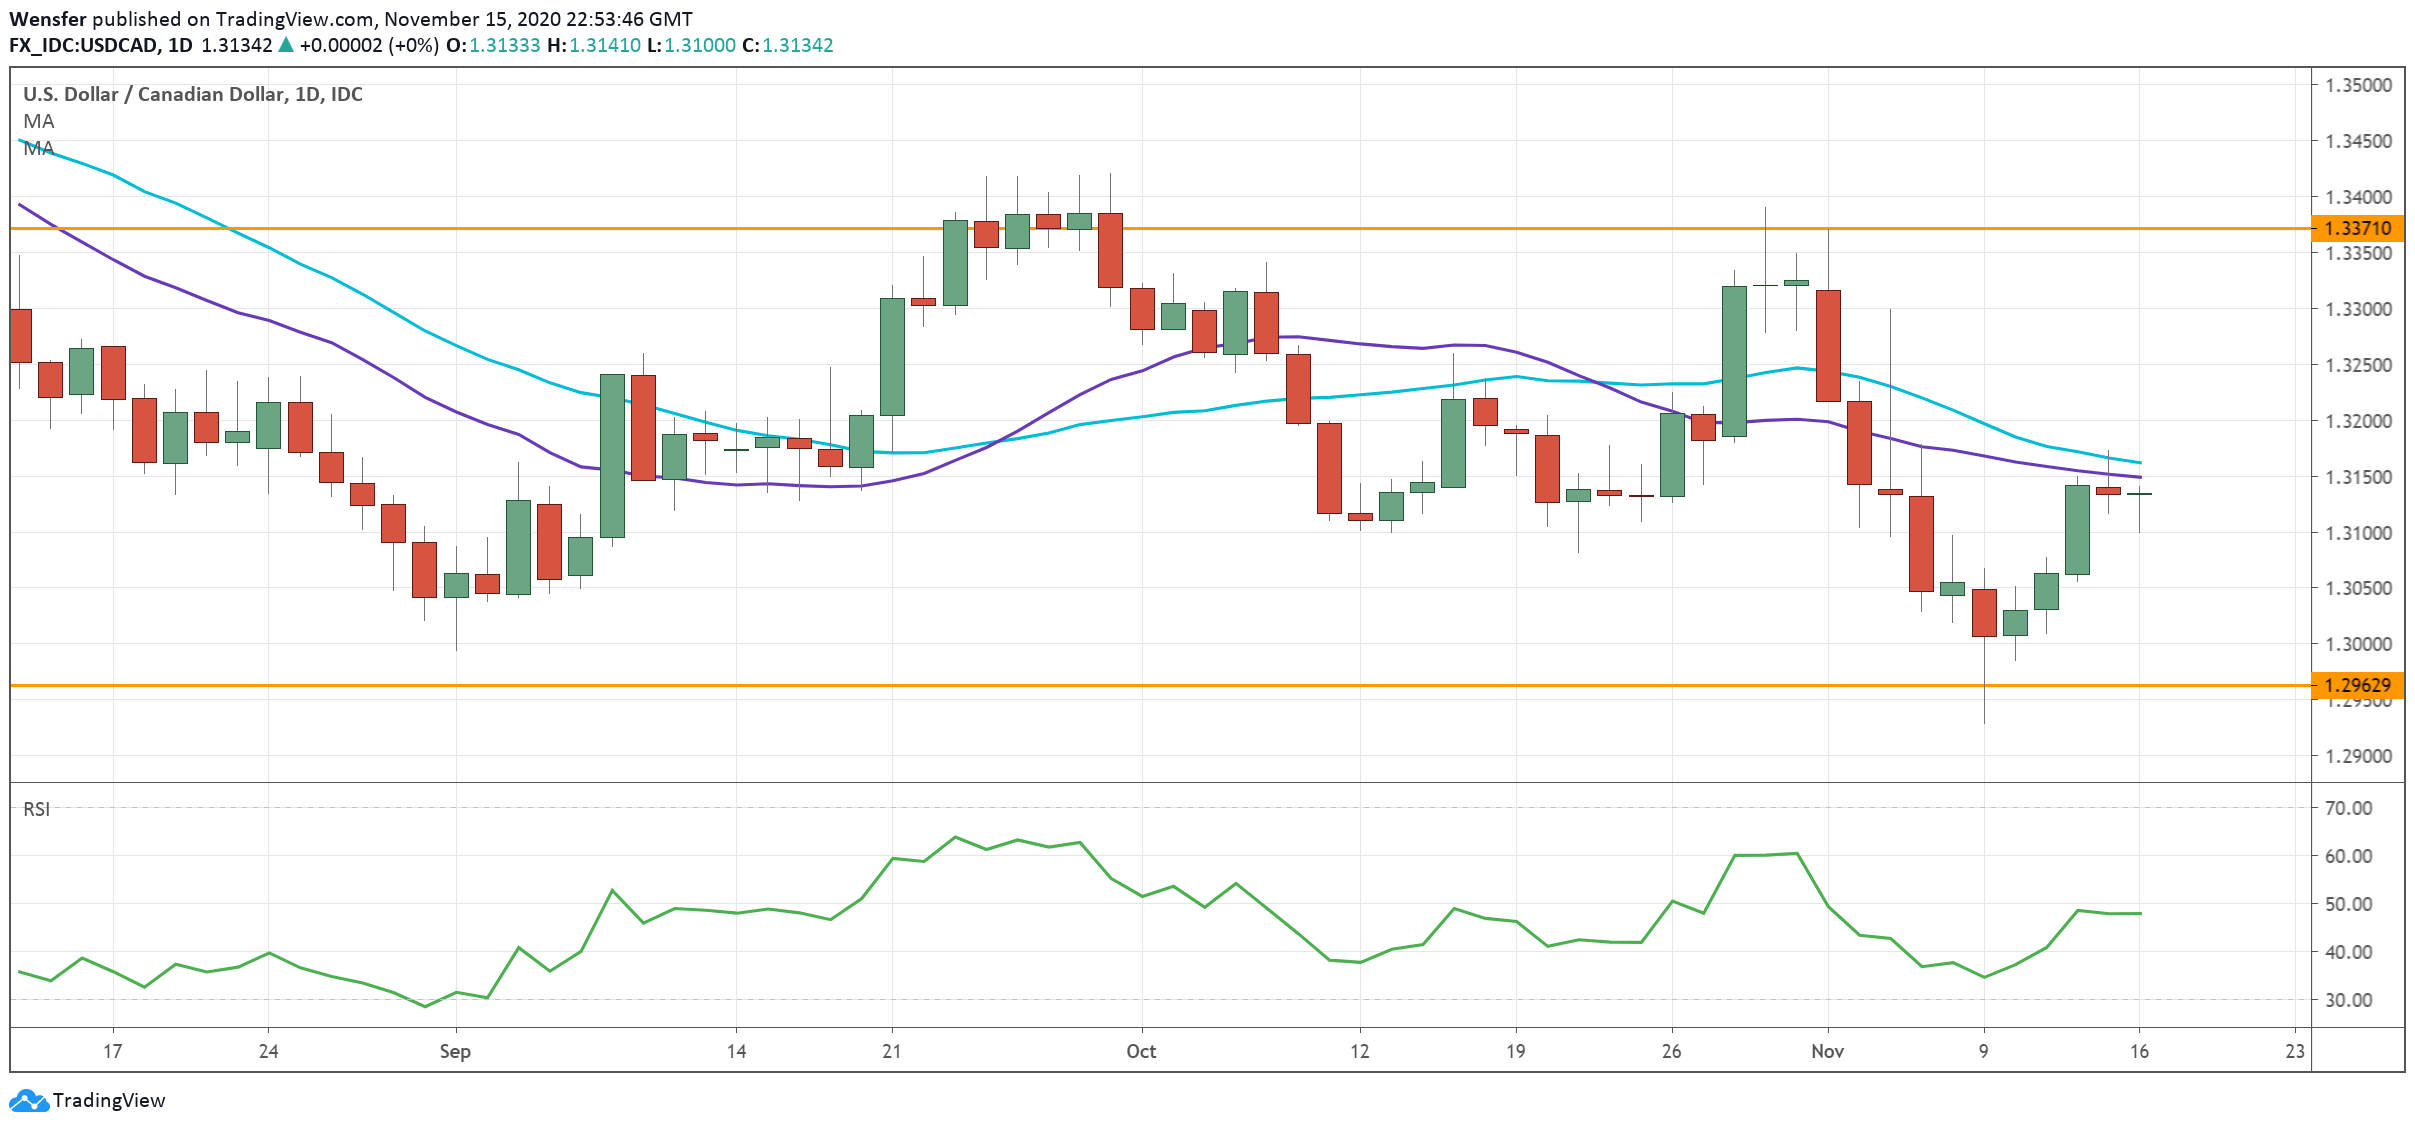
The US dollar has bounced back from its 10-month low as sellers took some chips off the table. The election-themed USD trade might be over as Biden cemented his victory with a flip in Arizona.

Investors have shifted their attention to the readiness of the vaccine after a preliminary surge of enthusiasm. More positive headlines would mean global trade could resume sooner which would favour the commodity-linked loonie.

In the meantime, this week’s inflation and retail sales may offer intraday volatility. The US dollar is rallying towards the resistance of 1.3370, while ast January’s low of 1.2960 is a critical support to monitor.

EURNZD Tanks as RBNZ Downplays Negative Rates
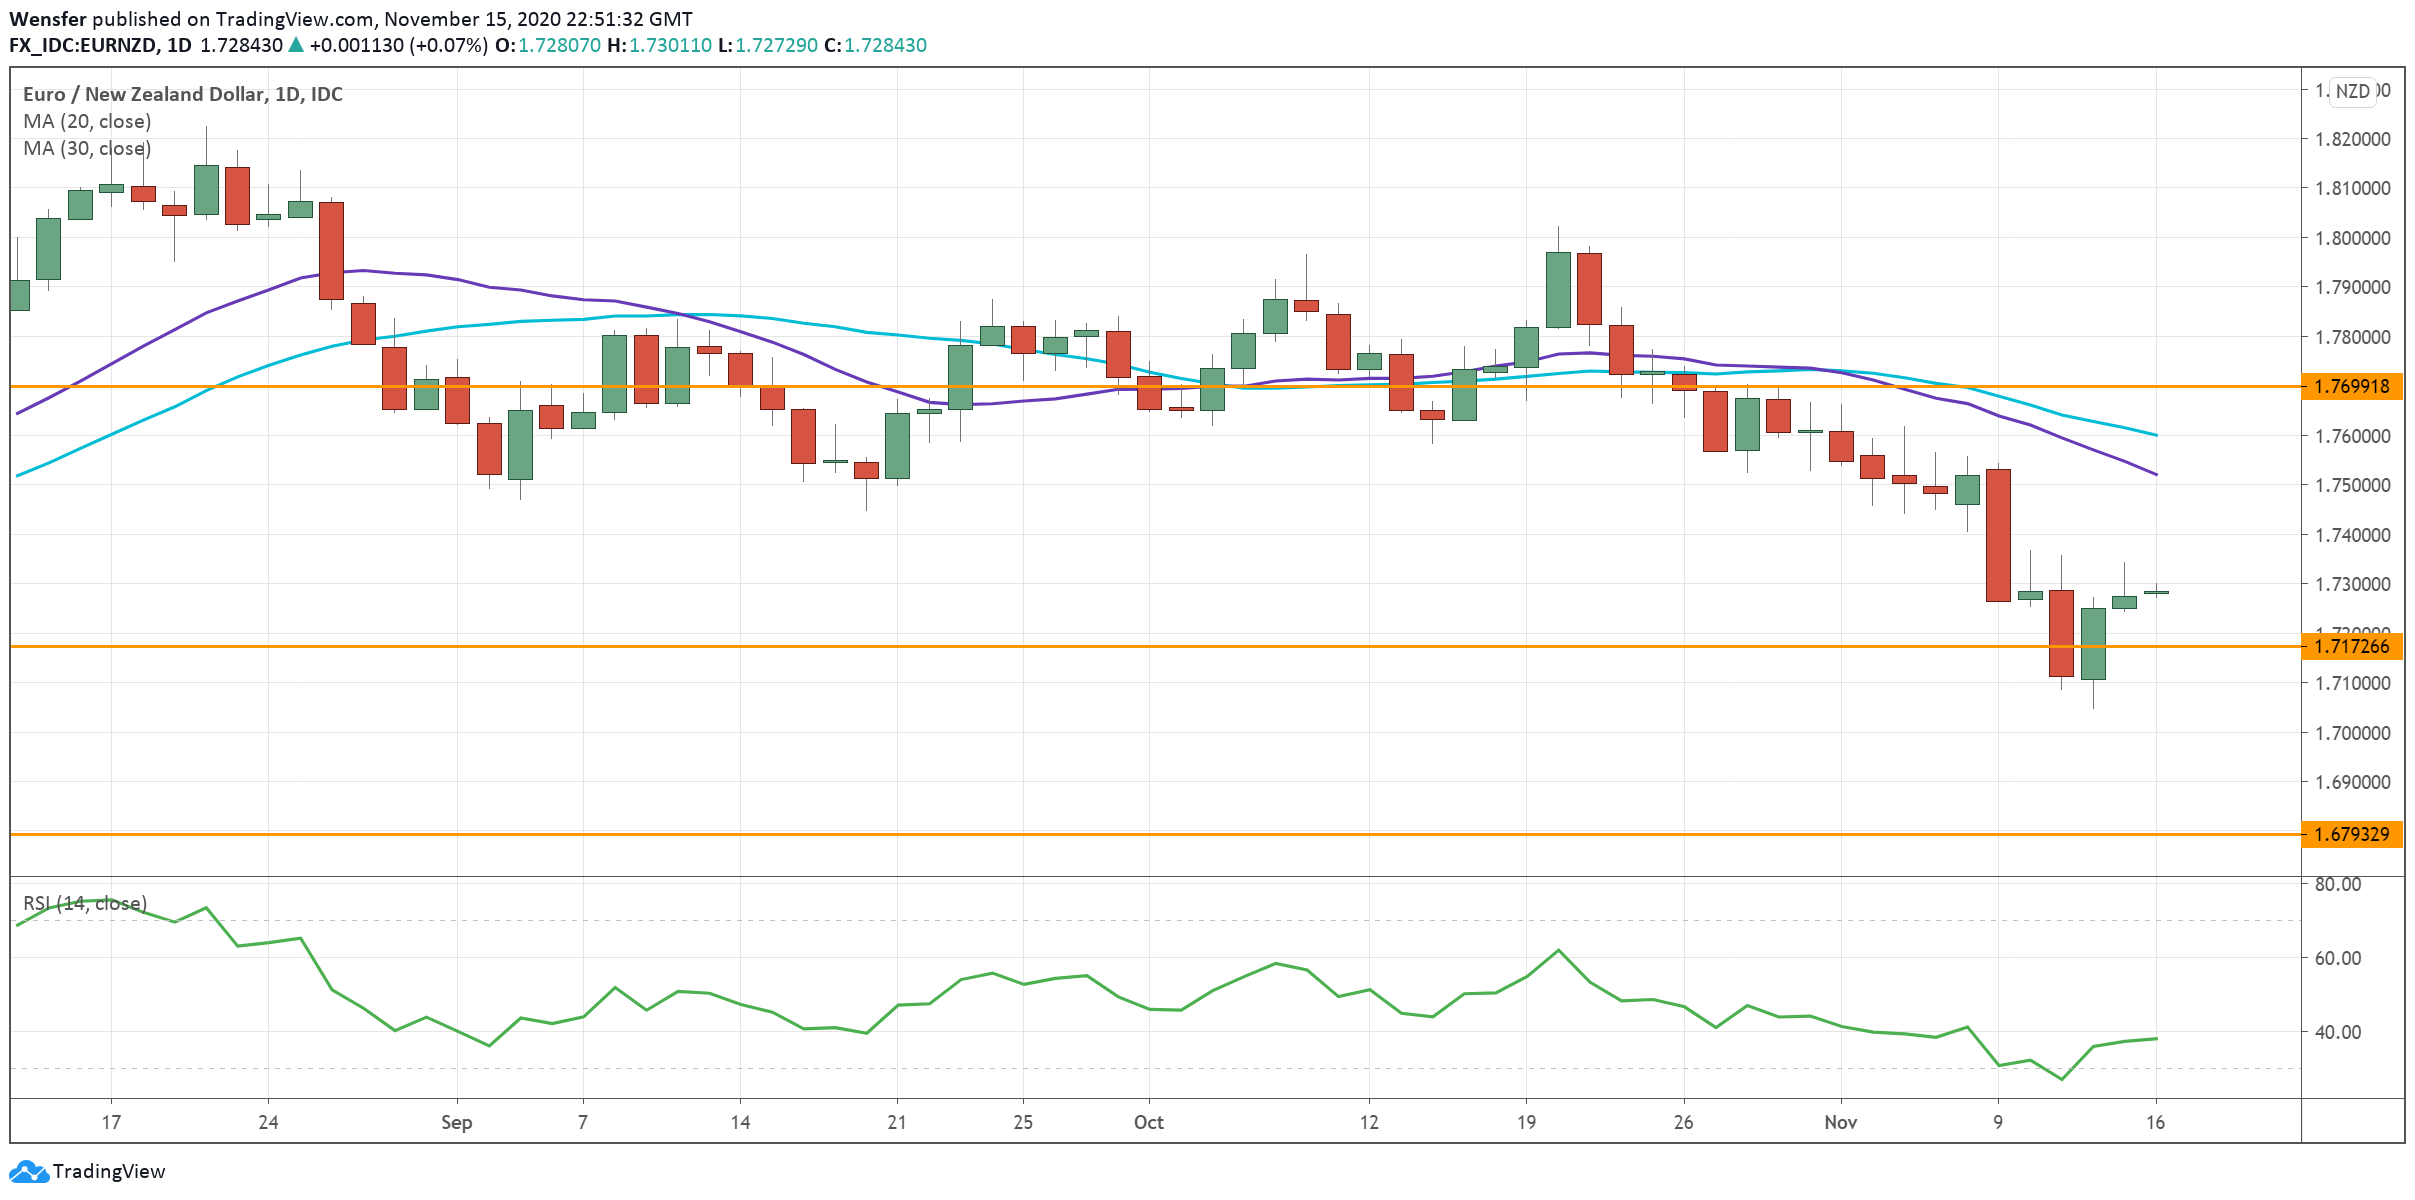
The New Zealand dollar saw a surge in buying interest after a rather hawkish outlook from RBNZ’s meeting last week.

Recognising latest positive development in the economy, the central bank has lifted its interest rate forecast from its statement back in August. This revision means that policymakers would most likely steer away from the much-anticipated negative rates.

As markets price in the bullish U-turn, the kiwi may continue to gain traction as short sides cover their positions. The euro has broken below July’s low of 1.7170, and the sell-off may extend towards 1.67. On the upside, 1.7700 is the immediate resistance level.

AUDJPY Rises as Sentiment Improves

Following the announcement of progress in the Covid-19 vaccine, market optimism has propelled the Australian dollar to recent highs across the board.

As risk-on sentiment brews, the contrast cannot be sharper between a growth-sensitive aussie and a safe haven Japanese yen. The former may not suffer from Reserve Bank’s expanded QE programme since loose monetary policy has become the norm elsewhere.

Its proximity to China’s recovery, however, may help it stand out as demand in commodities picks up again. The pair has rallied above the resistance of 76.50 with the September high of 78.40 as the next target.

By Orbex

Ichimoku Cloud Analysis 16.11.2020 (EURJPY, NZDUSD, BTCUSD)

Article By RoboForex.com

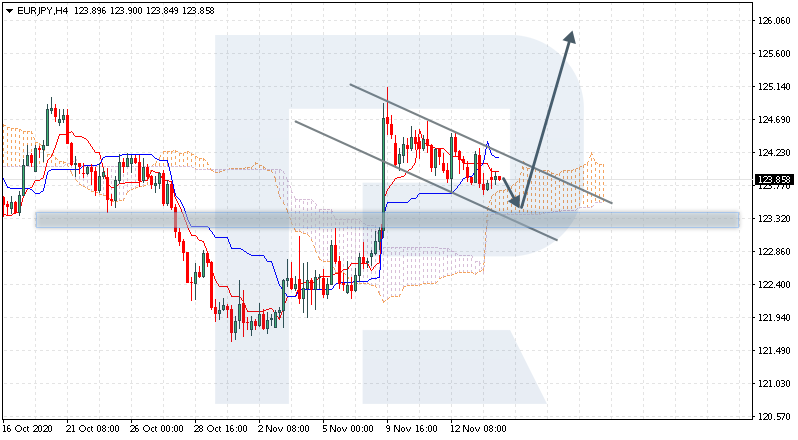
EURJPY, “Euro vs Japanese Yen”

EURJPY is trading at 123.85; the instrument is moving above Ichimoku Cloud, thus indicating an ascending tendency. The markets could indicate that the price may test the cloud’s downside border at 123.45 and then resume moving upwards to reach 125.65. Another signal in favor of further uptrend will be a rebound from the support level. However, the bullish scenario may no longer be valid if the price breaks the cloud’s downside border and fixes below 122.95. In this case, the pair may continue falling towards 121.95. To confirm further growth, the asset must break the upside border of a Flag pattern and fix above 124.55.

EURJPY
Risk Warning: the result of previous trading operations do not guarantee the same results in the future

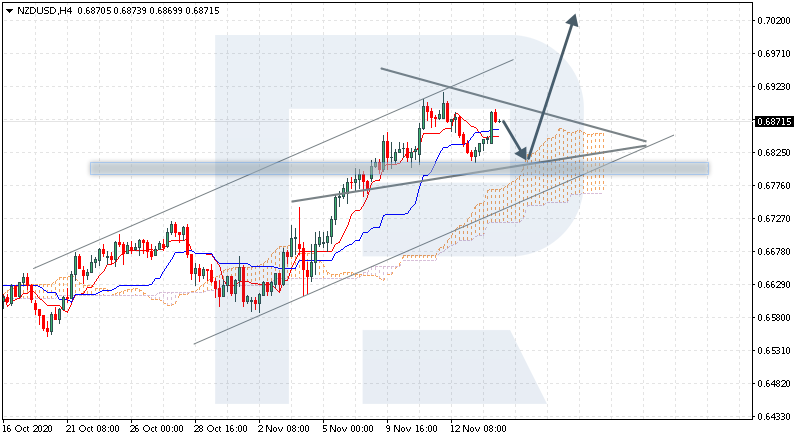
NZDUSD, “New Zealand Dollar vs US Dollar”

NZDUSD is trading at 0.6871; the instrument is moving above Ichimoku Cloud, thus indicating an ascending tendency. The markets could indicate that the price may test the cloud’s upside border at 0.6820 and then resume moving upwards to reach 0.7025. Another signal in favor of further uptrend will be a rebound from the downside border of the Triangle pattern. However, the bullish scenario may be canceled if the price breaks the cloud’s downside border and fixes below 0.6705. In this case, the pair may continue falling towards 0.6615. To confirm further growth, the asset must break the pattern’s upside border and fix above 0.6920.

NZDUSD
Risk Warning: the result of previous trading operations do not guarantee the same results in the future

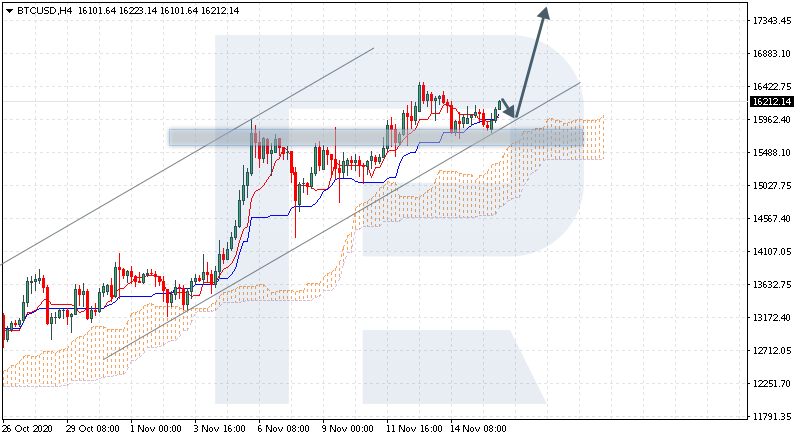
BTCUSD, “Bitcoin vs US Dollar”

BTCUSD is trading at 16212.00; the instrument is moving above Ichimoku Cloud, thus indicating an ascending tendency. The markets could indicate that the price may test Tenkan-Sen and Kijun-Sen at 15965.00 and then resume moving upwards to reach 17345.00. Another signal in favor of further uptrend will be a rebound from the rising channel’s downside border. However, the bullish scenario may no longer be valid if the price breaks the cloud’s downside border and fixes below 14550.00. In this case, the pair may continue falling towards 13605.00.

BTCUSD

Article By RoboForex.com

Attention!
Forecasts presented in this section only reflect the author’s private opinion and should not be considered as guidance for trading. RoboForex LP bears no responsibility for trading results based on trading recommendations described in these analytical reviews.

Weekly Fundamental Bulletin: Japan GDP & Eurozone/UK Inflation

By Orbex

Last week’s highlights

RBNZ surprises with no rate cut

The Reserve Bank of New Zealand surprised the markets with no rate cuts at its meeting last week.

The central bank also ruled out any rate cuts until March next year, putting an end to all speculation.

The kiwi surged in response to the central bank’s inaction. The RBNZ also left its current stimulus purchases unchanged at 100 billion NZD.

The bank stated that starting December, it will begin funding for a lending program to help banks reduce funding costs and lower interest rates.

The decision was slightly hawkish and came as policymakers said that the economic activity since August proved to be more resilient.

UK Q3 GDP rebounds

The UK’s economy managed to move out of a recession at one of the fastest paces on record during the third quarter of the year.

However, this comes just before the nation went into a second lockdown.

Data from the UK’s office for national statistics showed that the GDP grew at a pace of 15.5% sequentially in Q3 2020. This was the biggest expansion in economic activity since record-keeping began.

The expansion was, however, slower than the forecasts of a 15.8% increase. The expansion comes after two consecutive quarterly declines.

US consumer prices stay unchanged in October

Consumer prices in the United States remained unchanged in October, according to official data released last week.

The Labor Department said that the consumer price index was unchanged in October, following a 0.2% increase in the previous month.

Forecasts pointed to an uptick in the headline inflation. Food prices grew at a pace of 0.2% in October while energy prices rose 0.1%.

Excluding food and energy prices, the core inflation rate was also unchanged during the month following a 0.2% increase previously.

German ZEW economic confidence hits a 7-month low

The latest surveys on the economy saw a sharp contraction in November.

The official German ZEW economic confidence survey fell to a seven-month low as a result. This came on the back of the second wave of lockdowns in Germany.

The economic sentiment index fell more than forecast to 39 points in November, down from 56.1 in October. The data was worse than the forecasts of a decline to 41.7.

The current conditions index fell to -64.3 from -59.5 in October. The official note said that the decline in economic confidence mirrors another patch of the economic slowdown in Europe’s largest economy.

China’s consumer prices fall to the lowest levels in 11-years

The latest inflation data from China saw the consumer price index falling to the lowest levels since October 2009.

Official data from the National Bureau of Statistics showed that headline inflation fell to 0.5% in October. This follows a 1.7% increase in the month before.

The data was also well below the general forecasts. The declines came on the back of falling pork prices which fell 2.8% on the year following an increase of 25.5% in the previous month.

The core inflation rate was steady at 0.5% during the month.

Upcoming Economic Events

Japan Q3 GDP set to rebound

Japan will be releasing its third-quarter preliminary GDP report. Forecasts show that there is a strong likelihood that the Japanese economy rebounded in the third quarter following a steep contraction in the previous quarter.

As a result, the Q3 GDP for Japan is forecast to rise 18.9%, following a 28.1% drop in the second quarter.

Despite the rebound, Japan’s GDP still remains well below its pre-pandemic level. The expansion is likely to have been driven by stronger private consumption and exports, both of which were impacted during the second quarter.

Australia unemployment rate to rise in October

Expectations are for Australia’s labor market to slow in October. This comes amid the flare up of the pandemic and the re-introduction of lockdowns.

We can also expect the data for October to be mixed as restrictions eased in parts of Melbourne. An overall softening in the labor market across the states remains a consistent feature, however.

The unemployment rate is therefore forecast to rise to 7.0% or 7.1% for October. Meanwhile, the economy is set to see another month of negative job growth.

Eurozone headline CPI to remain weak

The final Eurozone inflation data is due this week.

Consumer prices continue to remain stubbornly low. Flash estimates pointed to a weak inflation growth of just 0.2%. However, the final HICP will likely provide a bit more details.

Inflation in the services sector hit a record low of 0.4% in October which offset the modest increase in non-energy sectors. Forecasts point to a -0.3% headline print for the Eurozone for October.

UK inflation and retail sales data on tap this week

UK retail sales for October are forecast to show a 0.2% decline on a month over month basis.

The report, which comes a bit too early, covers the period between October 4th through the 30th. Some anecdotal evidence of an increase in retail sales may come on the back of early Christmas shopping.

Online sales on the contrary are likely to keep up the strong trend amid the restrictions.

Earlier in the week, the UK’s inflation report will be coming out. Headline inflation is forecast to rise to 0.6% in October, marking a modest uptick in data.

By Orbex

Forex Technical Analysis & Forecast 16.11.2020

Article By RoboForex.com

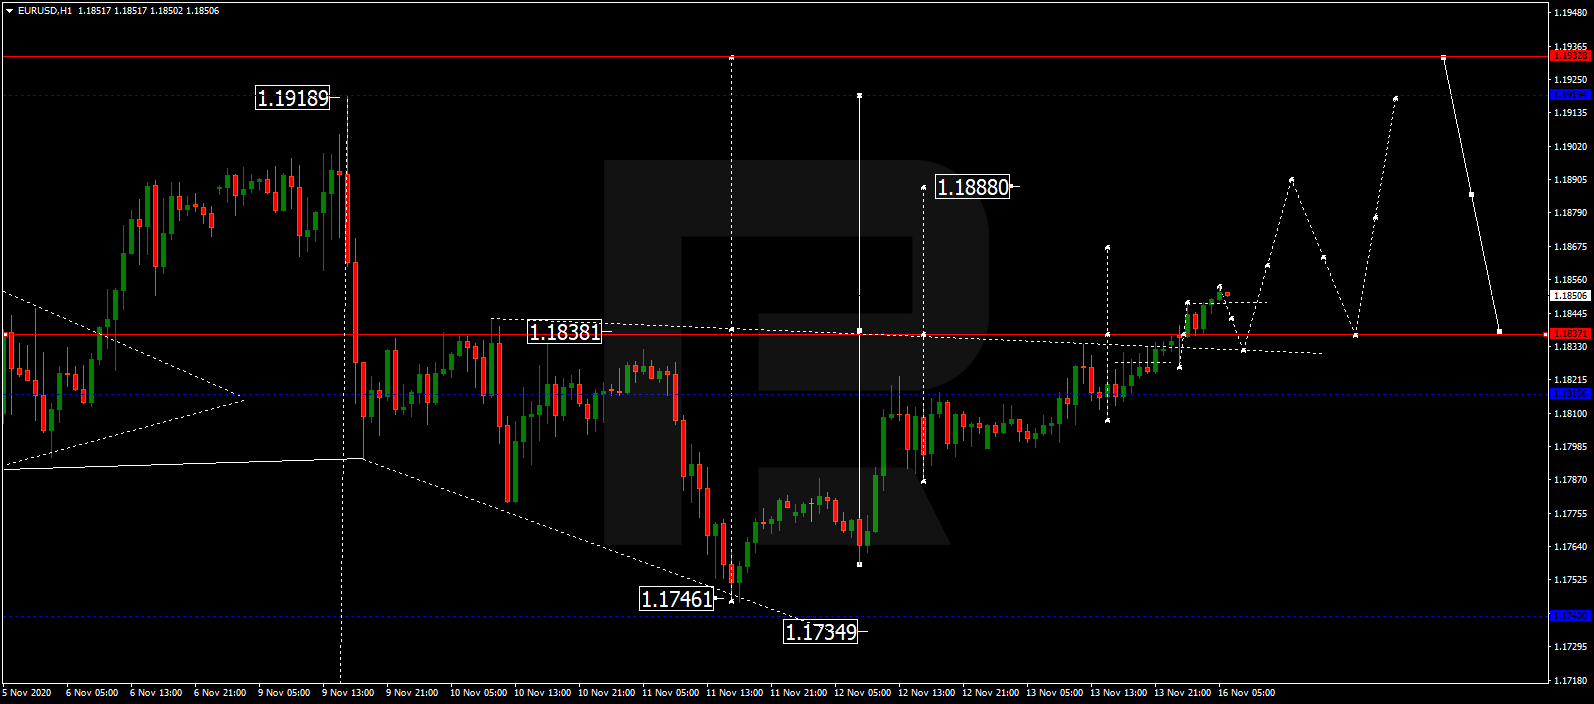
EURUSD, “Euro vs US Dollar”

After completing the ascending wave at 1.1830 and then forming another consolidation range around this level, EURUSD has broken the range upwards and may later continue growing to reach 1.1880. After that, the instrument may correct towards 1.1840 and then start a new growth with the target at 1.1917 or even reach 1.1930.

EURUSD
Risk Warning: the result of previous trading operations do not guarantee the same results in the future

GBPUSD, “Great Britain Pound vs US Dollar”

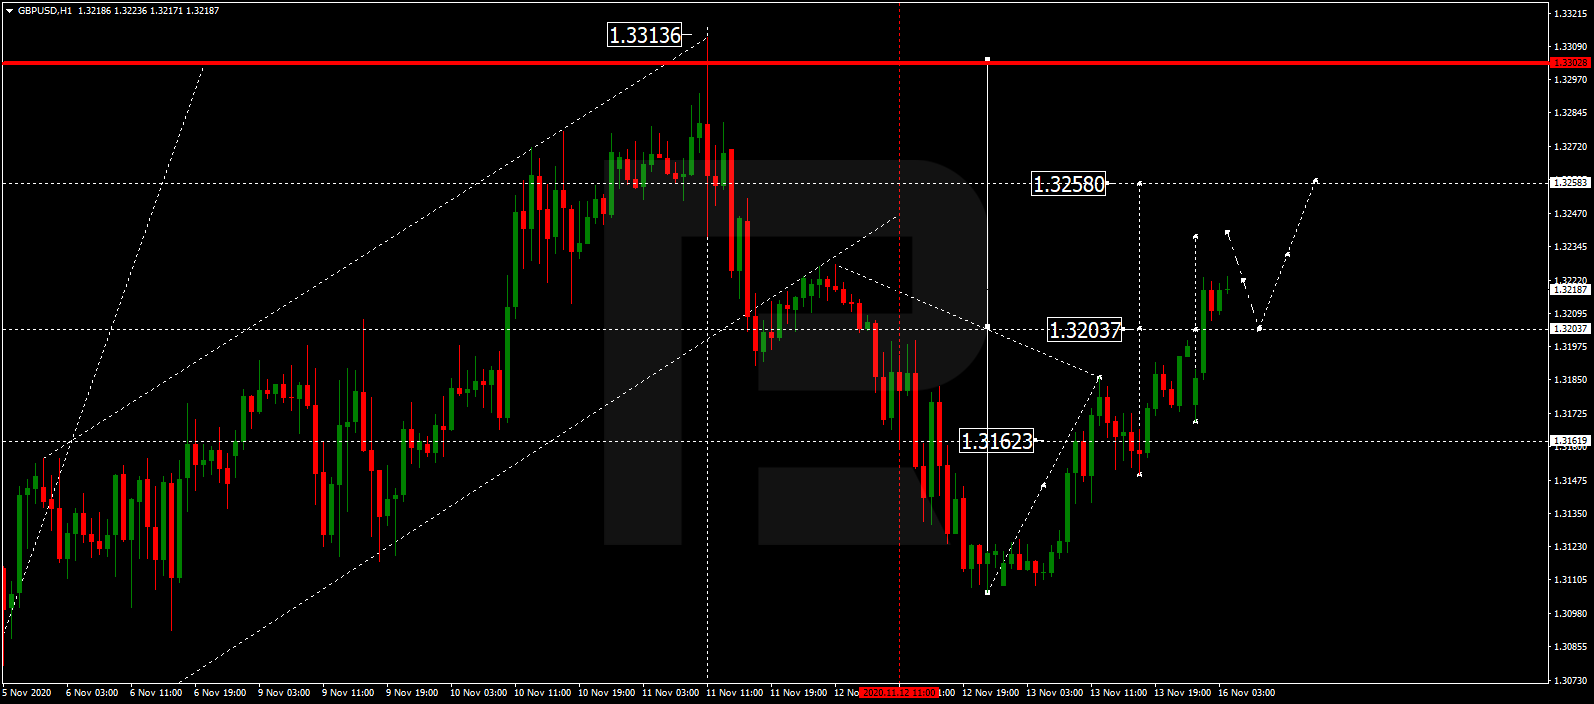
After finishing the ascending wave at 1.3203 and then forming a new consolidation range around this level, GBPUSD has broken the range upwards and may later continue growing to reach 1.3258. After that, the instrument may correct to return to 1.3203 and then resume trading upwards with the target at 1.3300.

GBPUSD
Risk Warning: the result of previous trading operations do not guarantee the same results in the future

USDRUB, “US Dollar vs Russian Ruble”

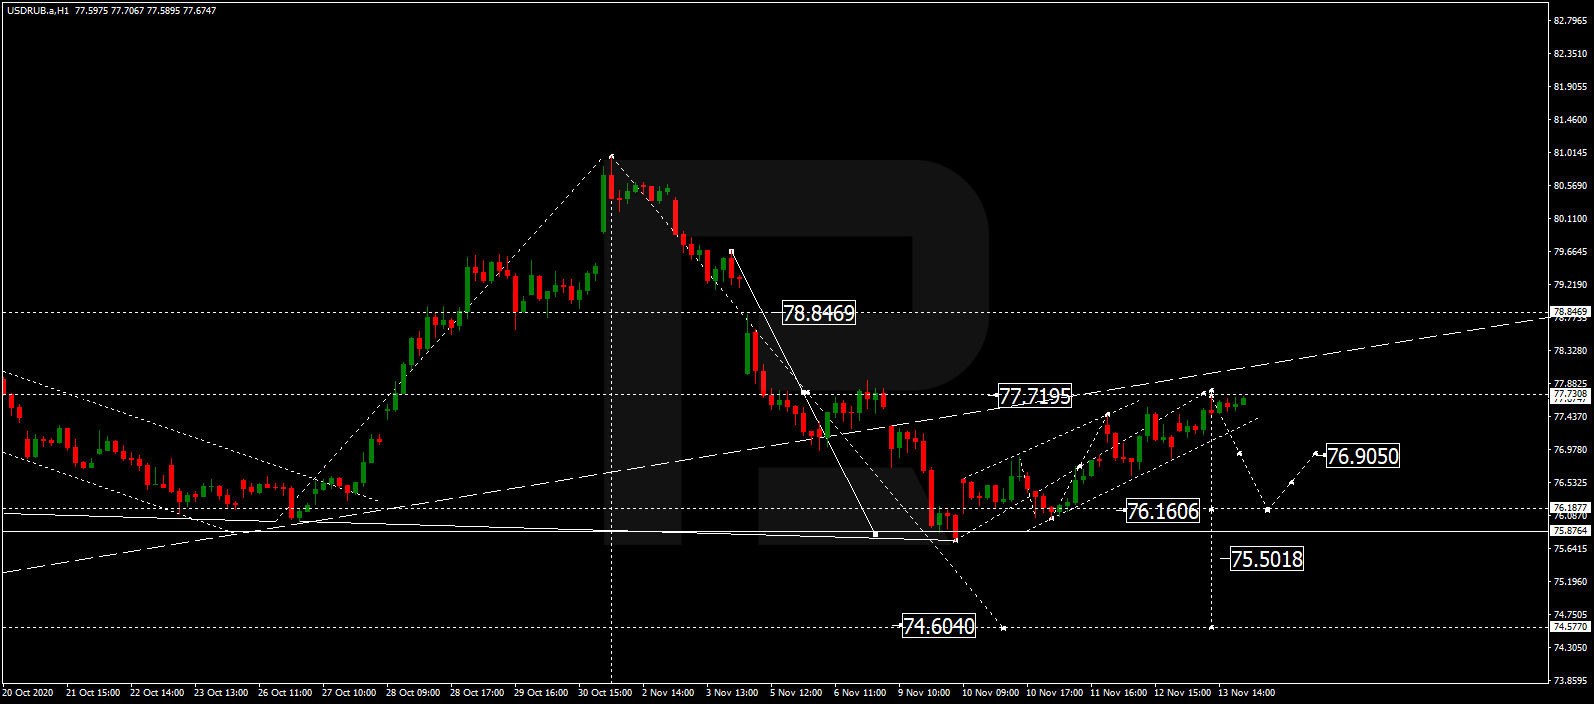
USDRUB has finished the ascending wave at 77.66. Possibly, today the pair may fall to reach 76.16 and then grow towards 76.90, thus forming a new consolidation range around the latter level. If later the price breaks this range to the downside, the market may start another decline with the target at 75.00 or even reach 74.60.

USDRUB
Risk Warning: the result of previous trading operations do not guarantee the same results in the future

USDJPY, “US Dollar vs Japanese Yen”

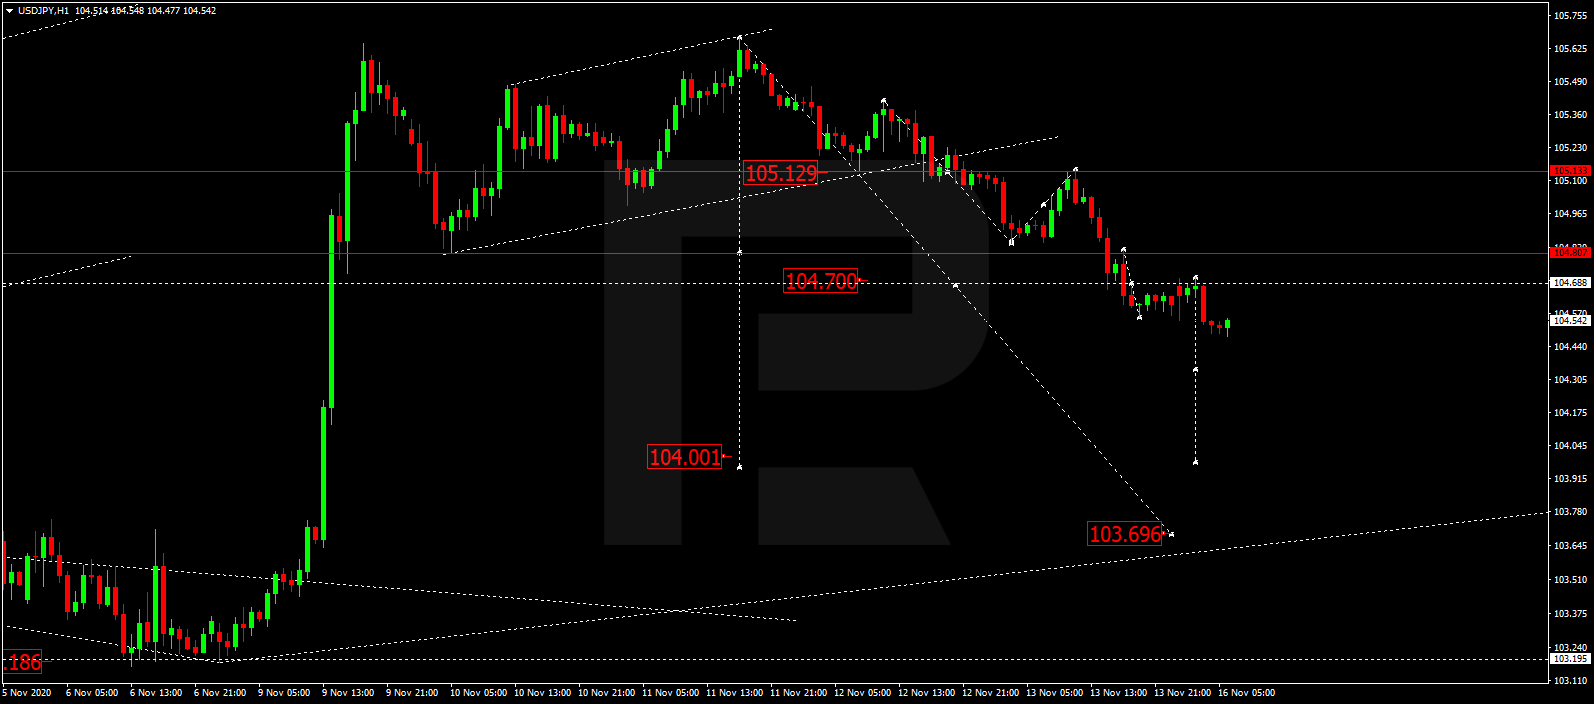
After rebounding from 105.12 and then reaching 104.70, USDJPY has formed a new consolidation range around the latter level just to break it to the downside. Possibly, the pair may continue moving downwards towards 103.70. Later, the market may start another correction to return to 104.70 and then form a new descending structure with the target at 102.50.

USDJPY
Risk Warning: the result of previous trading operations do not guarantee the same results in the future

USDCHF, “US Dollar vs Swiss Franc”

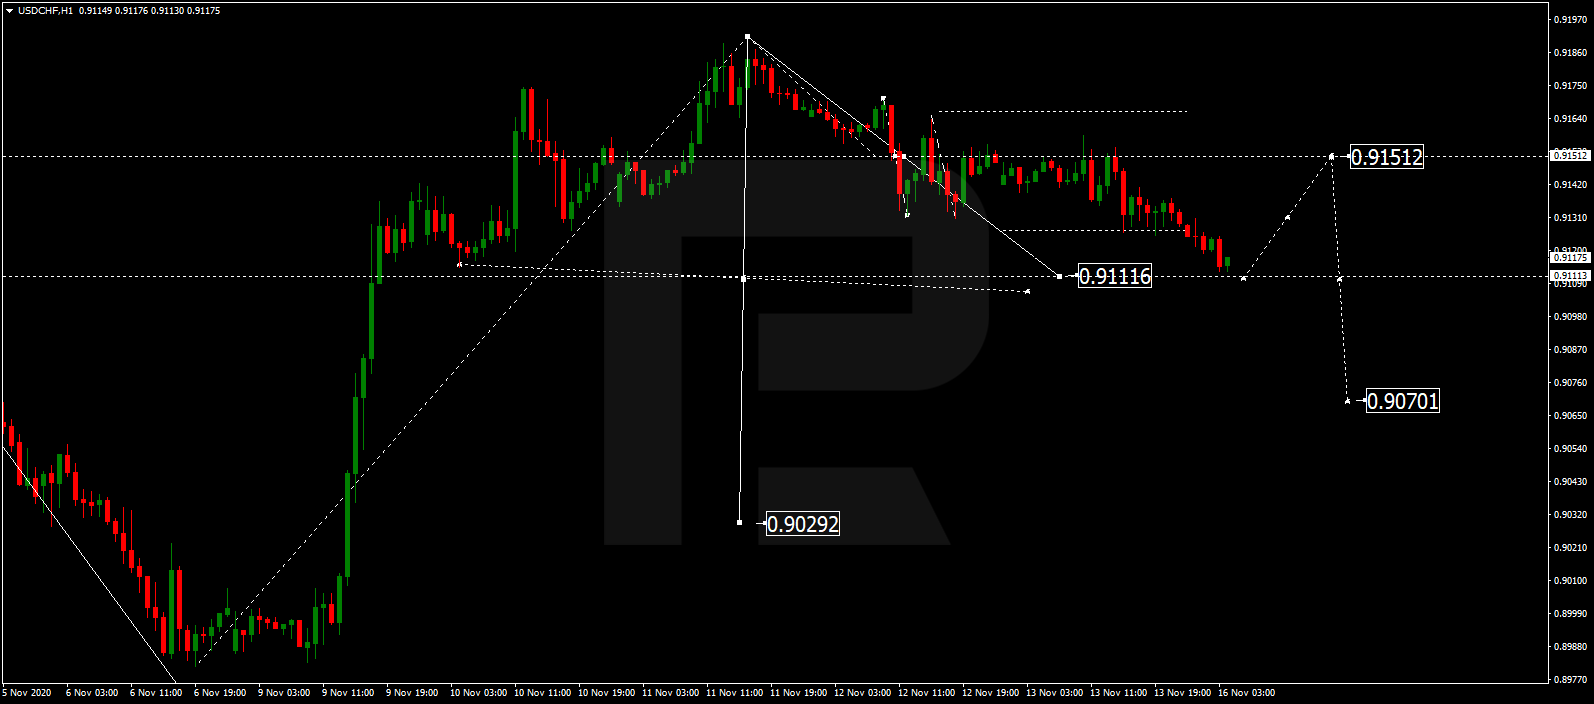
USDCHF is falling towards 0.9111 and may later grow to reach 0.9151, thus forming a new consolidation range between these two levels. If the price breaks this range to the downside, the market may continue the correction with the target at 0.9070.

USDCHF
Risk Warning: the result of previous trading operations do not guarantee the same results in the future

AUDUSD, “Australian Dollar vs US Dollar”

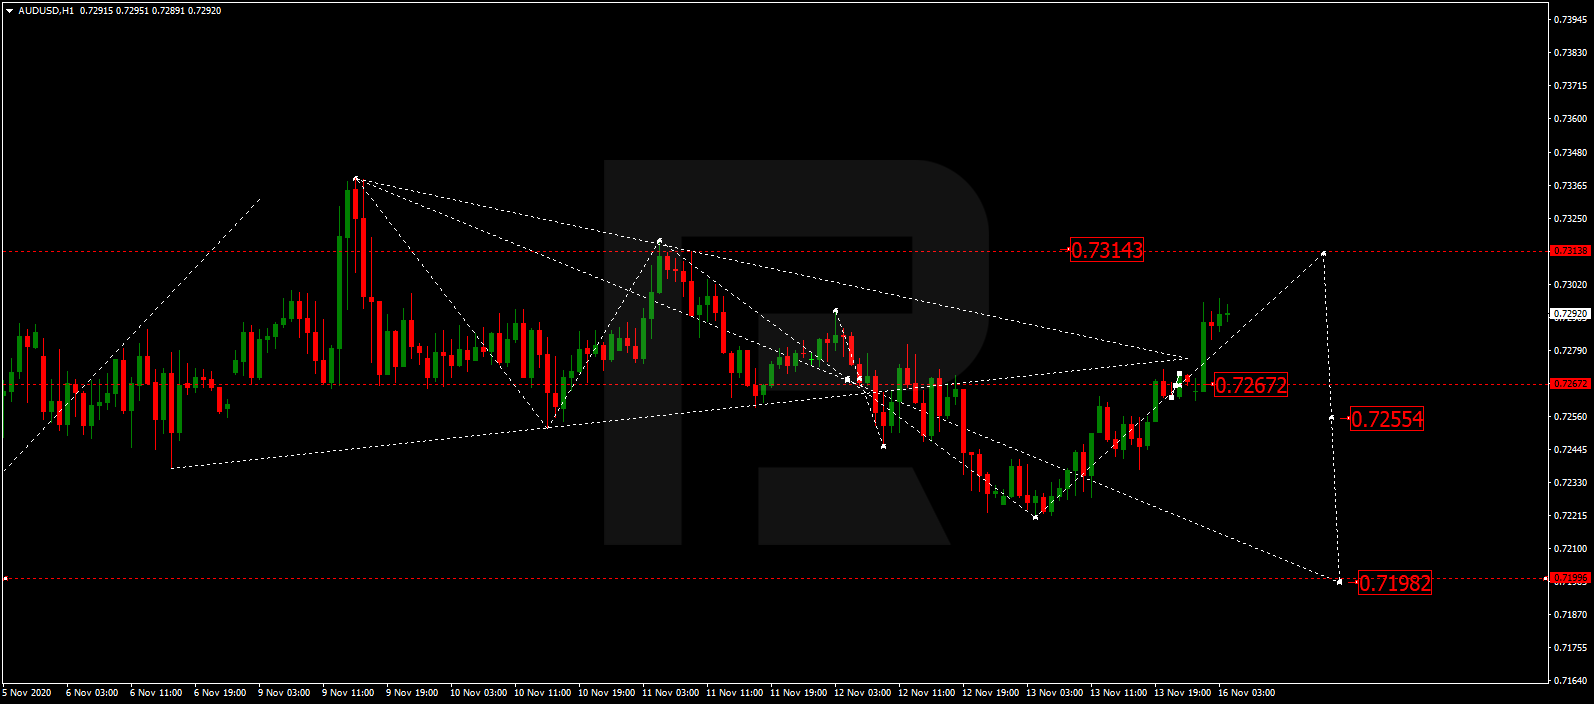
After finishing the ascending wave at 0.7267 and then forming a new consolidation range around this level, AUDUSD has broken the range to the upside. Today, the pair may form one more ascending structure towards 0.7314 and then start a new decline with the first target at 0.7267.

AUDUSD
Risk Warning: the result of previous trading operations do not guarantee the same results in the future

BRENT

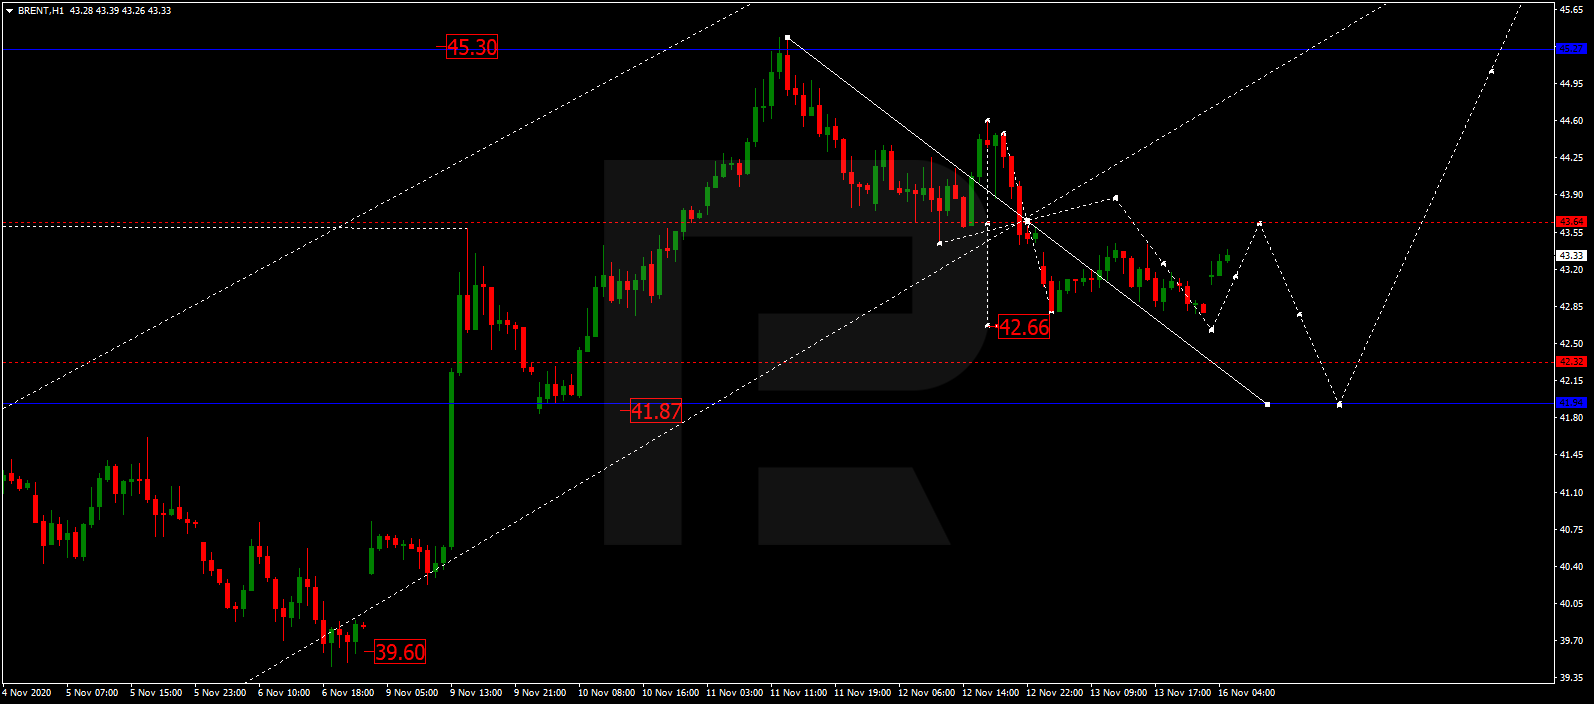
After breaking 43.63 downwards, Brent is consolidating below this level. Possibly, the asset may fall to reach 42.66 and then form one more ascending wave to break 43.64. Later, the market may continue trading upwards with the target at 45.30 or even reach 48.50.

BRENT
Risk Warning: the result of previous trading operations do not guarantee the same results in the future

XAUUSD, “Gold vs US Dollar”

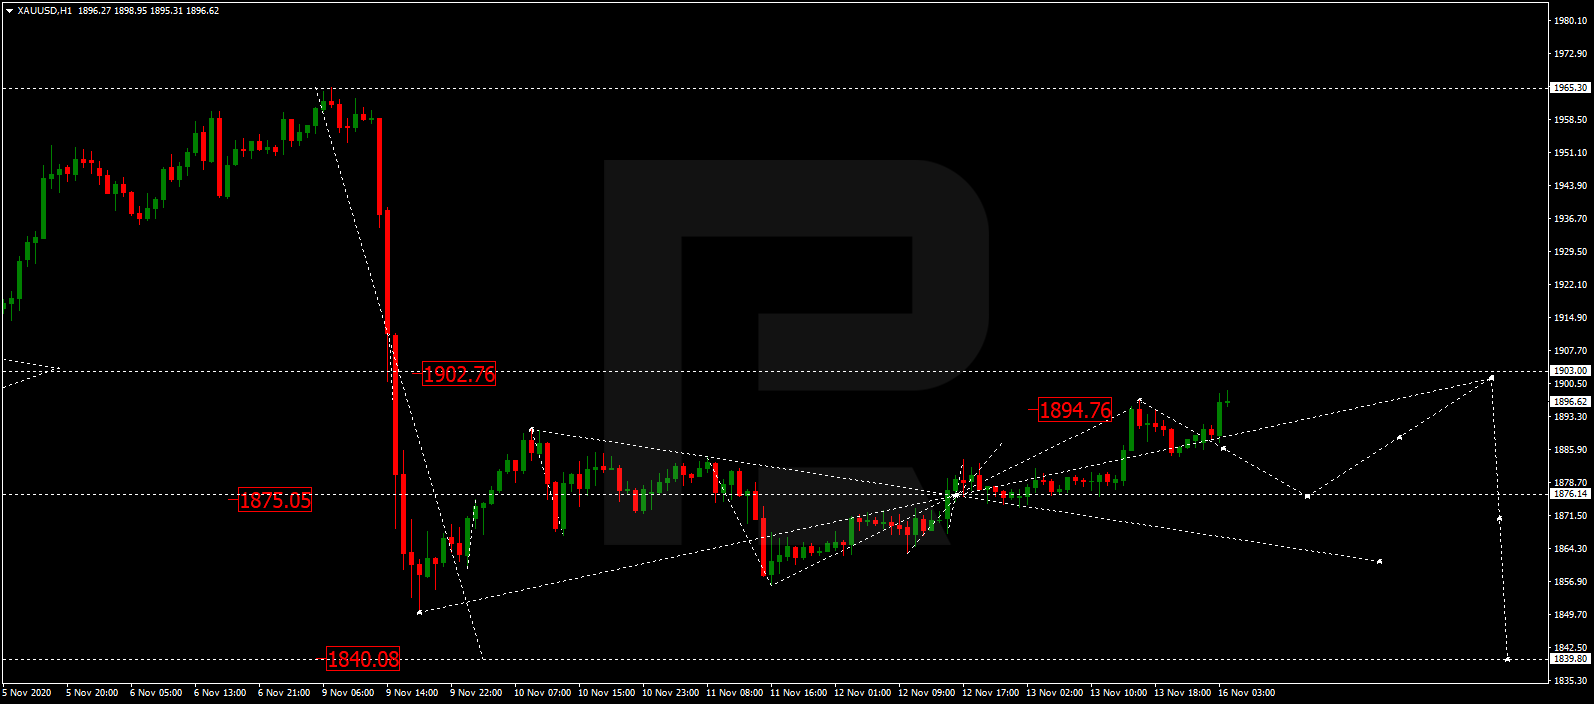
After reaching 1894.76, Gold is consolidating below this level. Today, the metal may form a new descending structure to reach 1876.15 and then resume trading upwards with the target at 1902.76.

GOLD
Risk Warning: the result of previous trading operations do not guarantee the same results in the future

BTCUSD, “Bitcoin vs US Dollar”

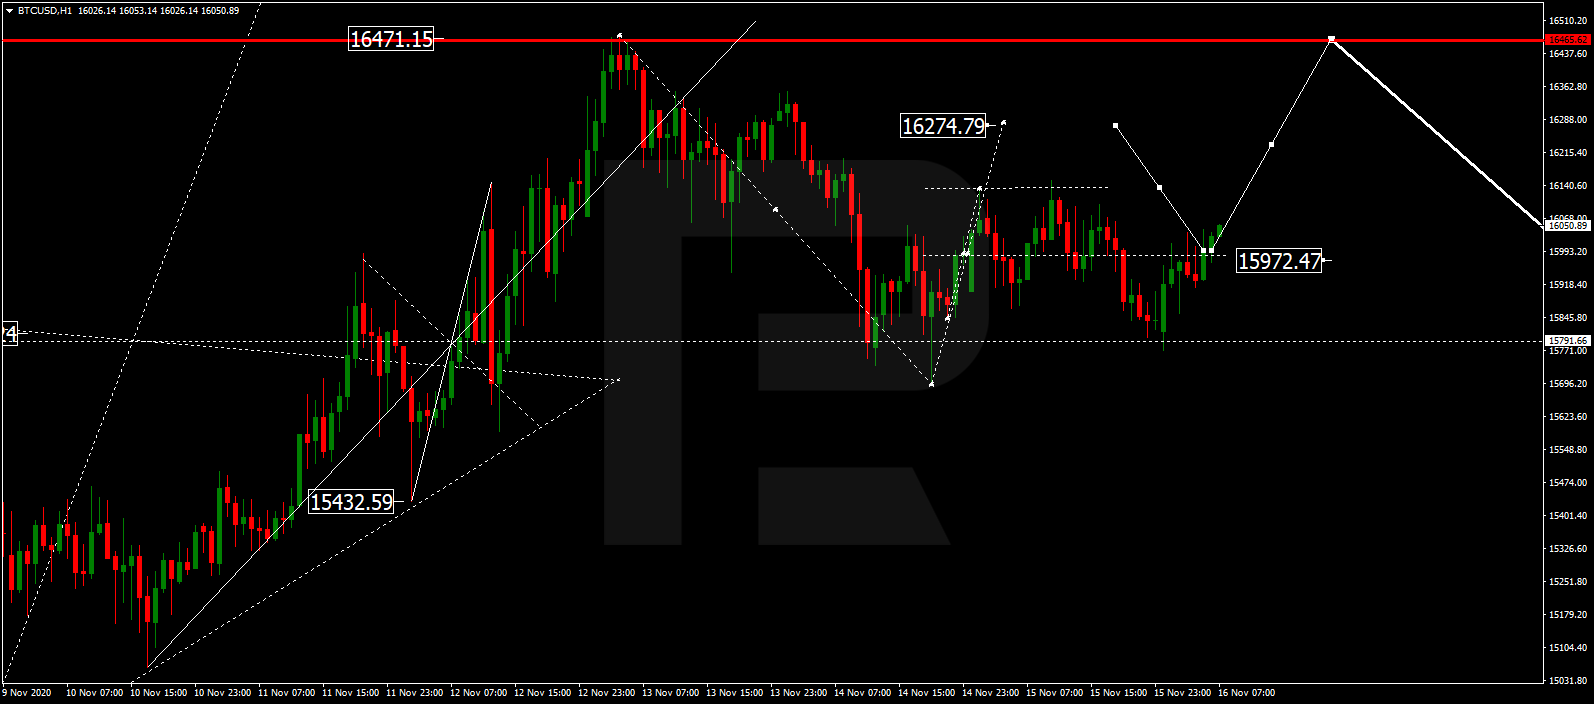
BTCUSD has reached the correctional target at 15700.00; right now, it is growing towards 16275.00. Later, the market may start a new decline to reach 15970.00 and then form one more ascending wave with the target at 16500.00.

BITCOIN
Risk Warning: the result of previous trading operations do not guarantee the same results in the future

S&P 500

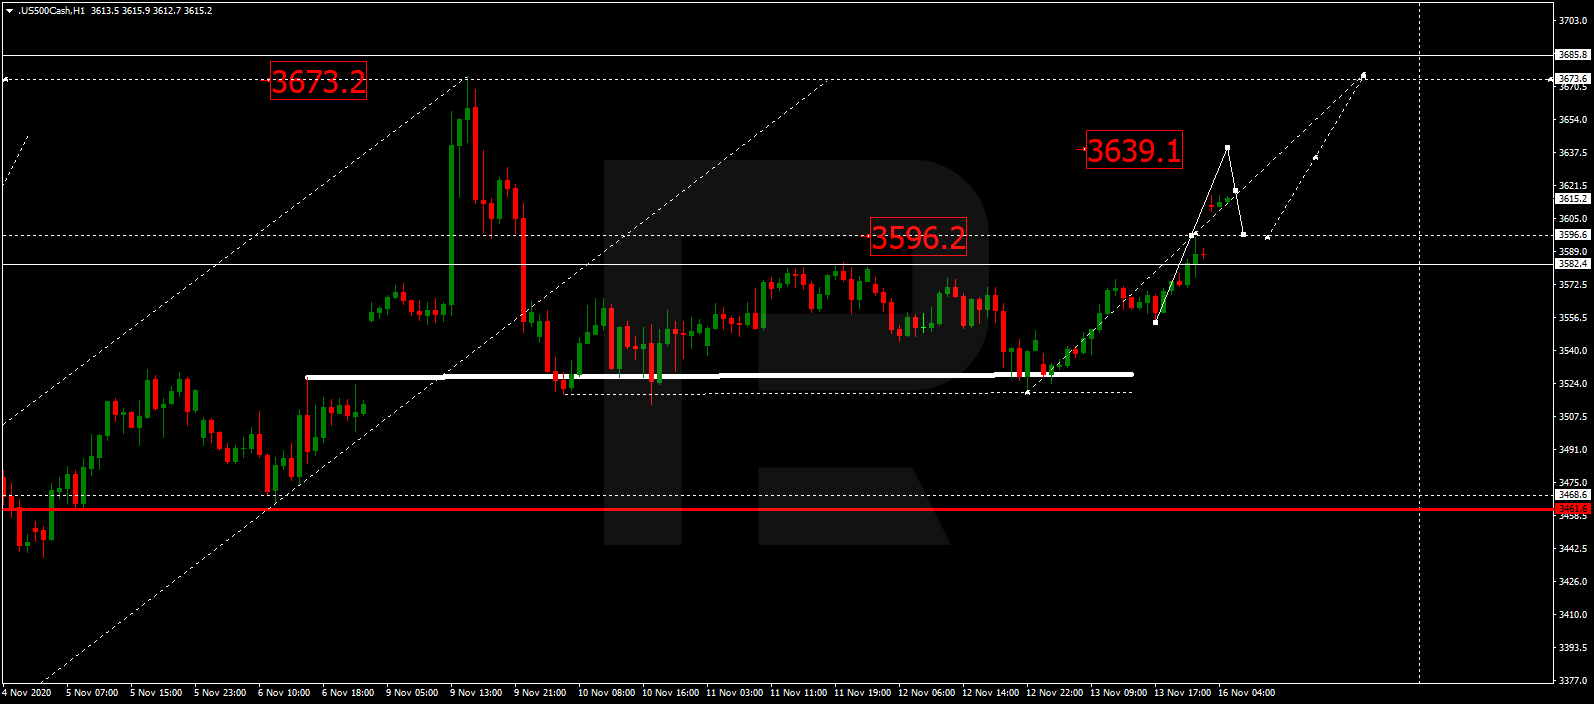
After forming another consolidation range below 3582.4, the S&P index has broken it to the upside. Possibly, the asset may continue growing to reach 3639.1 and then start a new correction towards 3596.6. After that, the instrument may resume trading upwards with the target at 3673.6.

S&P 500

Article By RoboForex.com

Attention!
Forecasts presented in this section only reflect the author’s private opinion and should not be considered as guidance for trading. RoboForex LP bears no responsibility for trading results based on trading recommendations described in these analytical reviews.

Japanese Yen Moving Towards Strengthening

Author: Dmitriy Gurkovskiy, Chief Analyst at RoboForex

On Monday, November 16th, USD/JPY is falling and mainly trading towards 104.55. The Yen is back to strengthening after the world faced a very unpleasant fact: the second wave of the COVID-19 pandemic is spreading much faster than expected, particularly in Europe and the USA.

At the same time, the statistics from Japan are still looking rather weak: the Bank of Japan’s lack of monetary tools of the fiscal stimulus with an immediate and visible effect is making the country’s economy slide toward crisis. For example, the Industrial Production in Japan added 3.9% m/m in September against the expected reading of +4.0% m/m. On YoY, the indicator showed -9.0%, the same as expected.

The Yen is in demand right now as a “safe haven” asset because the coronavirus attack rate during the second wave of the COVID-19 pandemic is much higher than everyone expected earlier. From the fundamental point of view, if all the elements of this equation remain the same, the Yen has chances to get even stronger than it is now.

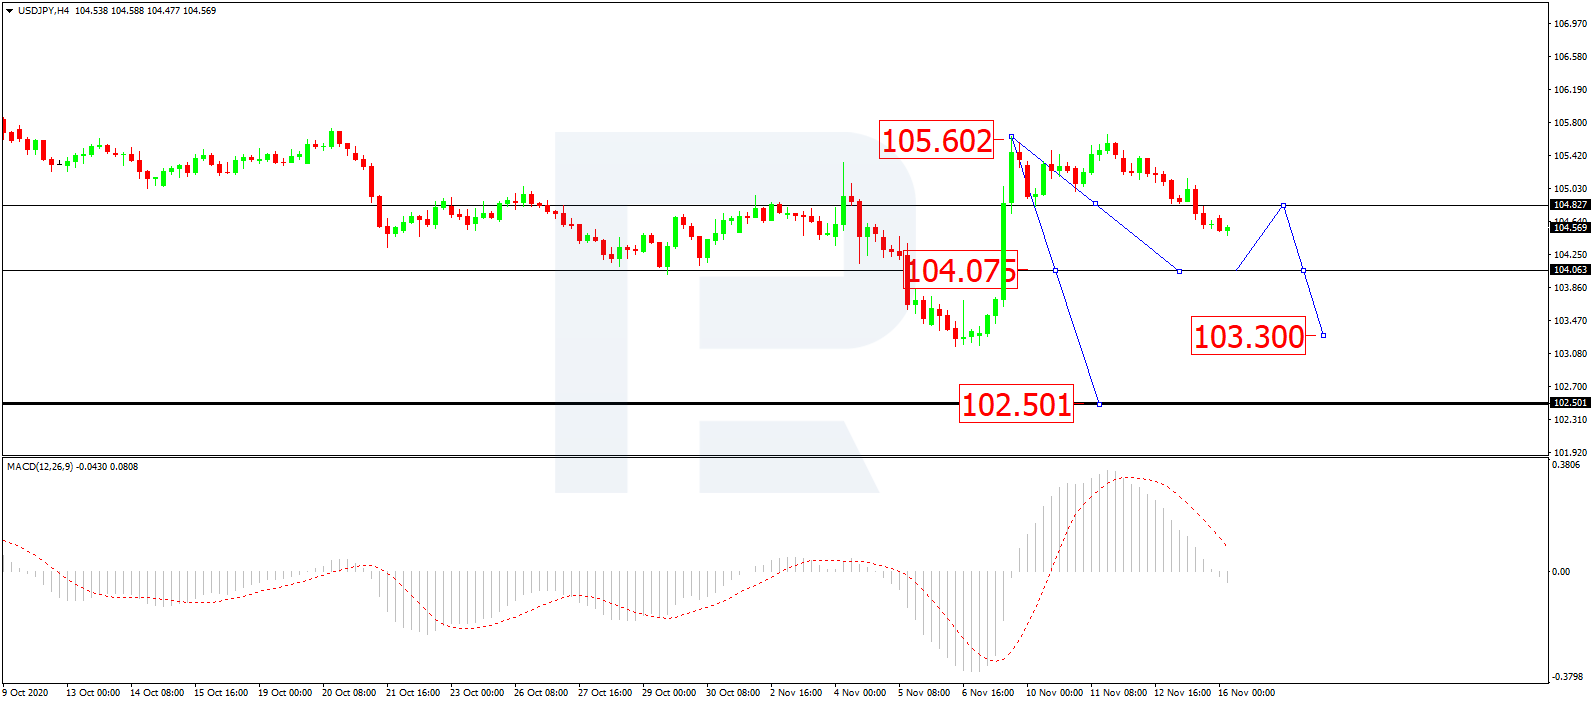
As we can see in the H4 chart, after forming the consolidation range around 104.80 and then breaking it to the downside, USD/JPY is expected to continue forming the fifth descending wave with the target at 102.50; right now, it is forming the first structure of this wave. Possibly, today the pair may fall to reach 104.00 and then start a new correction to return to 104.80. Later, the market may resume trading downwards with the short-term target at 103.30. From the technical point of view, this “bearish” scenario is confirmed by MACD Oscillator: its signal line is falling towards 0. After the line breaks 0, the price may boost its decline.

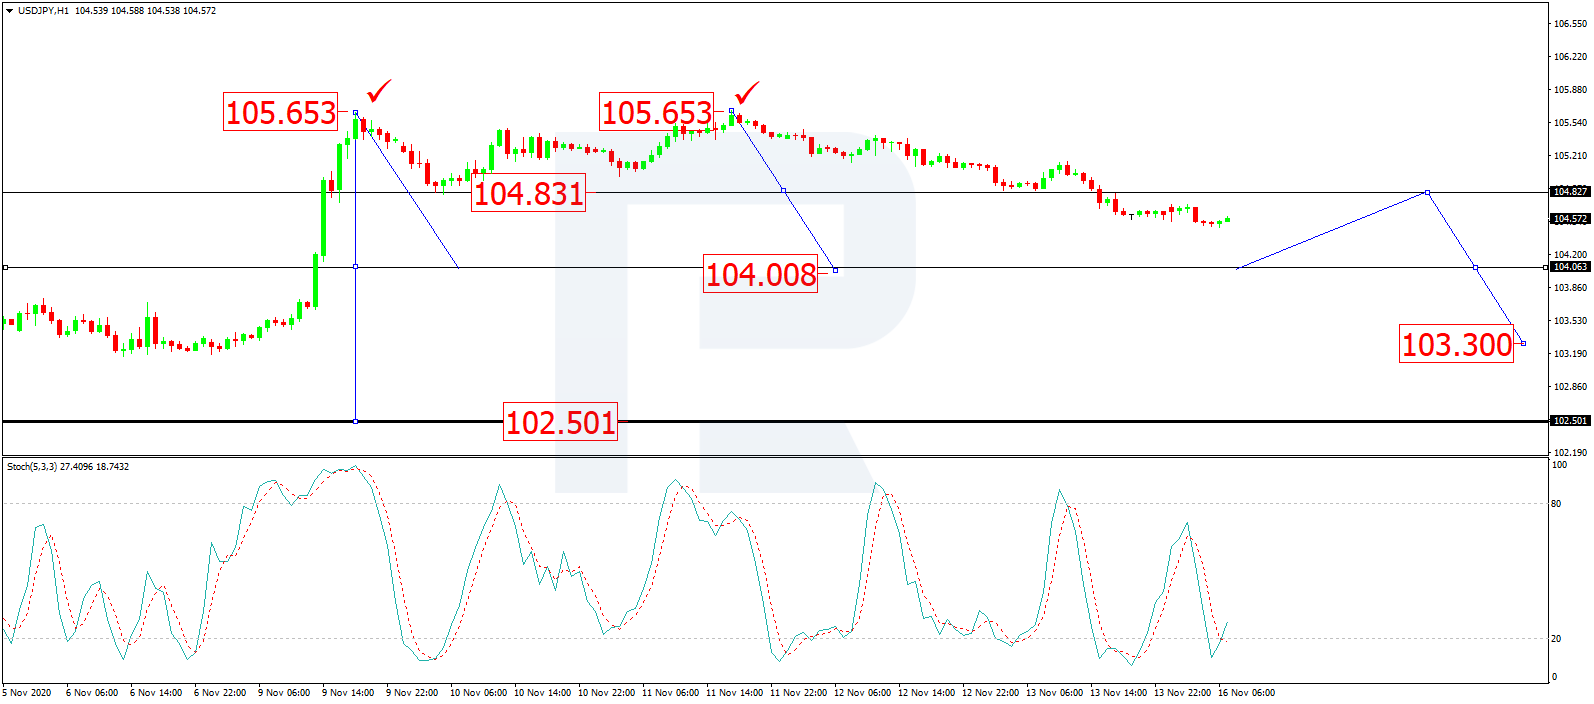
In the H1 chart, after completing the first descending structure at 104.82 along with the correction towards 105.65, USD/JPY has broken the low of the first structure and may later form the third descending structure to break 104.00. After that, the instrument may continue trading downwards with the short-term target at 103.30 and then start a new correction to return to 104.00. From the technical point of view, this scenario is confirmed by Stochastic Oscillator: its signal line is moving not far from 20, thus indicating a correction towards 104.60 on the price chart. The main scenario implies that the line may fall and break 20.

Disclaimer

Any forecasts contained herein are based on the author’s particular opinion. This analysis may not be treated as trading advice. RoboForex bears no responsibility for trading results based on trading recommendations and reviews contained herein.

Where will the market go from here?

By Hussein Sayed, Chief Market Strategist (Gulf & MENA), ForexTime

Last week was a game-changer in global markets. Monday’s announcement from Pfizer and BioNTech of robust results from their late-stage trial for the Covid-19 vaccine outweighed rising cases, hospitalisation and deaths caused by the virus.

Investors are increasingly looking beyond the next few months. With more candidate vaccines likely to show positive results over the upcoming weeks, there is now more certainty that the pandemic will come to an end as soon as next year.

When and how the vaccines will be distributed remains unknown. So far, such details are having little influence on markets that look well beyond the short term. Investors finally see the light at the end of the tunnel, and they are reacting accordingly.

Airlines, hospitality, finance, energy and retail sectors have been among the hardest hit in this pandemic and were the ones that surged the most following the vaccine news. On the other hand, tech stocks that benefited the most from Covid-19 underperformed the broader market last week.

Whether this rotation will continue or prove to be temporary over the short run is debatable. However, longer-term, there still seems to be good value in holding cyclical and economic sensitive stocks. When combining the impact of a vaccine with continued fiscal and monetary support, earnings will possibly grow by double digits in 2021 compared to the tech industry which will struggle to beat their 2020 performance.

Another source of headache for growth stocks is the rising bond yield environment. The higher bond yields go from here, the lower investors will be willing to pay a premium for the growth factor. However, bond yields remain far from their long-term averages and are likely to stay low well into 2021.

While tech firms are set to underperform as life returns to normal, this doesn’t mean investors should dump them entirely from their portfolios. They will continue to play a significant role in diversification, being one of the most capitalised and least leveraged sectors, through generating bumper cash flows. I agree that valuations have become overstretched for many tech stocks, but they remain the ones with the highest earnings growth prospects over the longer term.

News flow over the vaccine, lockdowns and the US Presidential transition are all sources of volatility in the next several weeks. However, this may create good opportunities for buying the dips.

Disclaimer: The content in this article comprises personal opinions and should not be construed as containing personal and/or other investment advice and/or an offer of and/or solicitation for any transactions in financial instruments and/or a guarantee and/or prediction of future performance. ForexTime (FXTM), its affiliates, agents, directors, officers or employees do not guarantee the accuracy, validity, timeliness or completeness, of any information or data made available and assume no liability as to any loss arising from any investment based on the same.


Forex-Time-LogoArticle by ForexTime

ForexTime Ltd (FXTM) is an award winning international online forex broker regulated by CySEC 185/12 www.forextime.com

Stocks rebound while Trump signals possibility of losing elections

By IFCMarkets.com

Top daily news

Equities are solidly higher currently after President Trump twitted possibility of Biden presidential election win for first time but then said he ‘concedes nothing.’ Amazon.com stock rose Friday 0.6%, still underperforming the market, as did Tesla shares down 0.79%.

Forex news

Currency PairChange
EUR USD+0.33%
GBP USD+0.45%
USD JPY-0.22%
The Dollar weakening continues currently. The live dollar index data show the ICE US Dollar index, a measure of the dollar’s strength against a basket of six rival currencies, lost 0.3% Friday as the University of Michigan reported consumer sentiment deteriorated with the sentiment index declining to 77 for November from 81.8 in October. GBP/USD joined EUR/USD’s continued rising Friday despite euro-zone GDP downgrade in second reading for the third quarter to 11.6% over quarter from 11.7% . Both Euro and Pound are higher currently. USD/JPY continued retreating Friday while AUD/USD reversed its declining with the dynamics intact for both pairs currently.

Stock Market news

IndicesChange
Dow Jones Index+0.26%
Nikkei Index+2.05%
Hang Seng Index+0.03%
Futures on US equity benchmarks are up currently ahead of Federal Open Market Committee voting member Richard Clarida speech at 23:00 CET today. President Trump acknowledged Biden presidential election win for first time in a Sunday tweet but then said he would soon file “big cases” challenging the 2020 election results, repeating claim of ‘rigged’ vote. The three main US stock indexes recorded gains ranging from 1% to 1.4% on Friday. European stock indexes are extending gains currently after a bullish session Friday. Asian indexes are rising today led by Nikkei as Japan’s economy expanded above expected 5% over quarter in Q3 when a 4% growth was forecast.

Commodity Market news

CommoditiesChange
Brent Crude Oil+1.53%
WTI Crude+2.43%
Brent is edging higher today while Saudi Aramco said it has hired Goldman Sachs, Citi, HSBC, JPMorgan, Morgan Stanley and other banks ahead of a multi-tranche US dollar-denominated bond issuance amid lower oil prices. Oil prices ended down last session in the light of rising output from Libya. The US oil benchmark West Texas Intermediate (WTI) futures are higher currently after WTI dropped 2.4% Friday. Brent crude lost 1.7% to $42.78 a barrel on Friday.

Gold Market News

MetalsChange
Gold+0.69%
Gold prices are extending gains today. December gold added 0.7% to $1886.20 an ounce on Friday.

Market Analysis provided by IFCMarkets.com

S&P 500, Asian stocks set for new record highs

By Han Tan, Market Analyst, ForexTime

So much for Friday the 13th being unlucky.

The S&P 500 posted a new record high on Friday after advancing 1.36 percent on the day, rewarding equity investors who have stuck it out amid a bumpy ride since it last posted its previous record high on September 2. Over the past two months, investors have weathered a resurgence in the global pandemic, a dip into a technical correction for the S&P 500, and also US elections risk, before being duly rewarded.

Heartened by the Friday’s historic moment, equity bulls are now sending US stock futures popping at the start of the new trading week, which suggests further gains at the US markets’ open on Monday.

In fact, both instances of Friday the 13th in 2020 have produced notable gains for this benchmark US stock index. On the only other Friday the 13th this year, which occurred back in March, the S&P 500 registered a 9.29 percent advance for the day. However, that meant little, given that global equities found themselves amid a careening market, with the S&P 500 plummeting by 34 percent between February 19th and March 23rd this year.

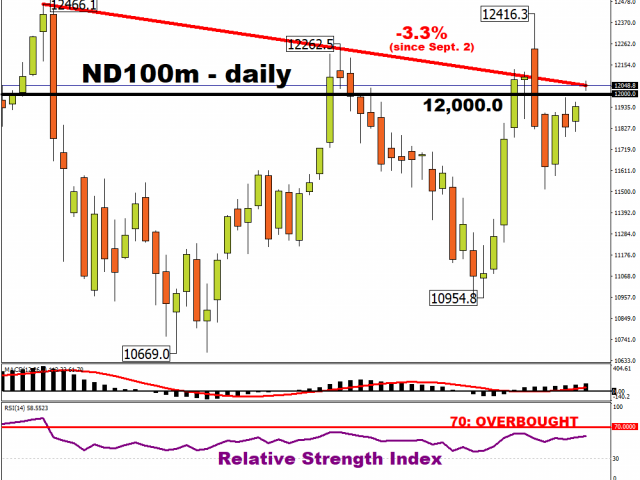
Perhaps what is slightly unusual is that the S&P 500 registered a new record high at a faster pace compared to the Nasdaq 100, considering that tech stocks have been the darling of equity markets around the world since Covid-19 gripped major economies in the first quarter of 2020.

The Nasdaq 100 Minis remain some three percent away from its highest record closing price, registered on September 2nd. Still, the index appears to be narrowing the gap, and has more room to climb before reaching overbought levels as per its 14-day relative strength index.

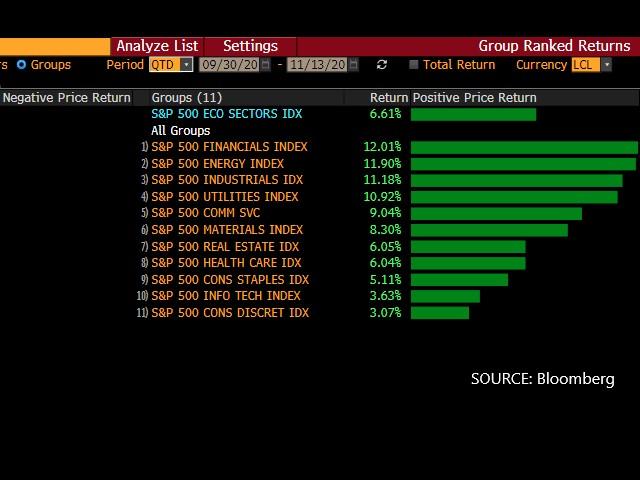
The discrepancy between the S&P 500 and the tech-heavy index indicates that investors are now getting more comfortable pouring money back into economic sectors that have been hit-hard by the pandemic, such as energy, financial, and industrial stocks, which are the three best-performing sectors on the S&P 500 so far this quarter.

Still, the FXTM Trader’s Sentiments remain net long on both the US Tech 100 (Mini) and the US SPX 500 (Mini).


From a fundamental perspective, global investors were given a slate of new positive headlines to cheer.

China’s on Monday reported a better-than-expected 6.9 percent advance in last month’s industrial production data, while October’s retail sales grew at a healthy 4.3 percent compared to the same month last year. Investments into properties and fixed assets also exceeded market expectations. China’s economic performance is buffering the region’s recovery prospects, while propelling the MSCI Asia Pacific index to new record highs.

Besides the abating of US election risk, pandemic advisers to US President-elect Joe Biden have publicly opposed a nationwide lockdown in the world’s largest economy. Also over the weekend, major global economies such as China, Japan, and ASEAN nations signed the world’s largest regional free-trade agreement. Such developments bode well for the global economic recovery, and in turn should feed into further gains for equities.

Still, the seasoned investor would know that not everything is plain sailing in global markets, and significant downside risks remain, with Covid-19 still demonstrating its grip on major Western economies, coupled with Brexit negotiations still rumbling along. If 2020 has taught us anything, is to guard ourselves from complacency, as risk sentiment could be derailed at any time by the unexpected.


Disclaimer: The content in this article comprises personal opinions and should not be construed as containing personal and/or other investment advice and/or an offer of and/or solicitation for any transactions in financial instruments and/or a guarantee and/or prediction of future performance. ForexTime (FXTM), its affiliates, agents, directors, officers or employees do not guarantee the accuracy, validity, timeliness or completeness, of any information or data made available and assume no liability as to any loss arising from any investment based on the same.


Forex-Time-LogoArticle by ForexTime

ForexTime Ltd (FXTM) is an award winning international online forex broker regulated by CySEC 185/12 www.forextime.com

DAX with weekly close above 13,000 points – next stop: All Time High?

By Admiral Markets

Economic Events November 16

Source: Economic Events November 16, 2020 – Admiral Markets Forex Calendar

In our last technical piece for the DAX30, last Monday, we were quite reserved in regards to further bullishness over the course of last week.

While we wrote in the last paragraph:

[…] If bulls, on the other hand, stay in control and push the DAX30 above 12,600 points, a continued run up to 12,700 points would become an option, above which, a run to above 13,000 points would then become an option. […]

We didn’t really anticipate what would follow right on Monday: after Pfizer/BioNTech announced that they were on their way to a Covid-19 vaccine which is said to be effective in over 90% of the cases in preventing the virus. The German index exploded on the upside, pushing significantly above 13,000 points, only falling short of an attack on the region around 12,250/300 points.

While the German index stabilized from Tuesday to Friday, the short attempt to push the DAX30 back below the 13,000 point mark on Thursday failed and was quickly bought back, leaving the German index to close the week above 13,000 points.

Should the DAX30 see another attack at the 13,000 point level, the uptrend of last week could be considered broken on the H1, leaving the German index vulnerable to a run down to 12,880/900 points. If it breaks below that level, a move to as low as 12,600 points will become an option, erasing all of the recent “Covid-19 vaccine hope” gains.

If the German index, on the other hand, breaks above 13,300 points, the focus will quickly switch to the September highs at around 13,450 points. In fact, this would be the last stop-over before bulls go for an attack on the All Time Highs around 13,800 points:

DAX30 CFD Hourly chart

Source: Admiral Markets MT5 with MT5SE Add-on DAX30 CFD Hourly chart (between October 26, 2020, to November 13, 2020). Accessed: November 13, 2020, at 10:00 PM GMT

DAX30 CFD Daily chart

Source: Admiral Markets MT5 with MT5SE Add-on DAX30 CFD Daily chart (from June 24, 2019, to November 13, 2020). Accessed: November 13, 2020, at 10:00 PM GMT. Please note: Past performance is not a reliable indicator of future results, or future performance.

In 2015, the value of the DAX30 CFD increased by 9.56%, in 2016, it increased by 6.87%, in 2017, it increased by 12.51%, in 2018, it fell by 18.26%, and in 2019, it increased by 26.44% meaning that in five years, it was up by 34.2%.

Check out Admiral Markets’ most competitive conditions on the DAX30 CFD and start trading on the DAX30 CFD with a low 0.8 point spread offering during the main Xetra trading hours.

Discover the world’s #1 multi-asset platform

Admiral Markets offers professional traders the ability to trade with MetaTrader 5, allowing you to experience trading at a significantly higher, more rewarding level than with MetaTrader 4. Experience benefits such as the addition of the Market Heat Map, so you can compare various currency pairs to see which ones might be lucrative investments, access real-time trading data, and so much more. Click the banner below to start your FREE download of MT5!

Trade With MetaTrader 5

Disclaimer: The given data provides additional information regarding all analysis, estimates, prognosis, forecasts or other similar assessments or information (hereinafter “Analysis”) published on the website of Admiral Markets. Before making any investment decisions please pay close attention to the following:

  1. This is a marketing communication. The analysis is published for informative purposes only and is in no way to be construed as investment advice or recommendation. It has not been prepared in accordance with legal requirements designed to promote the independence of investment research, and that it is not subject to any prohibition on dealing ahead of the dissemination of investment research.
  2. Any investment decision is made by each client alone whereas Admiral Markets shall not be responsible for any loss or damage arising from any such decision, whether or not based on the Analysis.
  3. Each of the Analysis is prepared by an independent analyst (Jens Klatt, Professional Trader and Analyst, hereinafter “Author”) based on the Author’s personal estimations.
  4. To ensure that the interests of the clients would be protected and objectivity of the Analysis would not be damaged Admiral Markets has established relevant internal procedures for prevention and management of conflicts of interest.
  5. Whilst every reasonable effort is taken to ensure that all sources of the Analysis are reliable and that all information is presented, as much as possible, in an understandable, timely, precise and complete manner, Admiral Markets does not guarantee the accuracy or completeness of any information contained within the Analysis. The presented figures that refer to any past performance is not a reliable indicator of future results.
  6. The contents of the Analysis should not be construed as an express or implied promise, guarantee or implication by Admiral Markets that the client shall profit from the strategies therein or that losses in connection therewith may or shall be limited.
  7. Any kind of previous or modelled performance of financial instruments indicated within the Publication should not be construed as an express or implied promise, guarantee or implication by Admiral Markets for any future performance. The value of the financial instrument may both increase and decrease and the preservation of the asset value is not guaranteed.
  8. The projections included in the Analysis may be subject to additional fees, taxes or other charges, depending on the subject of the Publication. The price list applicable to the services provided by Admiral Markets is publicly available from the website of Admiral Markets.
  9. Leveraged products (including contracts for difference) are speculative in nature and may result in losses or profit. Before you start trading, you should make sure that you understand all the risks.

By Admiral Markets

Gold’s Momentous Rally From 2000 Compared To SPY & QQQ – Part I

By TheTechnicalTraders 

– My research team and I went off on a wild tangent trying to identify how the markets could react to the recent spike in price activity on Monday, November 9, 2020.  This is the day that Pfizer announced a 90% effective rate with its new COVID-19 vaccine, causing the US stock market to skyrocket higher before the opening bell in New York. As with most pop-and-drops, this incredible upside spike trailed lower for the remainder of the trading day.  My research team was curious if this type of setup presented any real future outcome or trends.  To this end, we focused on the QQQ and the SPY in relationship to Gold.

9 to 9.5 year Gold Depreciation Cycle Ended in 2018 – what’s next?

Gold has been and continues to be a store of value for many around the world. At some times in history, Gold becomes undervalued in comparison to other assets (like stocks, real estate, and other tangible assets).  At other times, Gold becomes more highly valued in comparison to other assets.  This cycle has taken place throughout hundreds of years of history, and is rooted in the changing perceptions of market participants regarding “what/where is true value in the markets”.

When other assets are skyrocketing higher, Gold is out of favor in terms of real demand.  It may still be moving higher in value, but as long as other assets seem to be increasing in value faster than Gold, demand for Gold will diminish.  When most other assets enter a time of great concern or devaluation, Gold and Precious Metals usually begin to see stronger demand as the ratio between Gold prices and more traditional investment assets may be near extremes.

Many precious metals investors rely on the Gold to Silver ratio to measure how fast or slow Gold is appreciating or depreciating compared to Silver.  This ratio can often be used to help pinpoint disparities between real price valuation levels.  In our example, today, we’re using the ratio of the QQQ and SPY to Gold, which asseses more traditional investment asset values in comparison to Gold.

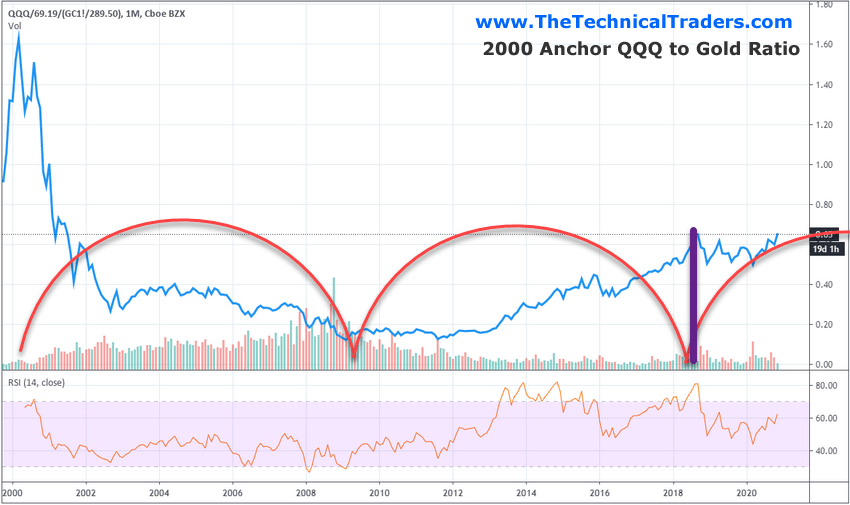
The first Monthly QQQ 2000 Anchor to Gold chart, below, attempts to highlight the past and current ratio levels based on an anchor price level starting on January 1, 2000.  The purpose of this ratio chart is to understand how the price advance in the QQQ over time relates to the price advance in Gold.  The higher the BLUE ratio level, the more valued QQQ is compared to Gold.

The first thing that caught our attention was the very high valuation levels in early 2000.  This suggests that Gold was completely ignored in the late stages of the DOT COM rally when technology and other assets were flying high.  As the DOT COM bubble burst, one would expect the ratio to decline over time.  However, in this case, the ratio continued to decline over a 9 to 9.5 year period – reaching a low point in 2009 (the Global Financial Crisis lows).  This downward trend in the QQQ to Gold 2000 anchor ratio suggests that while the QQQ rotated up and down in a broad sideways trend, Gold continued to appreciate in value.  Throughout this time, from 2000 to 2009, Gold rallied over 215% (from $289.50 to over $931.00).  This appreciation in Gold translated into the declines in the QQQ to Gold ratio on this chart above.

It was only after 2013 that the QQQ to Gold 2000 anchor chart began to rise again.  Interestingly, this really began to take place after the 2011 peak in Gold prices (near $1923.70) and after the US economy really began a more organic growth phase prompted by multiple US Fed QE efforts.  We can see from the chart below that the current peak levels (near 0.60) on this ratio chart are still well below the 1.60 ratio levels from 2000.  Although this may appear to be a weaker ratio trend, remember this chart anchors everything to January 1, 2000 price points.  So this chart reflects the QQQ to Gold ratio based on the origination ratio that existed on January 1, 2000.

COMPARISON OF QQQ, SPY AGAINST GOLD

This next ratio chart below shows the incredible rally in Gold compared to the QQQ and the SPY since the 2000 anchor point.  It is important to understand that these ratios are based on the January 1, 2000 anchor price level and represent the comparative price appreciation/depreciation of these assets from that anchor point.

You can see that the QQQ and SPY were both well under the 1.0 ratio level for much of 2001 through 2013.  This suggests that these assets failed to rally above the 2000 anchor price level throughout this time.  Gold also experienced a brief decline in price below the 1.0 level in early 2000 through 2003, but it quickly started rallying after that point and has continued to extend higher recently.

Be sure to sign up for our free market trend analysis and signals now so you don’t miss our next special report!

When we compare the chart below to the one above, we can see that the rally in gold has extended quite a bit further than the rally in the QQQ and the SPY since 2000.  Yet, this brings up an interesting question related to the cycles our research team has identified.  Have we reached a peak level in the QQQ and SPY in relationship to the appreciation of Gold?  Are we entering a new cycle where Gold will continue to appreciate higher compared to the QQQ and the SPY – attempting to recreate a nromalized ratio?

If our research team’s interpretation of this data is correct, the rally in Gold since the 2000 anchor point suggests a new momentum base has established in Gold after the 2011 peak price levels.  This new momentum base, if our cycle research is accurate, suggests a broad market peak in equity/stock assets is setting up another 9 to 9.5 year precious metals appreciation cycle that started near 2019.  This could be an incredible opportunity for skilled technical traders over the next 8+ years if we understand what to expect based on these cycles/trends.

In this first part of our two-part Gold series this weekend, we have illustrated the longer-term cycle patterns that originated from an anchor point in 2000 and the real appreciation in Gold compared to other assets.  In Part II, we will share incredible new information that suggests we are near another 2000-like peak in equities/stocks, suggesting another broad metals rally is just starting and may last another 8+ years.

This does not mean that stocks will collapse or some external event won’t destroy the stock market valuations or the thesis presented.  We are merely suggesting that Metals have established a base level (near 2015) while traders have focused on the equities/stocks recently and ignored metals.  This rally in stocks/equities suggests that metals have under-appreciated compared to stocks/equities. This disparity in price valuations also suggests that either metals will rally to attempt to close the price disparity or that equities will decline or trade sideways while metals attempt to close the gap.

Overall, this is an incredible longer-term cycle setup that traders must keep in focus over the next few years. If this type of cycle repeats like it did after 2000, then Gold may be trading above $5500 per ounce within the next 2 to 3 years and may peak at levels above $10,000 before the peak is reached.

Learn how my team and I can help you find and execute better trades.  We can help grow your trading account with our Swing Trading service, and also protect your investment account with our long-term market signals service. Visit TheTechnicalTraders.com today to earn more. If you trade options or are looking to learn more about options trading then please click here to sign up for information on the upcoming launch of our new options courses and our new options signals newsletter service.

Chris Vermeulen
Chief Market Strategist
www.TheTechnicalTraders.com

NOTICE AND DISCLAIMER: Our free research does not constitute a trade recommendation or solicitation for readers to take any action regarding this research.  It is provided for educational and informational purposes only – read our FULL DISCLAIMER here.