How might the Fed’s decision affect US markets on Wednesday?

By Han Tan, Market Analyst, ForexTime

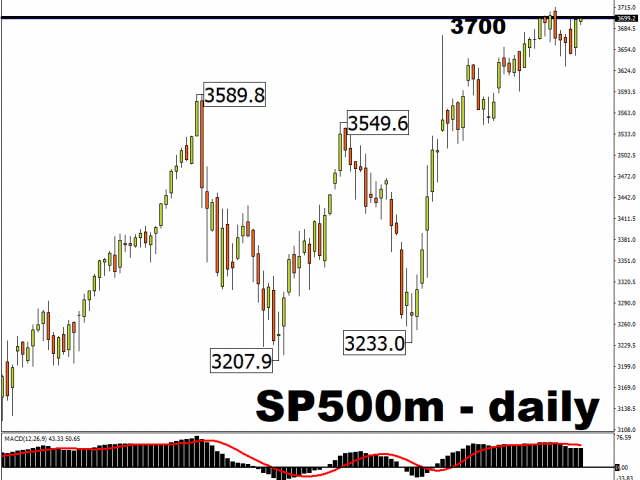
US equity futures are holding steady ahead of the Fed’s policy decision, after benchmark indices returned to positive ways on Tuesday. The S&P 500 ended a run of four consecutive days of losses, which had been its longest losing stretch since September.

The 3700 level remains a tough barrier to break for the time being. However, given the tailwinds in play, it should only be a matter of time before the bulls can attain critical mass to push this benchmark to new record highs.

Risk sentiment has been cheered on by the same themes that have dominated markets in recent months.

  • US fiscal stimulus

Democrats and Republicans appear to be inching towards a deal for the next US fiscal stimulus package. However, the current proposal on the table is valued at US$748 billion, which is diluted from the previous versions that once had a headline grabbing figure of US$2.2 trillion. Still, the US economy could do with any amount of financial aid from the government right about now, given the waning momentum in its recovery.

  • Positive developments on Covid-19 vaccine

First, it was Pfizer. Now, it’s Moderna’s turn. US regulators on Tuesday declared Moderna’s Covid-19 vaccine to be safe and effective, which paves the way for its emergency use authorization. With more vaccines blanketing the US, the hope is that a more positive health response from the population can build a more solid foundation for the US economy to recover.

Why does the Fed meeting matter to investors?

Next up, global investors will be keeping a close watch on the outcome from the Fed’s two-day meeting, which began on Tuesday. The Federal Open Market Committee (FOMC) is due to announce their policy decision later Wednesday (early Thursday at 3:00AM Hong Kong time).

The Fed is highly unlikely to make any adjustments to its benchmark rates, and is expected to keep them at rock-bottom levels until 2023. Instead, what investors want to know from this meeting is how much policy support can be expected out of the US central bank, in what form, and how soon.

Which assets could be affected by the Fed’s statements today?

  • US stocks Hints of more incoming monetary policy support (asset purchases) could mean further gains for stocks.
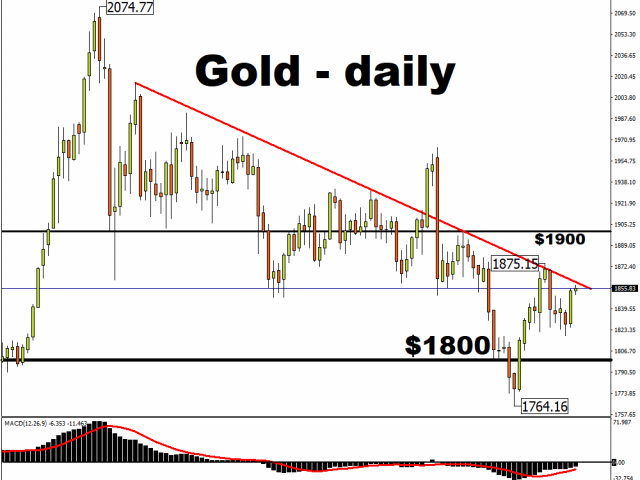
  • Gold/Dollar The Fed is likely to point to weaker demand having a drag on US inflationary pressures. Such commentary may offer support for the beleaguered US Dollar, while dulling Gold’s shine as a hedge against faster inflation.


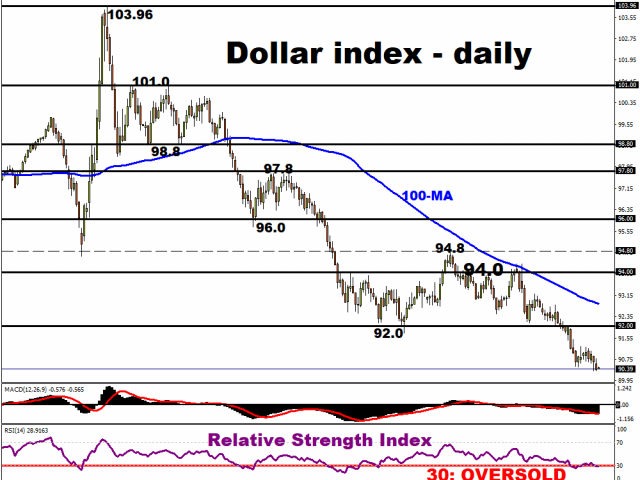
The Dollar index (DXY) is also ripe for a pullback, with its 14-day relative strength index already reaching oversold levels. A pullback of note in the DXY could heap more downward pressure on Bullion prices.

Disclaimer: The content in this article comprises personal opinions and should not be construed as containing personal and/or other investment advice and/or an offer of and/or solicitation for any transactions in financial instruments and/or a guarantee and/or prediction of future performance. ForexTime (FXTM), its affiliates, agents, directors, officers or employees do not guarantee the accuracy, validity, timeliness or completeness, of any information or data made available and assume no liability as to any loss arising from any investment based on the same.


Forex-Time-LogoArticle by ForexTime

ForexTime Ltd (FXTM) is an award winning international online forex broker regulated by CySEC 185/12 www.forextime.com

Should You Prepare Your Portfolio for ‘The Roaring 2020s’?

After all, market valuation measures such as PE have reached an extreme

By Elliott Wave International

Well, the answer posed by the question in the title is a resounding “yes!” — according to the British financial magazine, MoneyWeek.

The cover of the Dec. 4 issue of the magazine is titled “The Roaring 2020s, Prepare Your Portfolio for a Boom.” An image of Janet Yellen is front and center. Of course, she’s the former Federal Reserve chair and the reported pick for Treasury Secretary in a new administration. She’s dressed in a 1920s party outfit and looks very festive.

Yet, stock market valuations are different when you compare the start of the 1920s with the 2020s in the U.S. Here’s a quote from the December Elliott Wave Financial Forecast, a monthly publication which provides analysis of major U.S. financial markets:

As the bull market began in August 1921, the S&P 500 price-to-earnings ratio was 14. In September 1926, three years before the 1929 peak, the market’s p/e ratio was 10.72, even more subdued than in 1921. By the time that September 1929 arrived, the market’s p/e ratio had jumped to 20.17. At the February high this year, the S&P 500’s p/e ratio was 25.43. By December 1, it was an even higher 36.67. Other market valuation measures are just as extreme.

Even so, the extreme optimism conveyed on the MoneyWeek cover is also reflected in a recent survey of market strategists. Here’s a quote from a Dec. 8 CNBC article:

A majority of analysts surveyed by CNBC expect [an] 8%-22% upside for the S&P 500 in 2021.

There are other signs of extreme bullish sentiment.

Here’s just one of them as we return to the December Elliott Wave Financial Forecast with this chart and commentary:

OptionsTraders

The option markets offer further evidence of intense speculation. The 8-day CBOE equity put/call ratio declined to .40 on Wednesday, the most extreme level of call buying to put buying in over 20 years. The last time the 8-day p/c ratio was lower was July 18, 2000, at the top of the initial rebound in the NASDAQ’s bear market from March 2000 to October 2002.

Sentiment measures are just one way to take the market’s temperature. Another, more immediate way to look directly at the patterns of investor psychology is reflected in price charts.

That’s what our December Elliott Wave Financial Forecast does for you: Namely, it describes how current sentiment measures align with the stock market’s Elliott wave pattern.

So you get a complete, and immediate market snapshot — and a clear idea as to what’s likely next.

This analysis will help you ascertain whether stocks are near the start of a bull market (like the early 1920s) or much further down the road.

Get the Elliott wave insights you need to know by joining our free 5-day event End-of-Year Market View “From 30,000 Feet.

Each day through December 18, you get an excerpt from our 10-page December 2020 Elliott Wave Financial Forecast. By Friday, you will get the entire issue at no charge.

This article was syndicated by Elliott Wave International and was originally published under the headline Should You Prepare Your Portfolio for ‘The Roaring 2020s’?. EWI is the world’s largest market forecasting firm. Its staff of full-time analysts led by Chartered Market Technician Robert Prechter provides 24-hour-a-day market analysis to institutional and private investors around the world.

Survey Results: COVID-19 Impact on the U.S. Real Estate Industry

The COVID-19 pandemic has created an economic downturn that is unique in the experience of today’s business owners and government officials.

A nationwide survey of real estate professionals conducted by RealEstateBees.com shows the complexity of the issue in the U.S. real estate markets.

The survey was conducted in all 50 states and the District of Columbia. Professionals from various categories of real estate sales, investment, and services were included for a closeup view of the effects of COVID-19.

A Different Kind of Economic Cycle

Economic downturns that are caused solely by market activity are expected periodically. Prudent owners can plan for these times when their business is slow.

The unexpectedness of the pandemic, and the personal safety concerns caused by it, have presented a challenge no one has ever seen.

Survey respondents point out that the timing of the pandemic could not have been worse for their business. Residential real estate sales are strongest in the spring.

Across the country, sales in January and February were up from the previous year. As the level of danger became known, and precautions and restrictions were put in place, sales dropped steeply.

Survey comments relay concerns from homeowners about having people from outside walking through their homes. This was cited by brokerage owners and agents as being the primary cause of a drop in homes being listed for sale.

Sales agents also experienced unique expenses that were caused by COVID-19. Buyer’s agents have had to purchase Personal Protection Equipment (PPEs) for themselves and their clients. Listing agents have bought PPEs to place in the homes for sale for buyers who came unprepared.

Agents are also increasing their expenses for technology such as virtual tours.

It’s obvious that some firms and agents were clearly more prepared than others. Many said that if they had known that this was coming, they would have worked harder to maximize their business and to improve their technology.

The firms and agents who have held up the best through the pandemic were already doing those things.

New home sales were slowed as well. Sales staff were not allowed to open their model homes. Later, they were only allowed to have pre-scheduled appointments. No walk-in traffic.

Commercial investment properties brought weaker returns as retail businesses were closed. The value of office leases was put in doubt as office tenants had to send their workers home.

Perhaps forever.

Regional Differences in Economic Impact From COVID-19

Traditional regional differences and inconsistent COVID-19 policies by the states had a strong effect on their respective markets.

Some states said that the real estate profession is non-essential. Brokers were not allowed to leave their homes to conduct business. In other states, brokers were allowed to work outside the home.

Initially, most states would not allow actual showings. Potential buyers had to go through a virtual tour of the home. Home sales slowed as a result. The sooner that the state allowed in-person showings the quicker the market rebounded.

Brokerage owners reported that some states continued to confine showings to one per day per home after others had dropped similar orders.

The stronger markets in the south and west portions of the US reported that property values have held up well. Those surveyed in the northeast and midwest aren’t having the same experience.

Vacation and resort areas were shut down entirely. Investors who own those properties reported suffering significant losses. At what would have been the height of the rental season, that income stopped altogether.

On the other hand, places with a strong concentration of military bases have a regular supply of families moving in and out of the area. That was a strong factor in helping those markets to remain active.

Health and Safety

The comments heard most frequently in the survey had to do with personal safety concerns. Sales agents for all kinds of property were hesitant to expose themselves to the virus by going into both public and private places.

According to the National Association of Realtors, there was already a shortage of housing inventory before the coronavirus hit the US. This was made worse as homeowners decided to postpone listing their homes for sale for safety reasons.

When the pandemic response came in the spring, the housing inventory fell while spring buyers increased the demand. In some parts of the country, homes are selling in days for full price or more. This is keeping property values in those areas at a strong level.

Appraisers are having difficulty with the situation, both from the personal safety standpoint and in maintaining professional standards.

Some sellers are reported to be hesitant to let appraisers and inspectors into their homes. In some areas, appraisers have resorted to having homeowners fill out a form that describes the interior of their house. They have to use caution when placing a value on improvements that they haven’t seen for themselves.

Home inspectors’ reputations are built on the thoroughness of their work. Not being allowed into a seller’s home means that they cannot give an opinion on the majority of the working systems of the home including electrical, plumbing, HVAC, the roof, etc.

The RealEstateBees.com survey reported that in some cases, buyers had to decide whether or not to basically buy a property as-is.

Real Estate schools and trainers have been stopped by their states from holding in-person classes, which is a large part of their business.

Schools in most states were already allowed to give some continuing education classes online. Those states’ boards or commissions quickly moved to give schools permission to hold the remaining classes virtually using platforms such as Zoom.

Pre-Licensing classes for new agents were heavily affected. The students who were able to finish the required classes and take their state exams have had trouble finding testing sites that are open.

Trainers and coaches stated that their classes were not only affected by health issues but also because agents have had to cut costs. They believe that this has had the biggest negative impact on those new agents who need the most encouragement right now.

Professional photographers have also seen their business drop because of safety concerns.

And, the people who are hired to professionally stage a seller’s home for listing have seen their business “virtually” disappear. It’s hard for them to do their job without going into the home.

Commercial Real Estate Affected

Commercial real estate was also hit by the pandemic. Broker-developers and investors who were surveyed gave several reasons for this.

Retail businesses were closed completely. Leasing in new retail projects stopped and some leases already signed were terminated.

When government stimulus funds expire, many retail tenants are expected to have trouble making their rent payments. This has retail tenants, including important anchor tenants, seeking to renegotiate their lease terms. This makes investors hesitant to buy existing retail properties.

The fact that workers in all industries are being forced to work from home has caused a lot of uncertainty in the office property markets.

Major companies could come to the conclusion that they don’t need as much office space as before. Investors who were surveyed believe that this would cause a long term change in the need for that type of asset.

Medical office space has also been impacted by COVID-19. Elective surgeries and procedures have not been allowed which has impacted hospital and doctors’ cash flow tremendously.

One southeastern US medical system has estimated its loss so far to be $700 million. They withdrew from 5 medical office projects this spring.

Multi-family construction didn’t seem to slow down during this time. The opinion of the commercial brokers and investors in the survey was that most of those were projects that had already gotten their permits and funding before the pandemic.

With the uncertainty over the future viability of retail and office tenants, investors are cautious about buying existing commercial properties. The prevailing opinion of the commercial professionals in the survey was that values may very well come down in the next few years.

After several years of strong values and low cap rates, investors worry that they could wind up buying high and selling low.

Lenders have tightened their underwriting criteria on riskier loan categories, including many investment properties — shares Sam McGrath, Lead Commercial Real Estate Analyst from a national commercial real estate investing company PropertyCashin — this has made it difficult or impossible for some projects to go forward.

Private and hard money lenders who leverage their cash with borrowed funds had to restrict their own lending policies as well.

The restriction of capital is also seen in the area of national residential property investors. The number of iBuyers making offers on homes has dropped precipitously.

Technology

A consistent theme throughout the survey is the impact of technology. Regardless of the profession, those in the industry who were up to date on their technology systems and platforms have held up the best.

Investors who bought residential properties around the country were already used to viewing prospective investment properties virtually. Virtual showings are now the norm for homeowners as well.

Having to work from home hasn’t impacted real estate agents very much. Agents have always worked mostly out of the office, says one of the survey participants — Kristina Morales, a real estate agent licensed in the states of Ohio, California, and Texas.

Kristina continues: they typically would come to the office to print transaction documents and, once signed, deliver them back to the firm for storage. Now, most of these documents are signed and stored electronically, which reduces the unnecessary back-and forth with papers.

Today, agents mostly report to the office for staff meetings and training. Otherwise, they are out of the office more than they are there.

Brokerage firms need to regularly go over important policies and procedures of the firm in training sessions. Staff meetings also provide important market information and regulatory changes.

Brokerages who had not already done so are now spending time and money adding the technology to hold their office meetings virtually with their agents.

Appraisers in some states report that they are focused on adding the technology they need to do “desktop appraisals”. These are appraisals that are done without any inspection of the property.

All the information needed for a “desktop appraisal” is pulled from public records, the multiple listing service, Google Maps, etc. These are full appraisal reports, not limited reports like a Broker Price Opinion (BPO).

Opportunities

As with ordinary economic downturns, weaker agents and firms are being culled from the profession. This creates more listings and sales for brokerage firms and agents who were more productive and better prepared.

It’s likely that mortgage interest rates will remain low. Residential professionals were optimistic that this would continue and will help their markets to rebound.

Over 61% of brokerages and 52% of agents said that they were either maintaining or increasing their marketing. A lot of this is being done online and through social media.

Possibly as a result of so many industries doing the same thing, the cost of social media and online marketing is down. Many professionals are taking advantage of this to build their marketing platforms for the future.

Low interest rates are helping appraisers replace their lost residential sales business with refinancing appraisals. Networking with attorneys can bring them appraisal orders that are needed for litigation, bankruptcies, and estate planning. They can also recruit business from banks who need to analyze their loan portfolio.

Coaches and trainers are encouraging agents in their area to take advantage of whatever downtime they have for professional improvement training.

Schools are doing the same thing, expanding from required pre-licensing and post-licensing continuing education classes to professional improvement courses.

Regardless of the unusual nature of this economic cycle, one thing is the same. Cash is king. Investors with cash will be able to take advantage of distressed properties that will almost certainly start to appear.

The lack of participation by national iBuyers is giving an opening to local residential investors.

With the uncertainty surrounding some segments of the commercial market, residential investment properties could be a good hedge for the future.

By Taylor Wilman

Long Term Gold/US Dollar Cycles Show Big Trends For Metals – Part II

By TheTechnicalTraders 

– In the first part of our US$ and Gold research, we highlighted the US Dollar vs. Gold trends and how we believe precious metals have recently bottomed while the US Dollar may be starting a broad decline.  We are highlighting this because many of our friends and followers have asked us to put some research out related to the US Dollar decline.  Back in November, we published an article that highlighted the Appreciation/Depreciation phases of the market.  This past research article – How To Spot The End Of An Excess Phase – Part II – is an excellent review item for today’s Part II conclusion to our current article.

Custom Metals Index Channels & Trends

Our Weekly Custom Metals Index chart, below, highlights the major bottom in precious metals in late 2015 as well as the continued upside price rally that is taking place in precious metals.  If our research is correct, the bottom that formed in 2015 was a “half cycle bottom” – where the major cycle dates span from 2010 to 2019 or so.  This half-cycle bottom suggests risk factors related to the global market and massive credit expansion after the 2008-09 credit crisis may have sparked an early appreciation phase in precious metals – launching precious metals higher nearly 3 to 4 years before the traditional cycle phases would normally end/reverse.

Recently, the upside price trend on this Custom Metals index page suggests a price channel has setup and may continue.  The recent pullback in price has just recently touched the lower price channel and started to stall near these lows.  If precious metals prices resume any upward price trends after reaching these lows, the technical pattern will stay valid and we believe Gold will attempt to rally above $2350 to $2500 in this next leg higher.  Longer-term, we feel it us just a matter of time before precious metals begin another breakout rally.

Longer-term Cycle Phases – Why They Are Important

Lastly, we want to leave you with the following longer-term market cycle chart showing the US Dollar, the SPX500 and GOLD.  We know this chart is a bit complicated and cluttered, but we’ll try to highlight the key elements for you to understand.  First, look for the rallies and declines in the US Dollar Index in alignment with the “Appreciation” and “Depreciation” phases.  Remember, the left and right edges of this chart are in a “Depreciation” phase thus, the dramatic selloff in the US Dollar index on the left edge of this chart took place near the beginning of a Depreciation Phase.  The rally in the US Dollar Index from 1992 to 2000 took place in an Appreciation Phase.  Currently, we believe we have ended an Appreciation Phase and started a new Depreciation phase in the markets.

Be sure to sign up for our free market trend analysis and signals now so you don’t miss our next special report!

Now, take a look at the SPX500 line on this chart.  Notice how bigger rallies take place in Appreciation phases and sideways trending (with massive volatility) take place in Depreciation phases?  The last Appreciation Phase started in 2010~11 (or so) and ended in 2018~19 (or so).  If our research is correct, this new Depreciation phase will last until 2027~28 (or so) and may prompt a very big volatility cycle in the US Dollar and the US/Global stock markets.

Now, pay attention to how Gold setup a major bottom in late 2015 (mid-cycle phase).  Could this be an indication that precious metals reacted to the peak in the US Dollar index rally phase early 2015 and subsequent peak in the US Dollar in December 2016 (remember, that date was just after a major US election)?  Could the early phase rally in precious metals be warning us that another 600%+  rally in precious metals (just like what happened from 2000 to 2011) take place from the 2015 Gold lows near $1080?  If so, does this mean the ultimate upside price target for Gold is some where above $6,800?

If our research is correct, the longer term rotations in the global markets aligned with these major market phases will mean traders will have to learn to identify and trade the best performing assets at all times.  The shifts in how assets and sectors are valued will continue to roll in and out of favor as capital moves from one sector to another.  Precious metals and the US Dollar are just one component of the broader markets – there are hundreds of sector ETFs  and thousands of individual stock symbols to select from.  Skilled traders need to know when sectors perform the best and which asset classes/symbols are poised for the best returns – that is the only way to really try to beat the markets over the next 9+ years.

Precious metals should continue to find support and attempt to rally higher if our longer-term research is accurate, but skilled technical traders know we can’t simply rely on precious metals over the next 8+ years – we need more diversity and we need to protect our trading capital from losses.  The only way to do that is to learn how to spot the best performing assets and to stay ahead of emerging trends.  Get ready, the next few years are certainly going to be interesting and full of opportunities.

We publish this free research to help you stay ahead of broad market trends and to illustrate how we apply our technical analysis skills in helping you find and trade the best performing assets. We are proud of the research we deliver to you fro FREE, but if you want to profit from our knowledge then go to www.TheTechnicalTraders.com to learn more about our BAN trading and review an example of my daily pre-market reports. Please take a minute to visit our web site to see how we can help you survive and prosper from these big future trends.

Happy Trading!

Chris Vermeulen
Chief Market Strategist
www.TheTechnicalTraders.com

NOTICE AND DISCLAIMER: Our free research does not constitute a trade recommendation or solicitation for readers to take any action regarding this research.  We are not registered financial advisors and provide our research for educational and informational purposes only. Read our FULL DISCLAIMER here.

Japanese Candlesticks Analysis 15.12.2020 (EURUSD, USDJPY, EURGBP)

Article By RoboForex.com

EURUSD, “Euro vs. US Dollar”

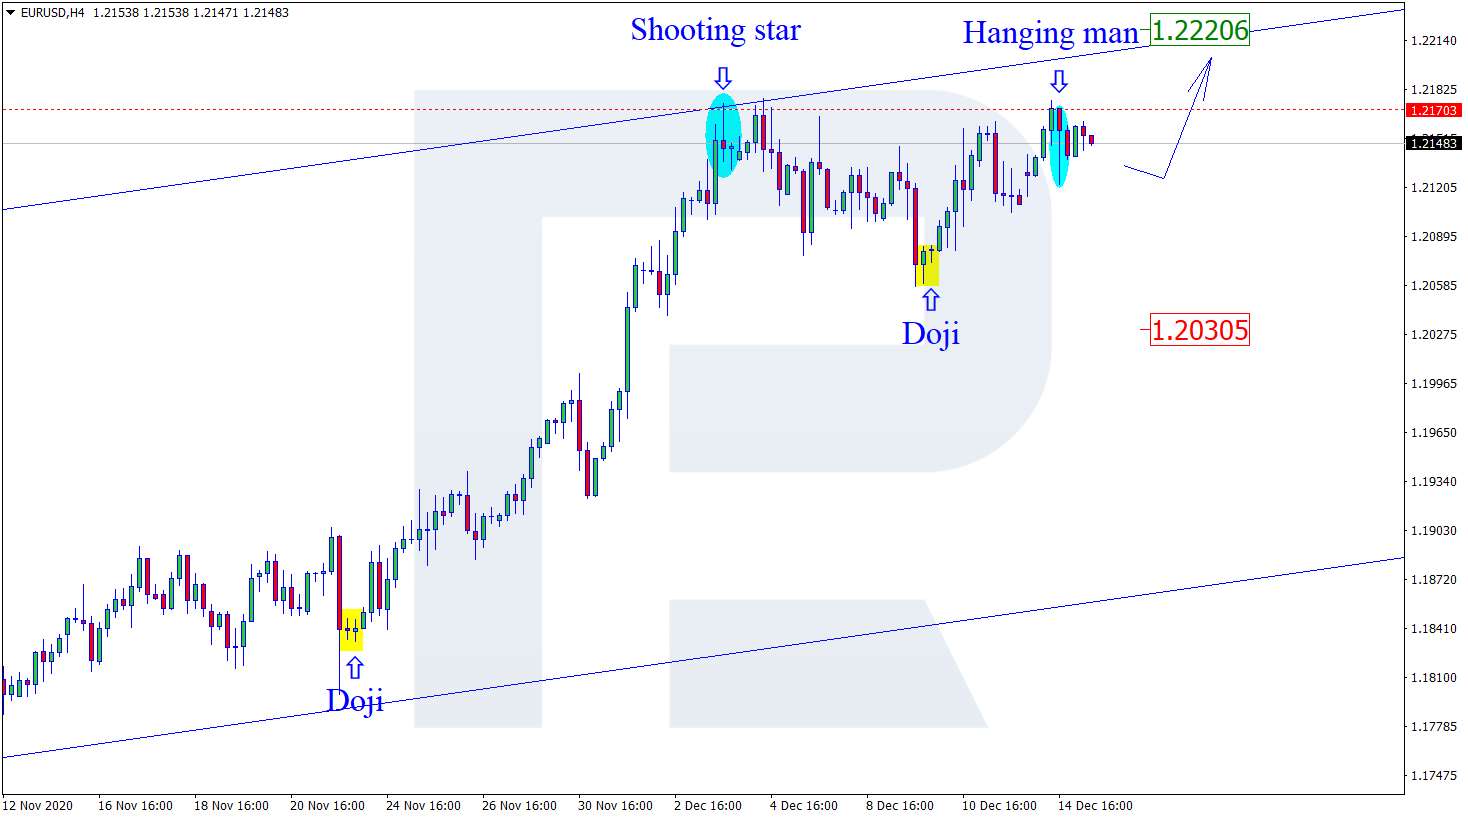
As we can see in the H4 chart, the correction within the ascending tendency continues. Right now, after forming several reversal patterns, such as Hanging Man, close to the horizontal resistance level, EURUSD may reverse in the form of another correction with the target at 1.2100. After completing the correction, the pair may resume trading upwards. In this case, the upside target may be at 1.2220. Later, the market may continue its growth.

EURUSD
Risk Warning: the result of previous trading operations do not guarantee the same results in the future

USDJPY, “US Dollar vs. Japanese Yen”

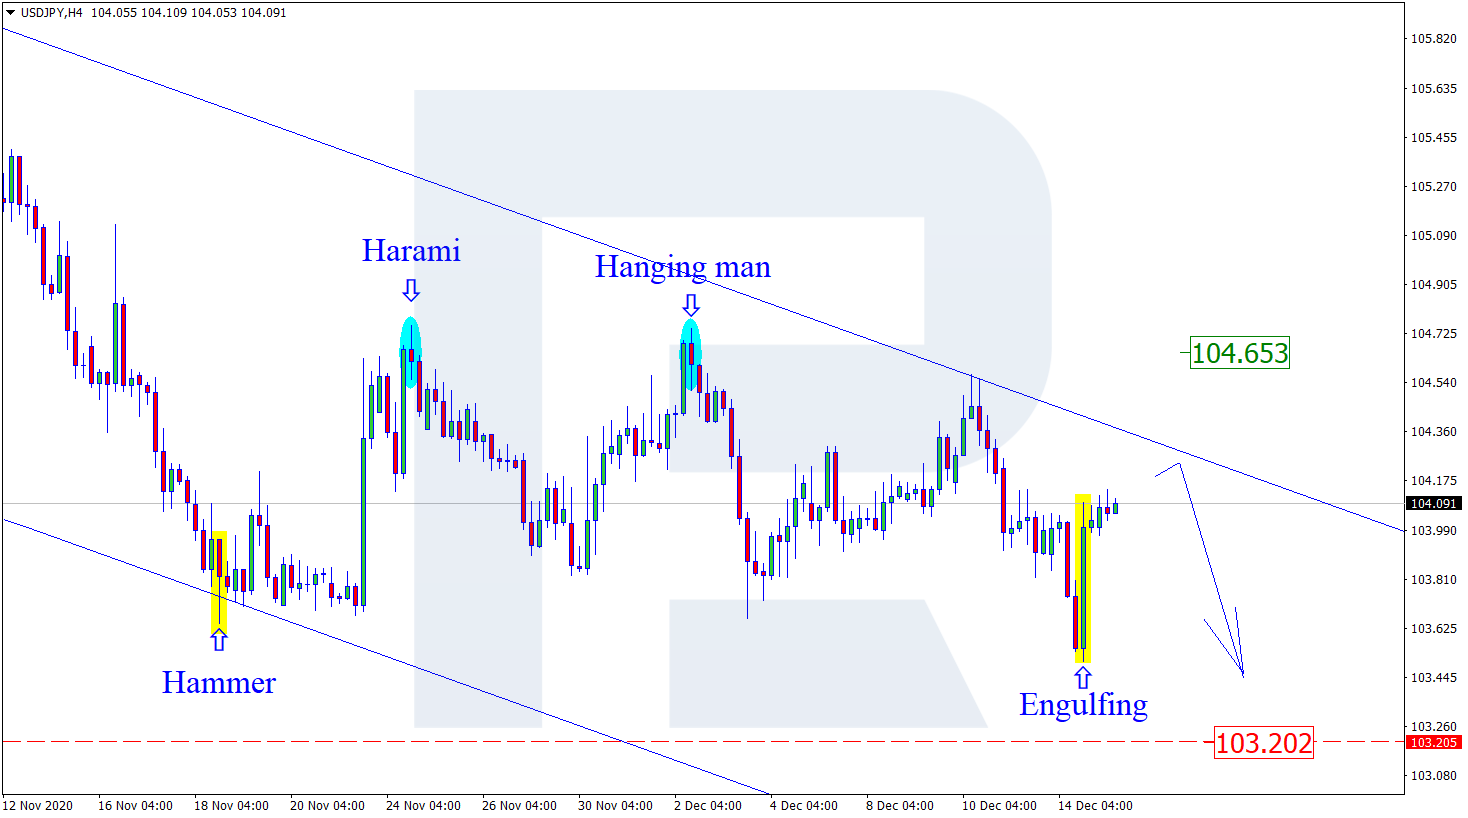
As we can see in the H4 chart, after testing the horizontal support level and forming an Engulfing pattern, USDJPY is reversing. The correctional target may be near the descending channel’s upside border. After finishing the correction, the asset may continue trading downwards to reach the support area at 103.20. At the same time, an opposite scenario says that the price may continue growing with the target at 104.65.

USDJPY
Risk Warning: the result of previous trading operations do not guarantee the same results in the future

EURGBP, “Euro vs. Great Britain Pound”

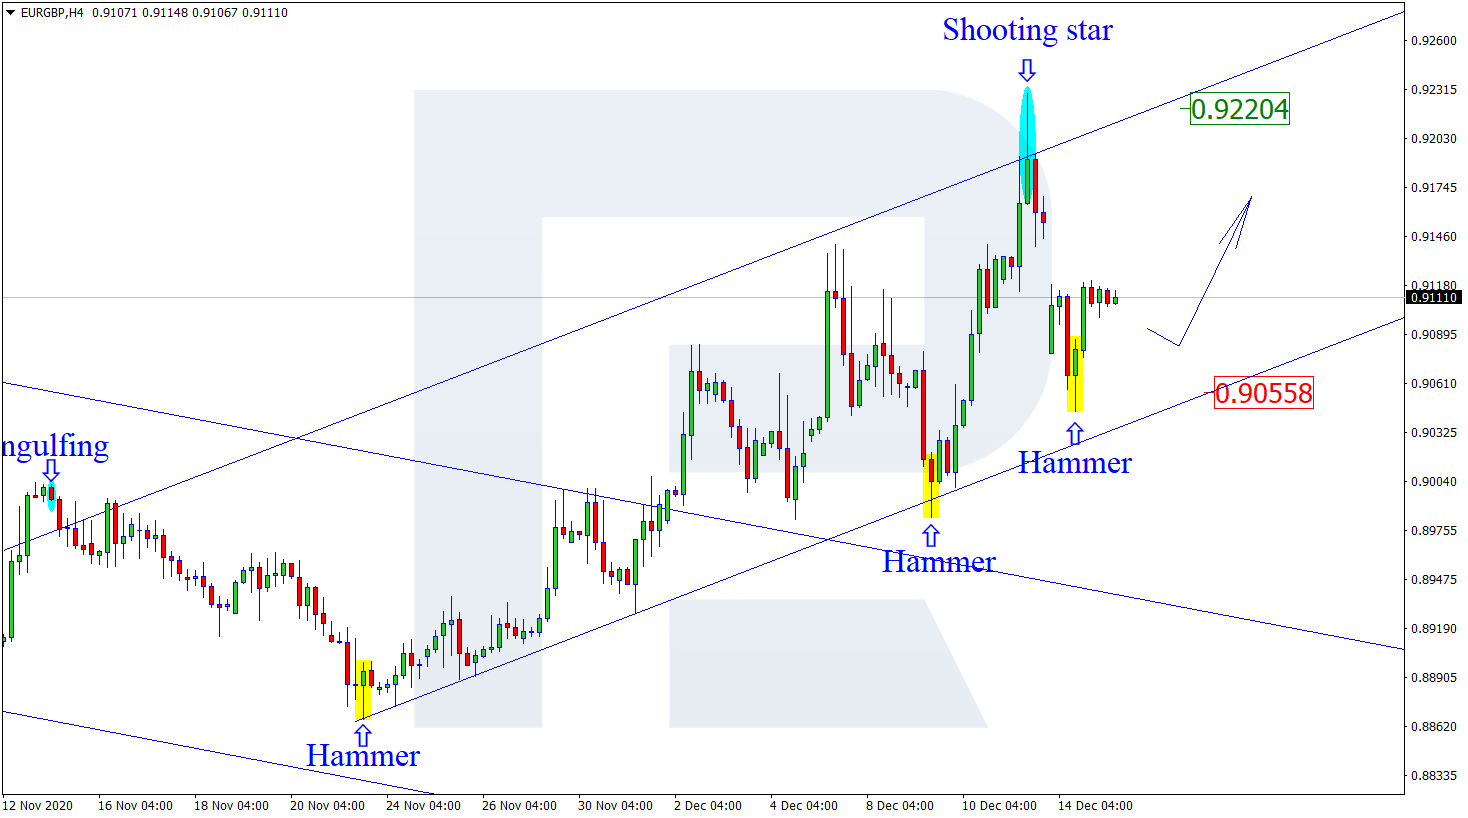
As we can see in the H4 chart, the ascending tendency continues. Right now, after forming several reversal patterns, such as Hammer, not far from the horizontal support level, EURGBP is reversing and may later continue moving upwards. In this case, the upside target may be at 0.9220. However, judging by previous movements, the pair may start another pullback to reach the support area at 0.9055.

EURGBP

Article By RoboForex.com

Attention!
Forecasts presented in this section only reflect the author’s private opinion and should not be considered as guidance for trading. RoboForex LP bears no responsibility for trading results based on trading recommendations described in these analytical reviews.

Ichimoku Cloud Analysis 15.12.2020 (USDCHF, ETHUSD, CADJPY)

Article By RoboForex.com

USDCHF, “US Dollar vs Swiss Franc”

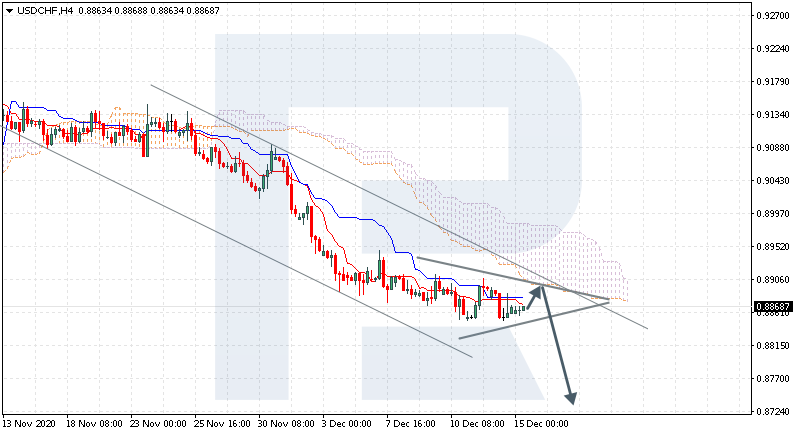
USDCHF is trading at 0.8868; the instrument is moving below Ichimoku Cloud, thus indicating a descending tendency. The markets could indicate that the price may test the cloud’s downside border at 0.8895 and then resume moving downwards to reach 0.8735. Another signal in favor of further downtrend will be a rebound from the descending channel’s upside border. However, the bearish scenario may no longer be valid if the price breaks the cloud’s upside border and fixes above 0.8995. In this case, the pair may continue growing towards 0.9085. To confirm further decline, the asset must break the downside border of the Triangle pattern and fix below 0.8825, thus indicating further decline to cover the distance equal to the pattern’s height.

USDCHF
Risk Warning: the result of previous trading operations do not guarantee the same results in the future

ETHUSD, “Ethereum vs US Dollar”

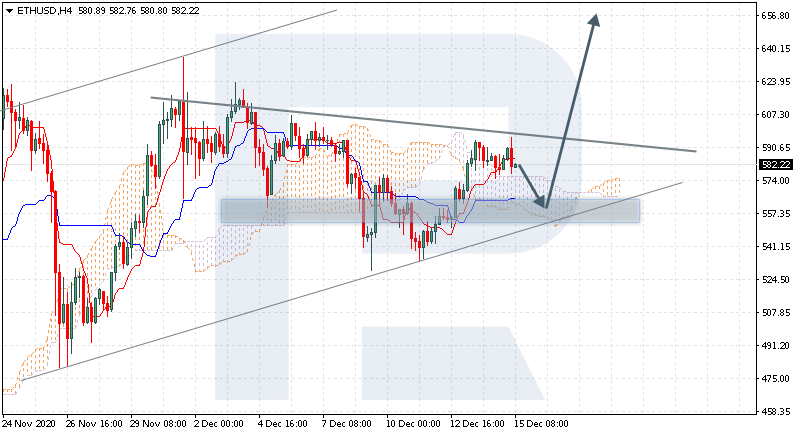
ETHUSD is trading at 582.22; the instrument is moving above Ichimoku Cloud, thus indicating an ascending tendency. The markets could indicate that the price may test the cloud’s downside border at 560.05 and then resume moving upwards to reach 655.05. Another signal in favor of further uptrend is a rebound from the rising channel’s downside border. However, the bullish scenario may no longer be valid if the price breaks the cloud’s downside border and fixes below 540.05. In this case, the pair may continue falling towards 505.05. To confirm further growth, the asset must break the resistance area and fix above 605.05, thus indicating the completion of an Inverted Head & Shoulders reversal pattern.

ETHUSD
Risk Warning: the result of previous trading operations do not guarantee the same results in the future

CADJPY, “Canadian Dollar vs Japanese Yen”

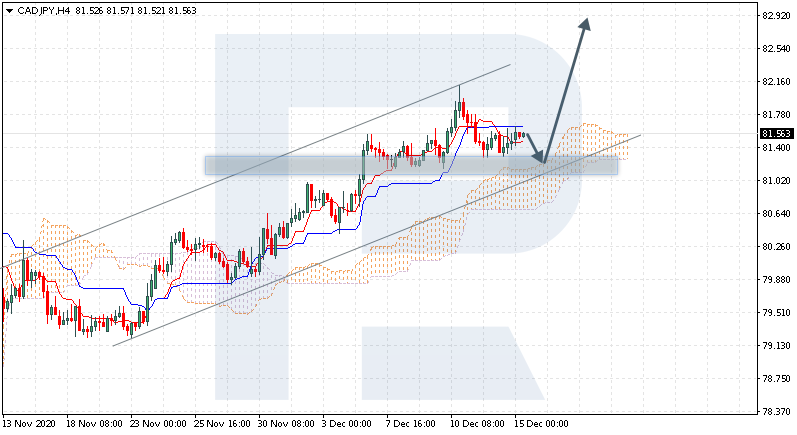
CADJPY is trading at 81.56; the instrument is moving above Ichimoku Cloud, thus indicating an ascending tendency. The markets could indicate that the price may test the cloud’s upside border at 81.05 and then resume moving upwards to reach 82.95. Another signal in favor of further uptrend will be a rebound from the rising channel’s downside border. However, the bullish scenario may no longer be valid if the price breaks the cloud’s downside border and fixes below 80.35. In this case, the pair may continue falling towards 79.45.

CADJPY

Article By RoboForex.com

Attention!
Forecasts presented in this section only reflect the author’s private opinion and should not be considered as guidance for trading. RoboForex LP bears no responsibility for trading results based on trading recommendations described in these analytical reviews.

The Analytical Overview of the Main Currency Pairs on 2020.12.15

by JustForex

The EUR/USD currency pair

Technical indicators of the currency pair:
  • Prev Open: 1.2118
  • Prev Close: 1.2143
  • % chg. over the last day: +0.21%

On Monday, EUR/USD reached the upper border of the range but failed to break through it. Information for the foreign exchange market is received in different directions. On the one hand, there are positive aspects like the improvement of the state of the manufacturing sector. On the other hand, there are new restrictive measures due to the coronavirus pandemic. The pair cannot choose the direction and remains in the sideways range for now.

Trading recommendations
  • Support levels: 1.2106, 1.2059
  • Resistance levels: 1.2175, 1.2167

The main scenario: working in a narrow range, but selling seems more interesting. Technical indicators and fundamental background are still on the side of the bulls, but the second reach of the annual maximum and the pullback should alert buyers. A “double top” pattern appeared on the chart, which indicates a possible correction. The ADX trend strength indicator started to weaken, and the MACD is already showing the third divergence. We expect the pair to remain between 1.2175 and 1.2106 during the day, but there is a possibility of a breakout to 1.2059.

Alternative scenario: if the price fixes above the level of 1.2175, the growth is likely to continue.

EUR/USD

There is no news feed for today.

The GBP/USD currency pair

Technical indicators of the currency pair:
  • Prev Open: 1.3260
  • Prev Close: 1.3324
  • % chg. over the last day: +0.48%

On Monday, the sterling demonstrated ambivalent dynamics. Having closed the day in a positive zone, it left a long shadow at the top of the D1 timeframe. This indicates that our assumptions were correct. Getting around to the Brexit negotiations does not change anything for investors. The tension remains due to uncertainty, and any growth of the pair will remain limited for now.

Trading recommendations
  • Support levels: 1.3225, 1.3196
  • Resistance levels: 1.3407, 1.3477

The main scenario: risk-averse buying on a decline. As long as the price is above SMA 50 and SMA 100, the likelihood of continued growth is bigger. However, the northern movement is likely to be limited by the first resistance level, as the ADX indicator reacted to yesterday’s upward impulse with a very slow rise. At the same time, the MACD demonstrated convergence, and this is already a signal about the possibility of the sterling to break the upper level.

Alternative scenario: if the price fixes below 1.3303, the bullish impetus will be lost and we can consider selling the pair.

GBP/USD
News feed for 2020.12.15:
  • – It’s worth paying attention to the UK labor market data at 10:00 (GMT+2).

The USD/JPY currency pair

Technical indicators of the currency pair:
  • Prev Open: 104.05
  • Prev Close: 104.03
  • % chg. over the last day: -0.01%

On Monday, trading closed slightly lower. The pair managed to break through the lower border of its range but quickly rebounded in the opposite direction. The daily chart left a long shadow at the bottom, which indicates a possibly strong buying activity near the price level of 103.50.

Trading recommendations
  • Support levels: 103.68, 103.52
  • Resistance levels: 104.59, 104.74

The main trading scenario: trading in a sideways range between the levels of 104.59 and 103.68. Although the pair was able to break through the range of Monday, there was a quick return of the price to the moving averages SMA 50 and SMA 100. The ADX demonstrated no reaction to the downward movement, while the MACD remained in the positive zone.

An alternative scenario assumes a break-through to 103.52 and a fall to 103.19.

USD/JPY
There is no news feed for today.

The USD/CAD currency pair

Technical indicators of the currency pair:
  • Prev Open: 1.2768
  • Prev Close: 1.2760
  • % chg. over the last day: -0.06%

Oil continues to support the Canadian dollar. It seems that this commodity currency is not going to retreat, as “black gold” has consolidated above the opening level of last week. Brent quotes reached February values this year. Against this backdrop, buying remains dangerous and any northern pullback could be an opportunity for short positions.

Trading recommendations
  • Support levels: 1.2707, 1.2528
  • Resistance levels: 1.2792, 1.2835, 1.2886

Consider trading in a sideways range between 1.2792 and 1.2707. It looks like the pair isn’t moving southward, but simply changed the area of consolidation. The price is trading near the moving averages, while the oscillators are near zero value. This is a sign of continued trading near the current quotes. Most likely, this trend will extend until the Fed meeting on Wednesday.

Alternative scenario: if the price manages to return above 1.2792, the south trend will be broken and a buy signal will appear towards the level of 1.2886. A break-through at 1.2707 could signal further decline towards 1.2528.

USD/CAD
There is no news feed for today.

by JustForex


This article reflects a personal opinion and should not be interpreted as an investment advice, and/or offer, and/or a persistent request for carrying out financial transactions, and/or a guarantee, and/or a forecast of future events.

The virus continues to hold back the investors

by JustForex

On Monday, American indices decreased after an optimistic start of trading. Following them this morning the Asian stock market and European futures have decreased too. Despite the positive growth dynamics for industry and retail sales in China, there is a certain feeling of the market is feeling cautiousness in the market. The big banks like JPMorgan Chase are starting to warn investors about the possibility of a long-awaited correction.

After the resumption of Brexit talks in Brussels and the support of the US economy, the positive sentiment was quickly followed by a pause before the Fed meeting. Another obstacle for bulls is the news around the coronavirus. Following Europe, the likelihood of restrictions tightening in the United States increased. New York Mayor Bill de Blasio warned that the population must be prepared for complete isolation.

Trade disputes between the United States and China bring some negativity to the market. It looks like Australia is the only affected party now. After Sydney backed Washington in the trade war, China began to retaliate. Today it became known about the complete stop of coal imports from Australia, which hit the commodity indices. The Australian dollar ends Asian trading in the red.

The credit market is calm but it’s lower at the levels than last week. Treasuries have stabilized around 0.900%. The foreign exchange market is calm. The dollar index shows slight fluctuations around 90.70 for the eighth session in a row.

Market indicators

Major stock indices are trading in different directions, but mostly in the negative zone:

S&P 500 (F) 3.645.12 +5.12 +0.14%

Dow Jones 29.861.55 -184.82 -0.62%

DAX 13.223.16 +108.86 +0.83%

FTSE 100 6.531.83 -14.92 -0.23%

The news feed for 2020.12.15:
  • – UK labor market data at 10:00 (GMT+2).

by JustForex


This article reflects a personal opinion and should not be interpreted as an investment advice, and/or offer, and/or a persistent request for carrying out financial transactions, and/or a guarantee, and/or a forecast of future events.

Technical outlook: More Pain For The Dollar?

By Lukman Otunuga, Research Analyst, ForexTime

The past few weeks have certainly not been kind to the Dollar.

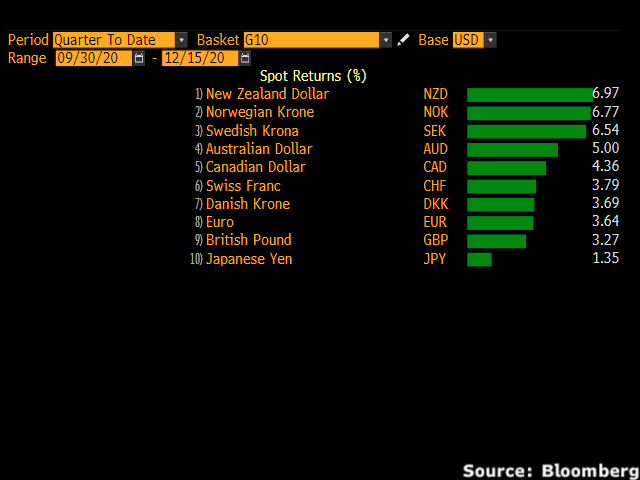
It has been bashed, smashed, thrashed and steamrolled by G10 currencies throughout the final quarter of 2020.

The string of good news on the vaccine front has boosted global sentiment and stimulated investor risk appetite while hopes around a U.S. fiscal stimulus package continues to weigh heavily on the Greenback. Given how a bipartisan group of US senators are set to present a new fiscal stimulus compromise worth $748 billion, markets remain hopeful over a possible breakthrough on the horizon.

Before we dig into the technicals, let us not overlook the Federal Reserve meeting on Wednesday which could impact the Dollar’s near-term outlook. The central bank is expected to leave interest rates unchanged but there could still be some fireworks. Given how this is the last meeting of 2020, the Fed is likely to adopt a cautious stance over the near-term outlook. However, there could be optimism over the longer-term outlook given how the United States approving the emergency use of the Pfizer-BioNTech coronavirus vaccine.

The word around town is that the Fed may issue new guidance extending its emergency bond-buying programme. If the central bank sounds dovish and expresses concerns over the swelling coronavirus cases, the Dollar could be instore for further pain.

What are the technicals saying?

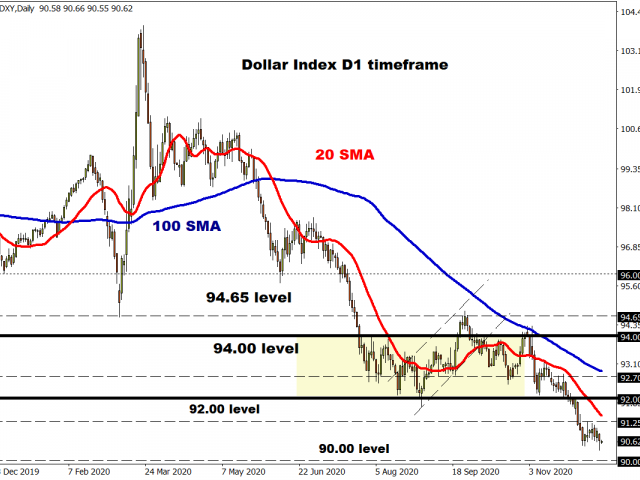
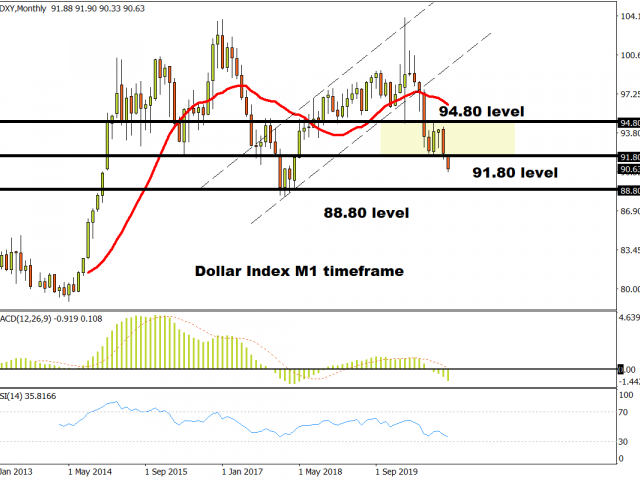
Well, the Dollar Index (DXY) is heavily bearish on the monthly timeframe. 2020 has been a terrible year for the Dollar as trades near levels not seen in two and a half years. After breaching the 92.00 support level, the DXY has cut through various levels like a hot knife through butter. Sustained weakness below 91.00 could trigger a decline towards 90.00 and 88.00, respectively.

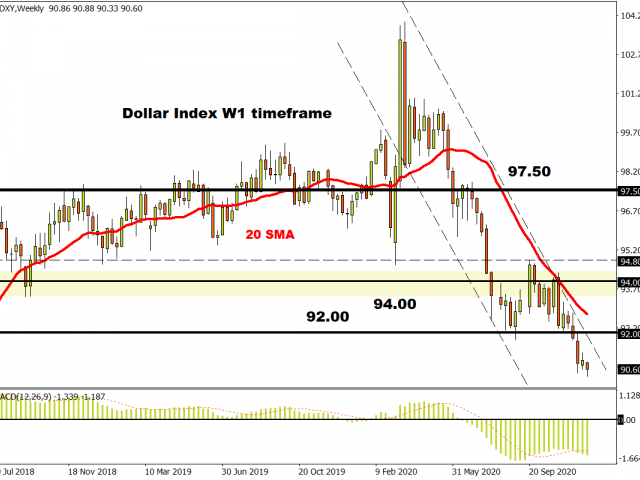
It’s the same story on the weekly charts, there have been consistently lower lows and lower highs while prices are trading below the 20 Simple Moving Average. The candlesticks are respecting the bearish channel with 90.00 acting as the next point of interest. A technical rebound towards 92.00 may be on the cards before bears attempt to drag prices lower.

On the daily timeframe, the trend points south. Sustained weakness below the 91.25 intraday resistance could trigger a decline towards 90.00 in the near term. If prices can break above 91.25, a move towards 92.00 could be on the cards.

Disclaimer: The content in this article comprises personal opinions and should not be construed as containing personal and/or other investment advice and/or an offer of and/or solicitation for any transactions in financial instruments and/or a guarantee and/or prediction of future performance. ForexTime (FXTM), its affiliates, agents, directors, officers or employees do not guarantee the accuracy, validity, timeliness or completeness, of any information or data made available and assume no liability as to any loss arising from any investment based on the same.


Forex-Time-LogoArticle by ForexTime
ForexTime Ltd (FXTM) is an award winning international online forex broker regulated by CySEC 185/12 www.forextime.com

How has China recovered so well from the pandemic?

By Han Tan, Market Analyst, ForexTime

It’s become increasingly clear that China’s recovery is on a significantly steadier path.

China’s November industrial production posted a 7% growth compared to the same month in 2019, which is its fastest growth since March 2019. Its retail sales expanded by 5% year-on-year in November; its highest figures in 2020 so far. Fixed-asset investments over the first 11 months of 2020 have increased by 2.6% compared to the same period last year.

China leading the world into post-pandemic era

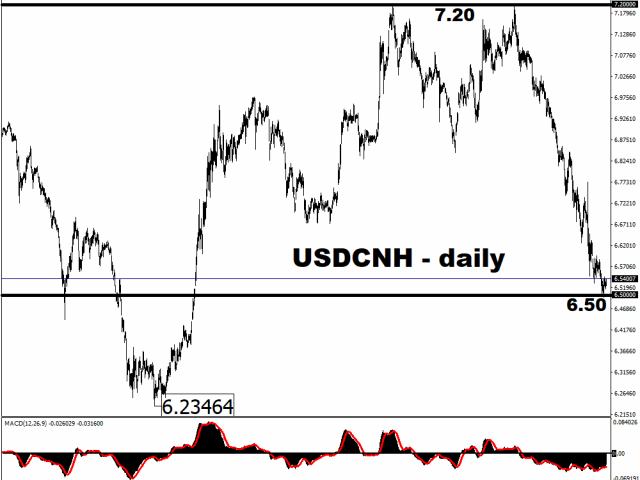
These data sets released today came in line with market expectations, and demonstrate why China is the only major economy expected to post a positive annual GDP for 2020. China’s economic outperformance is clearly illustrated in the Chinese Yuan’s strength. The offshore Yuan is trading around its strongest levels against the US Dollar since June 2018, and is Asia’s second-best performer against the Greenback so far this year.


So how has China been able to pull off such a remarkable resurgence?

Health is wealth

First and foremost, it came down to the health response within the Chinese population. What we have learned since this pandemic broke out is that, a country’s ability to constrain the spread of Covid-19 sets the foundation for its economic recovery. The local population’s compliance with some of the strictest lockdown measures in the world have proved crucial to China’s economic successes.

China used stimulus to great effect

The government’s initiatives in helping key sectors that have been adversely affected by the pandemic also helped the broader economy recover at a faster clip. For example, China’s manufacturing and non-manufacturing PMIs have been able to register a reading of 50 or higher every single month this year except in February. A reading of 50 denotes expansionary conditions in the manufacturing sector. Such resilience has clearly been aided by the fiscal stimulus with amounted to about 11% of China’s GDP. On the monetary policy side, the central bank has already hinted at being able to taper emergency support measures. This is in stark contrast to the central banks at G10 economies that have pledged to remain accommodative, potentially for years to come.

China benefitting from global recovery

China’s external trade figures also show booming conditions for the sector. Its November exports saw their biggest jump since February 2018, having recorded a 21.1% on-year increase. The positive surprise was fuelled by demand for medical equipment, work-from-home devices, and other goods necessary to survive amid the pandemic in other parts of the world. China’s exports have also benefited as its major trading partners slowly emerged from their respective lockdowns going into Q4, while the seasonal year-end pickup in demand also helped propelled its external trade figures.

Asia’s fortunes dependent on China’s recovery

Asian stocks have clearly been buoyed by China’s economic recovery, given the region’s dependence on the world’s second largest economy. The MSCI Asia Pacific index registered a record high this past Friday, and Asian stocks have beaten its counterparts in the developed markets so far in 2020. The MSCI Asia Pacific index has climbed by almost 14 percent on a year-to-date basis, beating the MSCI World index by about 3 percentage points.

However, Asian stocks are cooling off so far this week

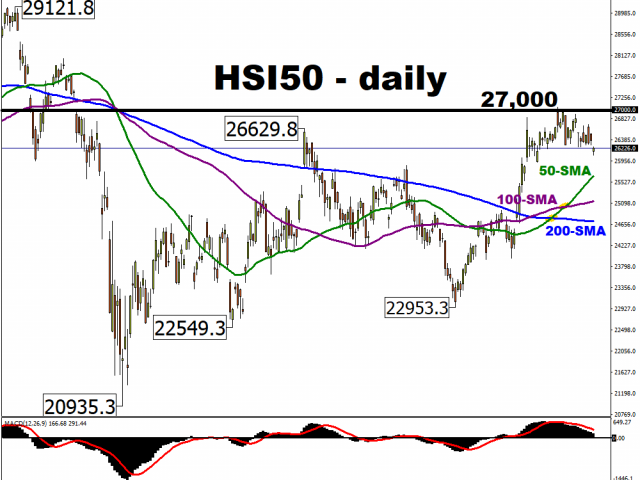
Hong Kong’s Hang Seng index is now lower by 0.7 at the time of writing, extending its week-to-date losses beyond one percent. The city’s benchmark index has been unable to replicate its performance in late-November when it breached the psychologically-important 27,000 mark. Still, having formed golden crosses of late, whereby its shorter-term moving average has crossed above its longer-term counterparts, such technical episodes typically signals more gains to come. They also confirm the uptrend seen in the Hang Seng index, having posted higher highs and higher lows since its March trough.


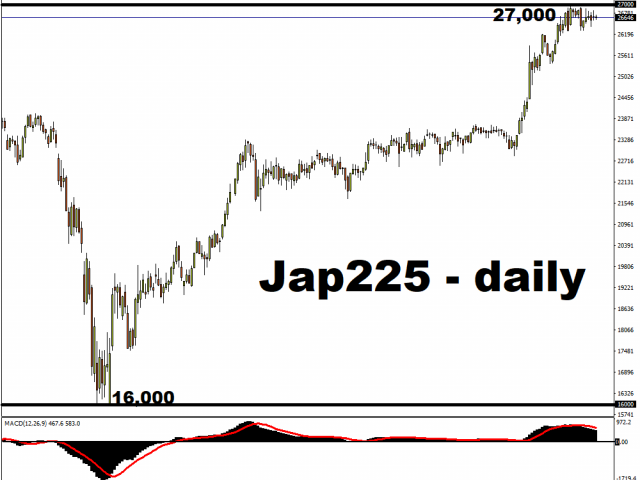
Japan’s Nikkei 225 is also flirting with its own 27,000 mark, despite being lower by 0.3 percent on Tuesday. Still, Japan’s benchmark stock index remains around its highest levels since 1991.


Overall, as long as the region’s economic recovery can take its cues from China, that should create more upside for Asian stocks moving forward.


Disclaimer: The content in this article comprises personal opinions and should not be construed as containing personal and/or other investment advice and/or an offer of and/or solicitation for any transactions in financial instruments and/or a guarantee and/or prediction of future performance. ForexTime (FXTM), its affiliates, agents, directors, officers or employees do not guarantee the accuracy, validity, timeliness or completeness, of any information or data made available and assume no liability as to any loss arising from any investment based on the same.


Forex-Time-LogoArticle by ForexTime
ForexTime Ltd (FXTM) is an award winning international online forex broker regulated by CySEC 185/12 www.forextime.com