The Analytical Overview of the Main Currency Pairs on 2020.12.29

by JustForex

The EUR/USD currency pair

Technical indicators of the currency pair:
  • Prev Open: 1.2184
  • Prev Close: 1.2215
  • % chg. over the last day: +0.25%

EUR/USD continued its growth on Monday, adding 0.25%, but it takes it slow to break through the maximum of this month at the level of 1.2272. Low liquidity reduces volatility shortly before the holidays. Traders refrain from opening new deals, which may even cause a correction.

Trading recommendations
  • Support levels: 1.2151, 1.2130
  • Resistance levels: 1.2272

The main scenario for trading EUR/USD is buying on a decline. The bullish signal strengthened after the break-through of the upper border of the triangle. Thus, the pair confirmed its bullish intentions. Other indicators also point to growth. The moving averages have rebuilt and demonstrated a north direction. The ADX indicates high trend potential.

Alternative scenario: if the price can fix below 1.2208, it is possible that the price will move further to 1.2130, and a break-through of the last point may signal a complete reversal.

EUR/USD
There is no news feed for today.

The GBP/USD currency pair

Technical indicators of the currency pair:
  • Prev Open: 1.3544
  • Prev Close: 1.3457
  • % chg. over the last day: -0,65%

It may seem paradoxical, but after the news about the readiness to reach a deal, the sterling decreased. It seems that investors fully appreciated the availability of an agreement between the two parties in advance and will now focus on economic problems. Britain will start the new year with problems in the economy, which may worsen after the official withdrawal from the European bloc.

Trading recommendations
  • Support levels: 1.3287, 1.3187
  • Resistance levels: 1.3623

The main scenario is selling on growth. Technical specifications are now mixed. The upward momentum has slowed down. The pair is stuck between the two moving averages SMA 50 and SMA 100. The MACD moved into the negative zone, but the ADX still indicates the presence of bulls in the currency pair. The trend potential oscillator doesn’t react to a decline. The “double top” pattern is a strong sign of a possible departure of the currency pair for compensation.

Alternative scenario: if the pair fixes above 1.3523, the southern scenario is likely to reverse and the pair can reach 1.3623.

GBP/USD
There is no news feed for today.

The USD/JPY currency pair

Technical indicators of the currency pair:
  • Prev Open: 103.66
  • Prev Close: 103.77
  • % chg. over the last day: +0.10%

The break-through of the maxima on the stock markets helped the bulls to overcome the first resistance at 103.73. But it hasn’t yet managed to fix. The currency pair continues to fluctuate around 103.50, showing no particular signs of movement in this or other direction. Technical indicators point to the unlikely development of both the northern and southern scenarios.

Trading recommendations
  • Support levels: 103.26, 102.89
  • Resistance levels: 103.90, 104.15

The main scenario is trading in a sideways range. Signs of a narrow rising channel are emerging but are not yet convincing. The ADX stopped responding to the movement of the pair, and the MACD returned to zero values. Most likely, the instrument will continue to show low volatility and remain within the range of 103.90 – 103.50.

An alternative scenario assumes a break-through of 103.26 and the development of a further fall. In case of breaking 103.73, further growth to 104.15 or higher is possible.

USD/JPY
There is no news feed for today.

The USD/CAD currency pair

Technical indicators of the currency pair:
  • Prev Open: 1.2841
  • Prev Close: 1.2846
  • % chg. over the last day: +0.04%

On Monday, the trading session brought the pair a symbolic 0.04% on a slight decline in oil prices. The market is awaiting the OPEC+ decision on oil production, so the Brent and WTI quotations slightly decreased.

Trading recommendations
  • Support levels: 1.2789, 1.2689
  • Resistance levels: 1.2954, 1.3079

The main scenario is risk-averse selling. The daily candle has left shadows above and below, which provides equal signals to bulls and bears. The MACD is near zero. But the moving averages indicate a resumption of the southern scenario. The same is observed on the ADX oscillator – an increase in the potential of the southern trend. In this regard, there is a possibility of renewed bearish sentiment. The signal will strengthen with the break-through of 1.2789.

Alternative scenario: if the price manages to return above 1.2858, the pair may resume the upward correction.

USD/CAD
There is no news feed for today.

by JustForex


This article reflects a personal opinion and should not be interpreted as an investment advice, and/or offer, and/or a persistent request for carrying out financial transactions, and/or a guarantee, and/or a forecast of future events.
When could we see $60 Oil again?

By Han Tan, Market Analyst, ForexTime

Riskier assets couldn’t hold back their delight on Monday after President Trump signed off on the US$2.3 trillion package which combines government funding and pandemic relief measures. US benchmark stock indices such as the S&P 500, the Dow Jones, and the Nasdaq 100 closed at new record highs.

However, US Crude prices did not share the same level of enthusiasm for the incoming fiscal stimulus.

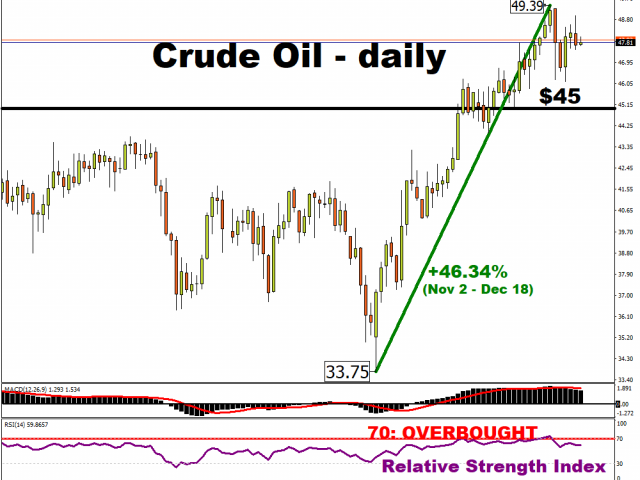
Having rallied hard since early September, gaining as much as 44 percent to hit its highest levels since March, Crude Oil has since plateaued. From a technical perspective, this was a healthy move, given that prices had far extended into overbought territory leading up to Christmas day, judging by its 14-day relative strength index. WTI crude futures fell 1.26 percent on Monday, before paring losses at the time of writing.


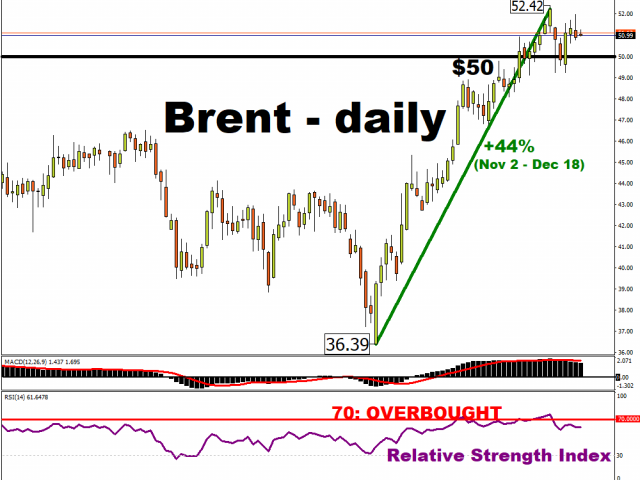
Similarly, Brent Oil had gained 44 percent during that same 7-week period, before consolidating after such a rapid ascension. Brent futures registered a 0.8 percent decline yesterday and is now striving to erase those losses.


Recall that much of those gains since early November coincided with positive developments surrounding a Covid-19 vaccine, and Oil prices were further boosted by expectations that OPEC+ would restore its Oil supplies at a slower pace next year. The narrative held by markets to justify the surge in Oil prices was that the lower-than-previously-expected output hike would occur alongside a vaccine-enabled demand recovery. Such supply-demand dynamics diminished the risk of oversupplied conditions in global markets, while warranting higher prices.

However, it appears that the easy gains are now over.

What’s standing in the way of higher Oil prices?

Oil bulls are taking a breather for the time being, as they digest some looming downside risks.

As the world waits for the Covid-19 vaccine to reach a sizeable portion of its population, Covid-19 hospitalizations in the US are at record levels, while the lockdown measures in southern California looks likely to be extended. Spain has recorded a death toll of more than 50,000 due to the pandemic. Asian economies are ramping up their attempts to halt the spread of Covid-19 within their borders, with the likes of Indonesia and Taiwan raising the bar on foreign visitors and flight crews. Many nations have already imposed bans on flights from the UK on fears over the potentially faster coronavirus strain.

Such virus-curbing measures have a dampening effect on global demand for Oil, as economic activity struggles to overcome the pandemic, which in turn is serving as a drag on prices.

Key OPEC+ moves in early January

While the resurgent coronavirus is eroding demand, some OPEC+ members appear eager to restore more of their supply. Recall that the alliance of major Oil-producing nations had decided earlier this month to lower its output hike to 500,000 barrels per day (bpd) starting from this Friday, January 1st. That 500,000 bpd figure is lower than the previous plan of hiking output by some 2 million bpd.

However, OPEC+ is due to meet next week to decide on February’s production levels, and already Russia has indicated its willingness to increase output some more. Russia’s Deputy Prime Minister has cited the $45-$55 range as “most optimal” for Oil prices. Still, other major OPEC+ members require Oil prices to be higher in order to fund their respective fiscal plans.

Hence, it remains to be seen where the balance of power lies in next Monday’s meeting, and that may have a major say on whether Oil can continue climbing higher.

In short, a return to $60 Oil would require a disciplined restoration of OPEC+ supplies, coupled with sustained signs that the global economy is taking meaningful strides into the post-pandemic era.


Disclaimer: The content in this article comprises personal opinions and should not be construed as containing personal and/or other investment advice and/or an offer of and/or solicitation for any transactions in financial instruments and/or a guarantee and/or prediction of future performance. ForexTime (FXTM), its affiliates, agents, directors, officers or employees do not guarantee the accuracy, validity, timeliness or completeness, of any information or data made available and assume no liability as to any loss arising from any investment based on the same.


Forex-Time-LogoArticle by ForexTime

ForexTime Ltd (FXTM) is an award winning international online forex broker regulated by CySEC 185/12 www.forextime.com

2021’s major investment risks – but why it could be a year of massive opportunity

By George Prior

– Investment headwinds will “still exceed the tailwinds” in 2021 – but there could be more “major opportunities now than in perhaps the last 10 years” if you know where to look.

This is the bold and, given 2020, perhaps surprisingly optimistic forecast from Nigel Green, chief executive and founder of deVere Group, one of the world’s largest independent financial advisory and fintech organisations.

It comes as investors around the world focus on rebalancing portfolios for 2021, after a year no-one expected.

Mr Green says: “2020 was a year for which nobody had planned.

“This included investors, many of whom were caught spectacularly off-guard by not having properly diversified portfolios, which left them open to untold financial risks.

“Looking ahead to 2021, it is likely that investment headwinds will still exceed the tailwinds – but, I believe, that there are also more major investment opportunities to be had in the next year than perhaps in the last decade.”

‘Headwinds’ are the factors that likely weigh on growth and returns, and ‘tailwinds’ are those that can be expected to boost growth and help drive positive returns.

He continues: “The major long-term headwind from the fallout of 2020 is unemployment, which will hit demand, growth and investment.

“There’s also the roll-out of a mass global vaccination agenda which will be a lengthy process and logistical minefield, plus there are the ‘vaccine sceptic’ concerns to address.

“Meanwhile there are geopolitical issues that could impact on investor returns. These include the significant readjustment that will need to happen following Brexit, U.S.-China trade relations which are likely to become increasingly competitive especially in the tech sector, and the rising border tensions between India and China, amongst others.”

However, despite the significant headwinds, the deVere CEO flags three major investment tailwinds in 2021.

“First, the rollout of the Covid vaccines which means economies can be expected to begin solid recoveries,” he says.

“Second, President-elect Joe Biden will enter office and his administration promises a more predictable approach to trade and foreign affairs – and the markets like certainty.

“And third, it is likely that governments will continue to offer fiscal support packages as their economies recover from the pandemic, offering a ‘floor’ for markets.”

Mr Green goes on to add: “To quote Einstein, ‘In the midst of every crisis, lies great opportunity.’

“This is why, after such a monumental crisis, I believe that if you know where to look and act appropriately to build your wealth, there could be plenty of key opportunities to come.

“The pandemic has accelerated history, speeding up and exacerbating major trends in just a few months, that ordinarily might have taken decades to be fully realised.”

He maintains that the global economy, how we live, do business and interact remains fundamentally changed.  “It is doubtful the world will go back exactly to how it was pre-Covid – there are many aspects of the ‘new normal’ which people like and support, just a home working.  As such, some of the major shifts are unlikely to be reversed,” he notes.

“As such, investors need to look for the lower entry points of quality companies to top-up their portfolios and, critically, they need to bear in mind how the world has changed.

“Their portfolios must reflect the future, not the past.”

Mr Green concludes: “Headwinds will surpass tailwinds in 2021 as the world readjusts, but it’s essential that investors stay invested. As we know, history has shown us that stock markets tend to go up over the long-term.

“But as the world moves ahead to a post-pandemic era, it’s crucial that investors ensure their portfolios are suitably diversified across asset classes, sectors, currencies and regions, so as to make the most of the considerable opportunities that will inevitably present themselves.”

About:

deVere Group is one of the world’s largest independent advisors of specialist global financial solutions to international, local mass affluent, and high-net-worth clients.  It has a network of more than 70 offices across the world, over 80,000 clients and $12bn under advisement.


Investors are evaluating a trade deal between the EU and Britain, as well as an investment deal with China

by JustForex

Optimism continues to reign on stock markets. The US stimulus package and the Brexit agreement pushed the MSCI global stock indicator closer to record maxima.

The successful conclusion of negotiations, which began in 2013 on an investment agreement between the EU and China, will be a blow to the former so-called “America First” strategy. The deal will give European investors access to the Chinese market in a variety of industries, from automobiles to biotechnology. Against this background, the dollar continues to decline, and the American Treasuries confidently hold around 0.950%.

The only weak link in the credit market is the British Gilts. There is some kind of tension and fear here. Since the negotiations no longer affect the market, investors are starting to assess the current economic situation and the consequences of the actual withdrawal. Due to the fact that the British economy has suffered significantly from long-running negotiations, and the coronavirus pandemic has increased the pressure on the economy, the beginning of the year for Foggy Albion can turn out to be very difficult.

Industrialists in the automotive industry face great difficulties. Of course, the sector escaped disaster, but there is even more damage that can be done after last week’s deal. The costs related to the need to switch suppliers and the burden of customs declarations, certificates and audits can still keep investing in this industry at a very low level.

Against this backdrop, the sterling feels uncertain, and the FTSE accelerated its growth in anticipation of a decline of the British currency.

Major stock indices are trading with the rise. The dollar index didn’t receive any drivers to growth.

S&P 500 (F) 3,745.62 +18.12 +0.49%

Dow Jones 30,403.97 +204.10 +0.68%

DAX 13,870.80 +80.51 +0.58%

FTSE 100 6,664.55 +162.44 +2.50%

USD Index 90.052 -0.223 -0.25%

There is no news feed for today.

by JustForex


This article reflects a personal opinion and should not be interpreted as an investment advice, and/or offer, and/or a persistent request for carrying out financial transactions, and/or a guarantee, and/or a forecast of future events.
Risk-on Mood Fuelled By U.S. Stimulus Bill

By Lukman Otunuga, Research Analyst, ForexTime

Global sentiment brightened on Tuesday after the US House of Representatives approved an increase in stimulus payments to a majority of Americans.

Given how it was only Sunday that Trump signed a $2.3 trillion spending package, this encouraging development is set to lift risk appetite and investor confidence. A potential boost in stimulus aid that increases payments to $2000 from $600 will be a welcome development for qualified Americans while uplifting confidence over the US economy. However, it may be too early for celebrations as the Senate will need to approve the bill for it to become law. When factoring in how Republicans controlling the Senate may not be open to the increased amount, things could get messy this week.

Most Asian stocks rose with U.S futures on Tuesday amid the positive U.S. stimulus developments while European equities are likely to soak up the risk-on vibe.

Dollar waves white flag 

It’s slowly shaping up to be a depressing week for the Dollar. All the positive news around the U.S stimulus bill and prospects of inflation rising in the United States is weighing heavily on the Dollar. The former king of the currency markets has weakened against every single G10 currency this month, quarter, and year. With bears clearly in the driving seat as fundamentals batter the Dollar, the path of least resistance points south. 

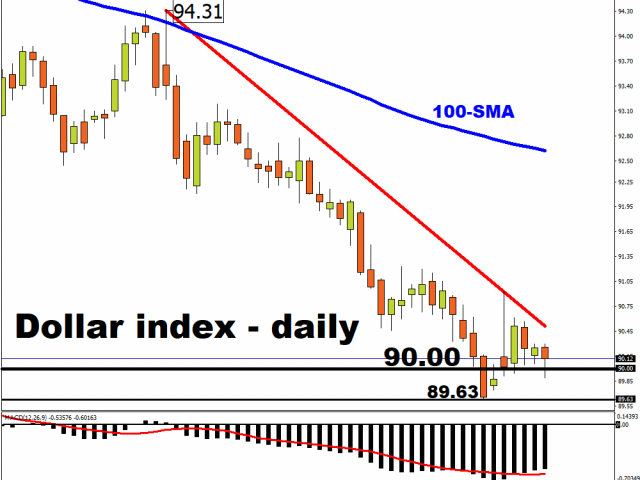
Taking a look at the Dollar Index, it has shed over 6.60% since the start of 2020. Prices are struggling to keep above 90.00 as of writing. A breakdown below this level is likely to open a path back towards 88.00.

Pound…what next?

One would have expected the Pound to push higher after the United Kingdom and the European Union reached a breakthrough in terms of a post-Brexit deal. While this development may remove a layer of uncertainty for the UK as 2021 looms, many questions around the trade agreement remain unanswered. With the way things are going, the Brexit saga could release a spin-off in 2021 revolving around the trade agreement. 

In regards to the technical picture, the GBPUSD could experience a pullback before pushing higher. Sustained weakness below 1.3482 may open a path back towards 1.3300 and 1.3200. Should 1.3482 prove to be reliable support, prices may target 1.3630.

Commodity spotlight – Gold 

The next few days could choppy for Gold prices due to conflicting forces.

On one side of the equation, surging coronavirus cases, a fast-spreading new strain of COVID-19, lockdown restrictions, a weaker Dollar, and US stimulus hopes have supported Gold bulls. However, optimism around the COVID-19 vaccinereviving global growth continue to blunt appetite for the precious metal. Given how risk-on remains thename of the game amid the positive US stimulus developments, this is likely to limit Gold’s upside. It maybe best to keep a close eye on how prices react around $1850, $1870 and $1900.

Disclaimer: The content in this article comprises personal opinions and should not be construed as containing personal and/or other investment advice and/or an offer of and/or solicitation for any transactions in financial instruments and/or a guarantee and/or prediction of future performance. ForexTime (FXTM), its affiliates, agents, directors, officers or employees do not guarantee the accuracy, validity, timeliness or completeness, of any information or data made available and assume no liability as to any loss arising from any investment based on the same.


Forex-Time-LogoArticle by ForexTime

ForexTime Ltd (FXTM) is an award winning international online forex broker regulated by CySEC 185/12 www.forextime.com

Fibonacci Retracements Analysis 28.12.2020 (GOLD, USDCHF)

Article By RoboForex.com

XAUUSD, “Gold vs US Dollar”

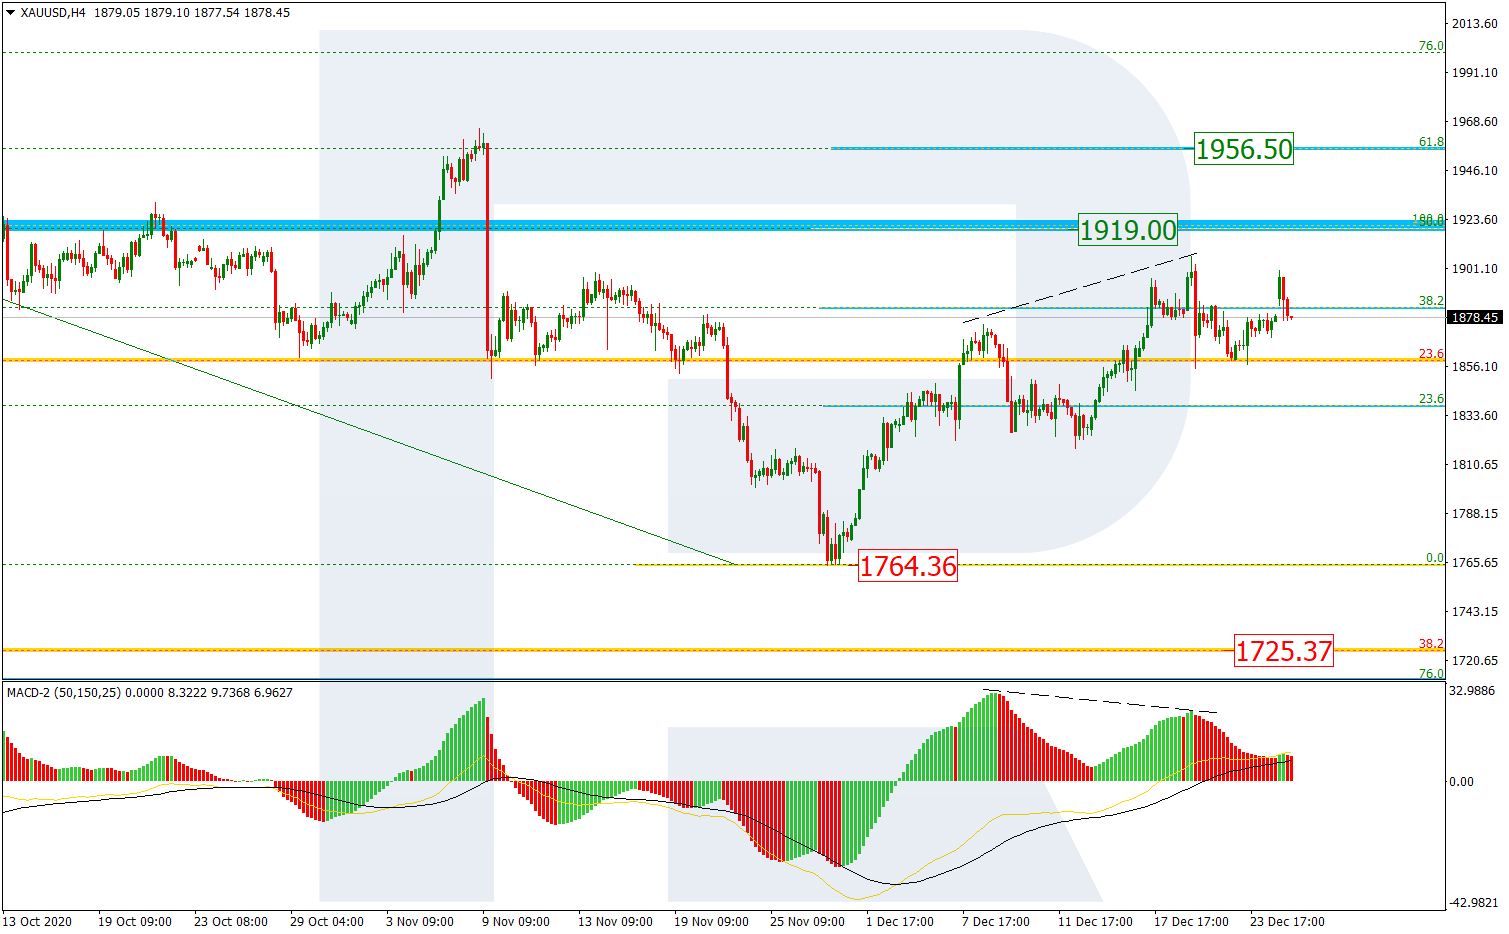
As we can see in the H4 chart, after completing the descending impulse, the asset started growing and has already tested the previous local high. If XAUUSD isn’t strong enough to start a new decline, then the price may continue growing to reach 50.0% and 61.8% fibo at 1919.00 and 1956.50 respectively. However, one shouldn’t disregard a divergence on MACD, which may hint at further mid-term decline towards the low at 1764.36. If the pair breaks this level, it will continue falling to reach the target at 38.2% fibo (1725.37).

GOLD_H4
Risk Warning: the result of previous trading operations do not guarantee the same results in the future

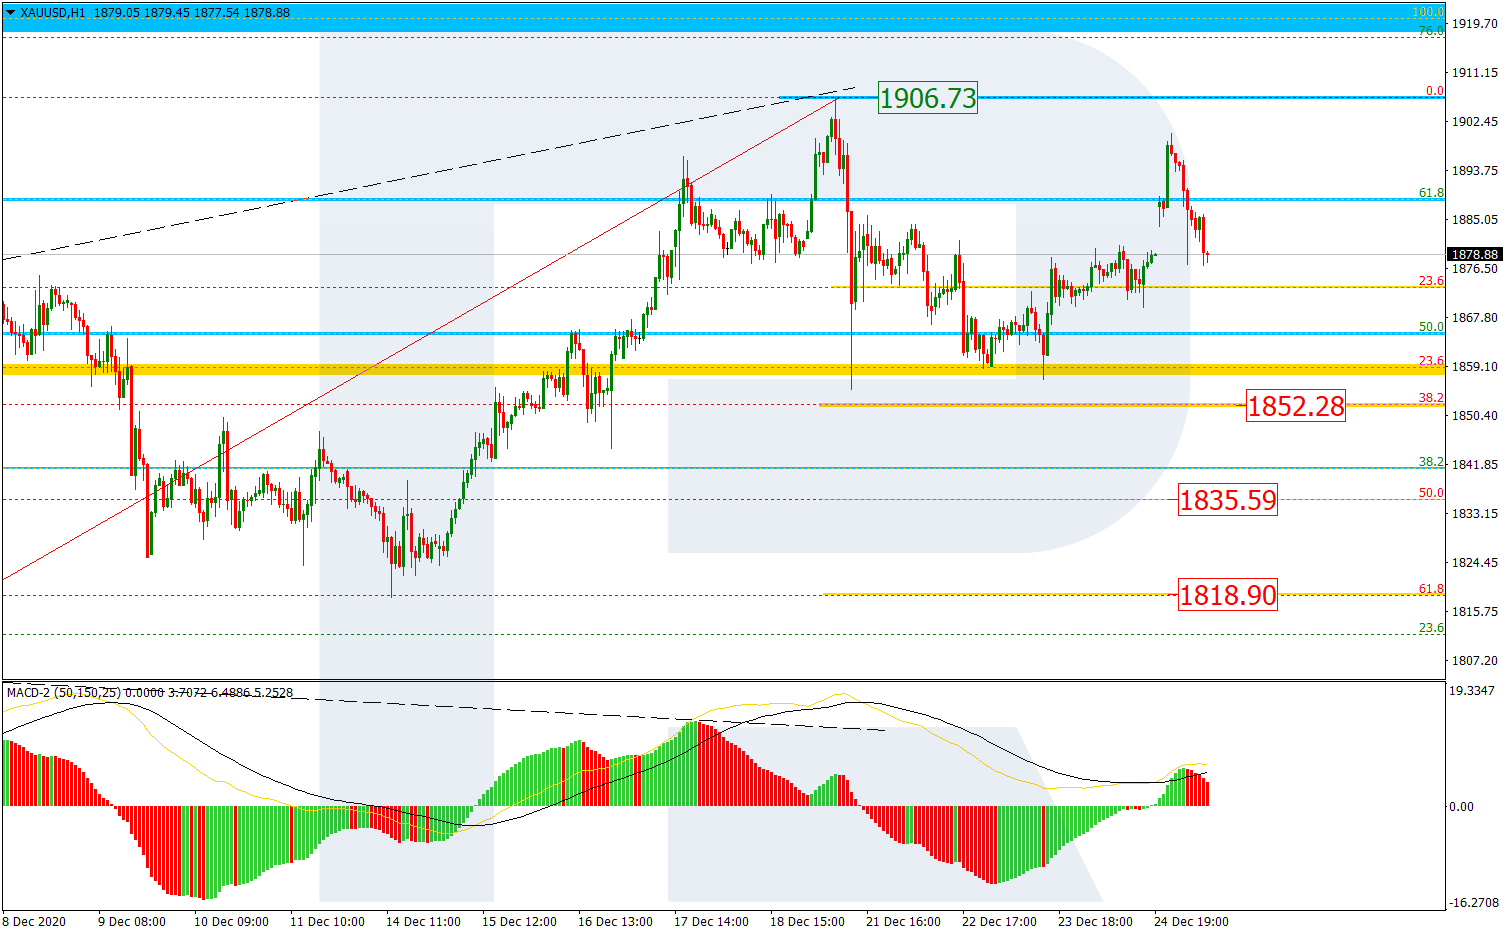
The H1 chart shows a more detailed structure of the current correction after a divergence on MACD. After breaking 23.6% fibo, it has yet failed to reach 38.2% fibo at 1852.28. The next downside targets may be 50.0% and 61.8% fibo at 1835.59 and 1818.90 respectively. However, a breakout of the local high at 1906.73 will result in further trend to the upside.

GOLD_H1
Risk Warning: the result of previous trading operations do not guarantee the same results in the future

USDCHF, “US Dollar vs Swiss Franc”

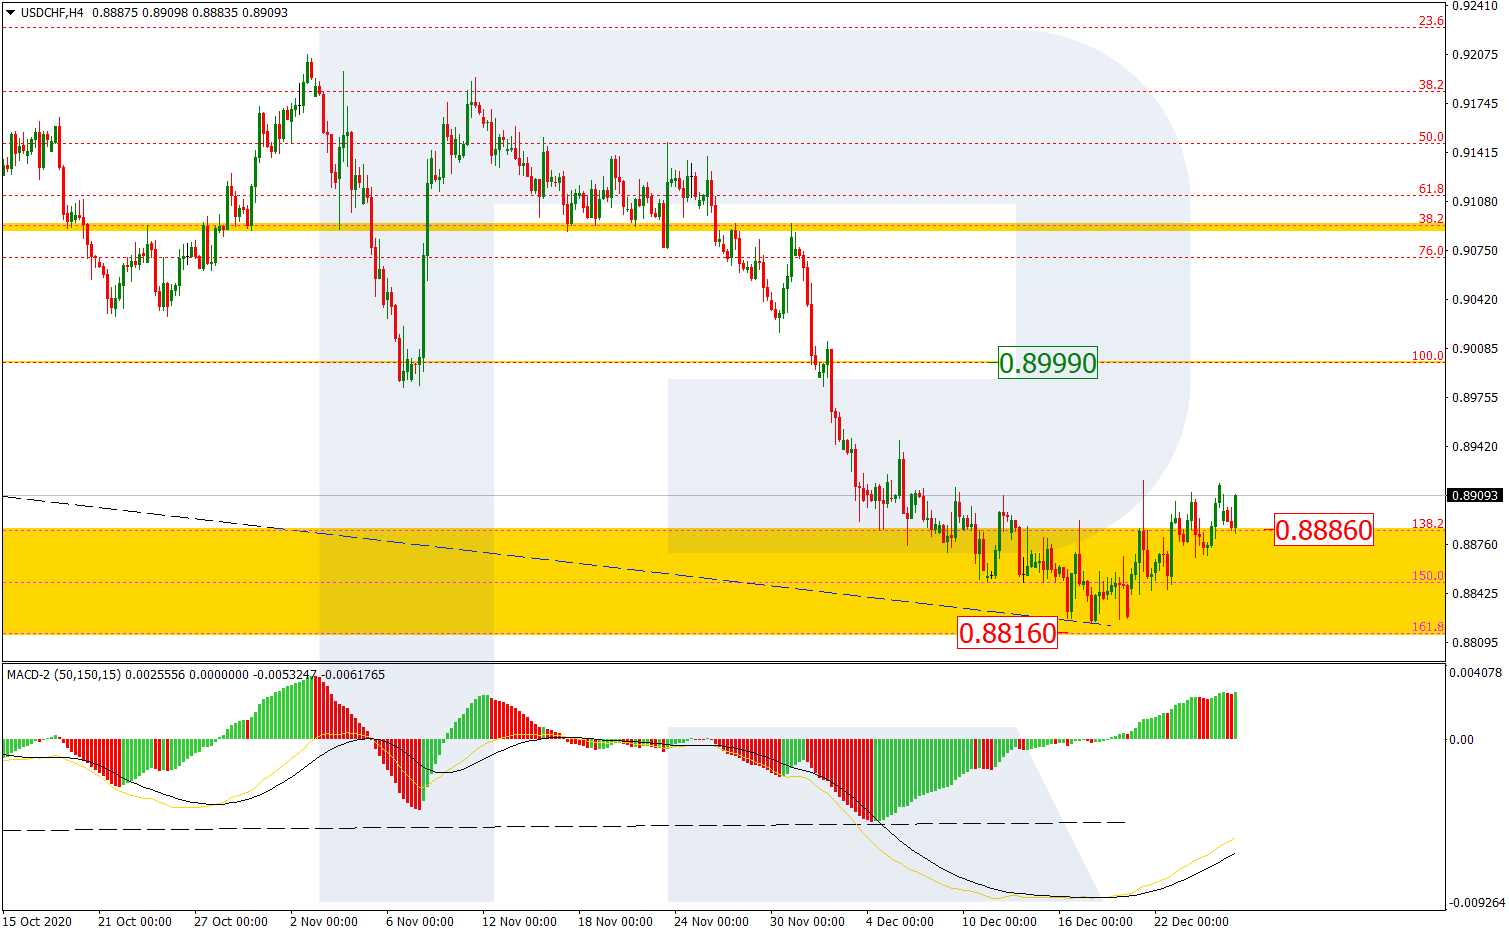
As we can see in the H4 chart, the situation hasn’t changed much. After leaving the post-correctional extension area between 138.2% and 161.8% fibo at 0.8886 and 0.8816 respectively to the upside, USDCHF is moving upwards and this growth can be considered as a correction after a long-term convergence on MACD. The correctional target remains at the resistance at 0.8999.

USDCHF_H4
Risk Warning: the result of previous trading operations do not guarantee the same results in the future

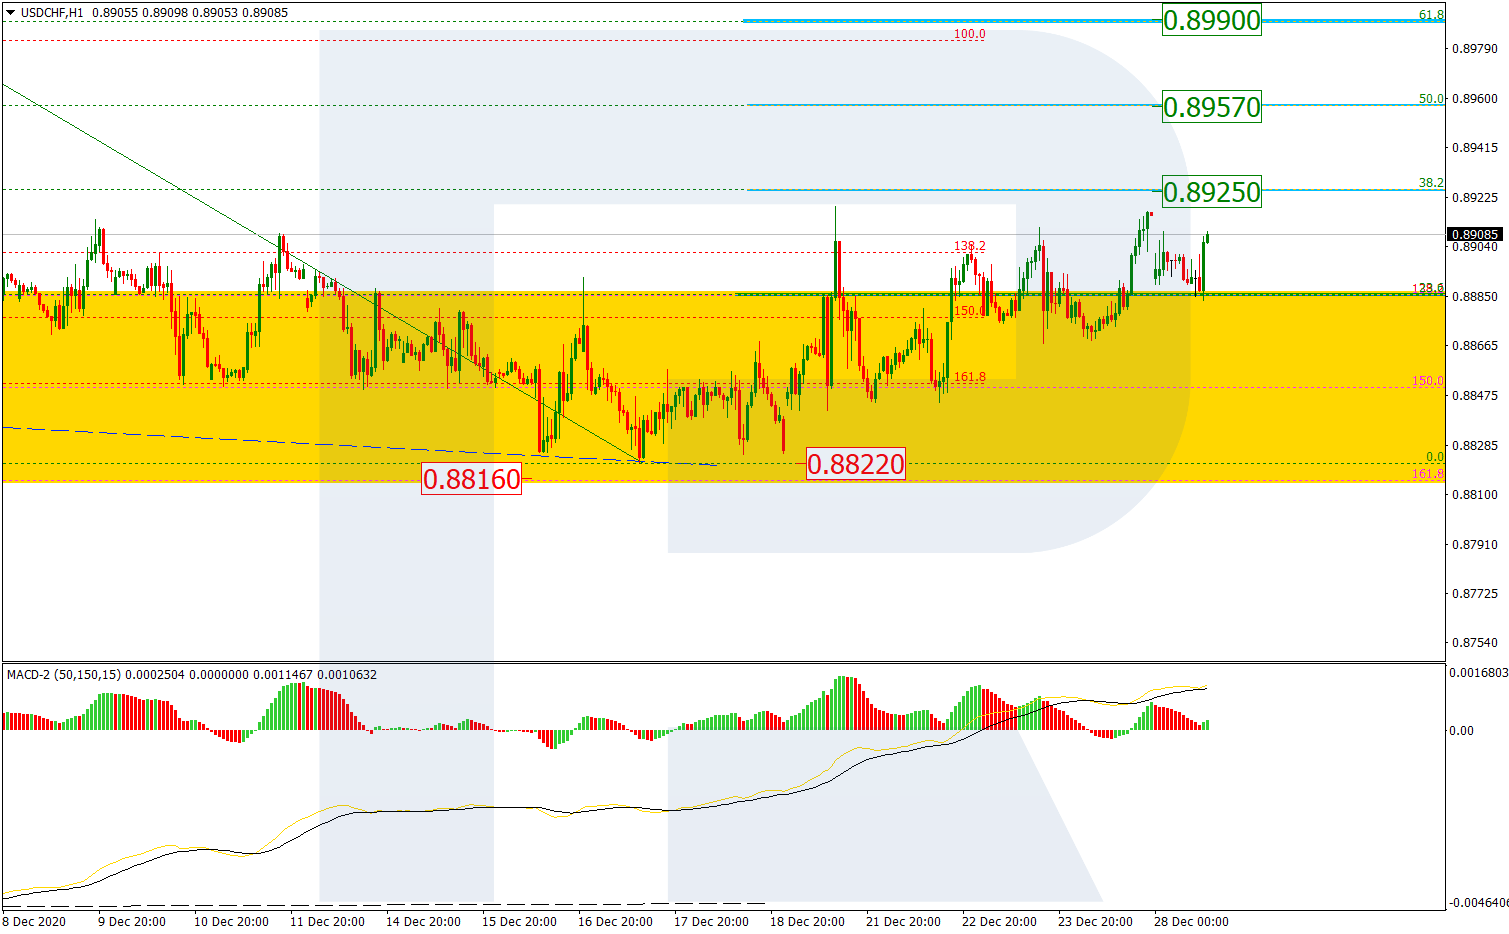
In the H1 chart, the pair is correcting upwards after a convergence on MACD. Judging by the price movement in this area, it is trying to fix above 23.6% fibo before further growth towards 38.2% fibo at 0.8926. Later, the market may continue growing towards 50.0% and 61.8% fibo at 0.8957 and 0.8990 respectively. A breakout of the support at 0.8822 will complete this correction.

USDCHF_H1

Article By RoboForex.com

Attention!
Forecasts presented in this section only reflect the author’s private opinion and should not be considered as guidance for trading. RoboForex LP bears no responsibility for trading results based on trading recommendations described in these analytical reviews.

The Analytical Overview of the Main Currency Pairs on 2020.12.28

by JustForex

The EUR/USD currency pair

Technical indicators of the currency pair:
  • Prev Open: 1.2185
  • Prev Close: 1.2177
  • % chg. over the last day: -0.07 %

On Thursday, EUR/USD was closed in the red zone despite the positive political background. The bearish intraday trend was likely driven by low liquidity ahead of the weekend close. But the currency pair remains in an uptrend by all indications. The signals about the change in the situation have not yet been received.

Trading recommendations
  • Support levels: 1.2151, 1.2130
  • Resistance levels: 1.2273

The main scenario: buying on a decline. The positive background from the political side supports the bulls in this pair. Technical indicators demonstrate the strengthening of the northern signal. The ADX is gradually growing as the price rises, and quotes were able to fix above the moving averages. However, the pair is still in the “triangle” pattern, which is alarming. A breakdown of the price of 1.2240 from the bottom up will give a more reliable northern signal.

Alternative scenario: if the price can fix below 1.2180, there is a possibility that the price will move further to 1.2130, and the break-through of the last point may signal a complete reversal.

EUR/USD
There is no news feed for today.

The GBP/USD currency pair

Technical indicators of the currency pair:
  • Prev Open: 1.3491
  • Prev Close: 1.3533
  • % chg. over the last day: +0,31 %

At the end of Thursday, the sterling managed to increase in value against the background of the positive political decisions for the market. During the Asian session, the pair continues to rise and tries to fix above the first resistance level. It should be considered that the liquidity will be low today since it is a day off in Britain and direction can change dramatically.

Trading recommendations
  • Support levels: 1.3287, 1.3187
  • Resistance levels: 1.3623

The main trading scenario: buying on a decline. The currency pair is close to its main resistance – the December maximum, the break-through of which will indicate further growth towards the April 2018 values ​​in the area of ​​1.40. Until a break-through has occurred, you should be vigilant. The chart is still showing a “double top” pattern, which may indicate a limitation of growth. The ADX shows weak growth dynamics, although the upward movement is reflected as the true one.

Alternative scenario: if the pair fixes below ​​1.3444, the northern scenario is likely to be canceled and the pair will be stuck in the range again.

GBP/USD
There is no news feed for today.

The USD/JPY currency pair

Technical indicators of the currency pair:
  • Prev Open: 103.55
  • Prev Close: 103.68
  • % chg. over the last day: +0.12 %

Calm trading in this currency pair continues. Volatility is gradually decreasing within a month. Despite the growth of the main stock index S&P 500, the yen makes minor attempts to increase in price against the dollar and the currency pair is declining again in the Asian session. The picture is becoming more and more confusing.

Trading recommendations
  • Support levels: 103.26, 102.89
  • Resistance levels: 103.73, 104.15

The main scenario: trading in a sideways range. The indicators start sending different signals. The ADX indicates growth as a true move with high potential. At the same time, the MACD moved into the negative zone, and the price fixed below the moving averages SMA 50 and SMA 100. The pair is likely to continue trading in a narrow sideways range for some time.

An alternative scenario assumes a break-through of 103.26 and the development of a further fall. In case of breaking 103.73, further growth to 104.15 or higher is likely.

USD/JPY
There is no news feed for today.

The USD/CAD currency pair

Technical indicators of the currency pair:
  • Prev Open: 1.2843
  • Prev Close: 1.2839
  • % chg. over the last day: -0.03 %

On Thursday, USD/CAD couldn’t keep the uptrend in trading. The growth of impetus has weakened. Oil quotes continued to rise amid positive results from the Brexit negotiations and decisions on a stimulus package for the economy in Washington. Being under pressure, the dollar index additionally hinders the growth of the pair.

Trading recommendations
  • Support levels: 1.2789, 1.2689
  • Resistance levels: 1.2954, 1.3079

The main scenario is range trading. Against the background of low market liquidity within the day, it is difficult to expect serious price changes. Even though the Canadian dollar has lost its growth momentum, the bears are in no hurry to attack. The price is still above the moving averages. The MACD is near zero. This indicates a slow sideways trend.

Alternative scenario: if the price manages to return below 1.2787, the southern trend may resume. A breakdown of 1.2954 will indicate renewed growth.

USD/CAD
There is no news feed for today.

by JustForex


This article reflects a personal opinion and should not be interpreted as an investment advice, and/or offer, and/or a persistent request for carrying out financial transactions, and/or a guarantee, and/or a forecast of future events.

Buoyant start to the final week

By Han Tan, Market Analyst, ForexTime

Markets are breathing a very big sigh of relief after what has been a tumultuous year which went to the wire with Brexit negotiations and US stimulus talks. Stocks futures Stateside are near record highs as EU-UK trade talks are wrapped up (for now) and President Trump finally signed off on the virus relief bill.

Risk sentiment is on the rise with European stocks and notably the German Dax trading up 1.5% to fresh new highs, above the previous top set back in February before the pandemic triggered a sharp global selloff in stocks. This is actually the first trading session in Europe since the Brexit trade deal was signed off, so it has given traders the first chance to react to that momentous agreement. UK markets are closed for a bank holiday.


Of course, markets are much thinner at this time of year and we sometimes see quite violent moves for no apparent reason. But it seems this year we are much calmer and the transition to the new year will be a lot smoother. That path has been made easier by the Trump signoff and the package should give a significant boost to the US economy next year. Indeed, Goldman Sachs economists think the world’s biggest economy will grow at an annualised pace of 5% in the first quarter of next year, an increase of 2% from their prior estimate.

Softer Dollar in quiet trade

The greenback is a touch milder today with the risk mood upbeat and bond markets offered. Traders are eyeing up the pivotal 1% yield in the US 10-year Treasury again as inflation expectations move higher once more. There is record treasury issuance this week with $176 billion worth of bonds being auctioned.

DXY lows are of course in play at 89.63 and if we do break and hold below here, then the February 2018 low at 88.25 offers the next line of support.


Sterling disappoints

Although a Brexit deal has been passed which means we will not see a rise in tariffs on goods after the end of the year, GBP is lower against the Euro and even the Dollar. Significant work and agreement are still needed on major industries which were not covered in the trade deal, especially financial services. Relations have no doubt also been scarred by the last few months and let’s not forget – this is one of the hardest possible Brexit outcomes.

Sterling bulls are desperately keen to aim for the recent cycle high at 1.3624 made on 17 December. We are squarely in the middle of the bullish channel from the September lows but there is little momentum in these thin markets at the moment.


Disclaimer: The content in this article comprises personal opinions and should not be construed as containing personal and/or other investment advice and/or an offer of and/or solicitation for any transactions in financial instruments and/or a guarantee and/or prediction of future performance. ForexTime (FXTM), its affiliates, agents, directors, officers or employees do not guarantee the accuracy, validity, timeliness or completeness, of any information or data made available and assume no liability as to any loss arising from any investment based on the same.


Forex-Time-LogoArticle by ForexTime

ForexTime Ltd (FXTM) is an award winning international online forex broker regulated by CySEC 185/12 www.forextime.com

Bitcoin Rallies Above $28,300 – Is This The Peak?

By TheTechnicalTraders 

– We hope you enjoyed the brief holiday break… it seems Bitcoin has been busy while the markets have been resting! Bitcoin enthusiasts are adamant that the price rally has just started a parabolic move higher.  From a technical standpoint, this current rally certainly appears to have gone parabolic.  As any trader already understands, what goes up may eventually come crashing downward.

My research team and I believe failure at the current highs would represent a clear technical divergence pattern between price and the RSI indicator. Additionally, the current rally that started on December 20 consists of a $10,850 rally phase.  The previous rally that took place from October 20 to December 2 consisted of a $9,200 rally phase.  We believe this current rally phase from December 11 could be a Wave 5 rally (almost equal to the Wave 3 rally range).  If our researchers are correct, this final rally phase could come crashing downward after reaching these peak levels above $28,000.

This 4 Hour Bitcoin chart highlights the incredible price rally that has taken place over the past 16+ days – a rally of over $10,000.  It also highlights two very clear price rally phases – creating an A-B-C price wave pattern.

This Daily Bitcoin chart highlights the two, almost identical in size, that we believe has created a price peak above $28,000.  It also highlights the technical divergence between price and the RSI indicator in the lower pane.

Be sure to sign up for our free market trend analysis and signals now so you don’t miss our next special report!

We believe this current peak may become a near term top in Bitcoin – possibly resulting in a downward price decline.  Critical support near $18~$20k is still very valid.  If Bitcoin prices collapse from these peaks, we believe the $18k to $20k level will become the next level for price to find support.

Overall, this incredible rally in Bitcoin prices before the end of 2020 has certainly proved the Bitcoin skeptics wrong and set the enthusiasts on fire.  At this point, we get to see what happens in early 2021 and if this $28k level will hold up.  One thing is certain, the past 30+ days have shown a massive rally potential in Bitcoin and other Cryptos – is this an excess phase peak or the start of a massive uptrend in 2021?

Our proprietary BAN (Best Asset Now) strategy allows us to know which assets are potentially the best performers in any type of market trend.  If you want to learn more about how we can help you with our proprietary tools and strategy then go to www.TheTechnicalTraders.com to learn more. Sign up today to get my daily pre-market analysis of the markets that walks you through the technical indicators of Bitcoin and the major asset classes.

Stay healthy!

Chris Vermeulen
Chief Market Strategist
www.TheTechnicalTraders.com

Oil Remains Above $51 Per Barrel

Author: Dmitriy Gurkovskiy, Chief Analyst at RoboForex

Despite falling slowly, the oil price remains quite high on Monday, December 28th. Brent is trading at $51.16 – investors are back to the market after a Christmas break and fully prepared to respond to the external background.

On one hand, a new aggressive strain of the coronavirus in the United Kingdom, Japan, and then other Asian countries, does not give much ground for optimism in the matter of the prospective demand for energies. Moreover, if this new strain is more dangerous and mobile, the world may face new closures of borders and lockdowns everywhere, in which case the global economy won’t recover anytime soon.

On the other hand, the media reports that the sector of cargo-carrying operations by sea has been extremely active during the final weeks. Of course, it might just be a local surge in activity before New Year, which will die down in January. However, everything is looking very good so far as the above-mentioned operations create an excellent demand for energies – what else does the oil need?

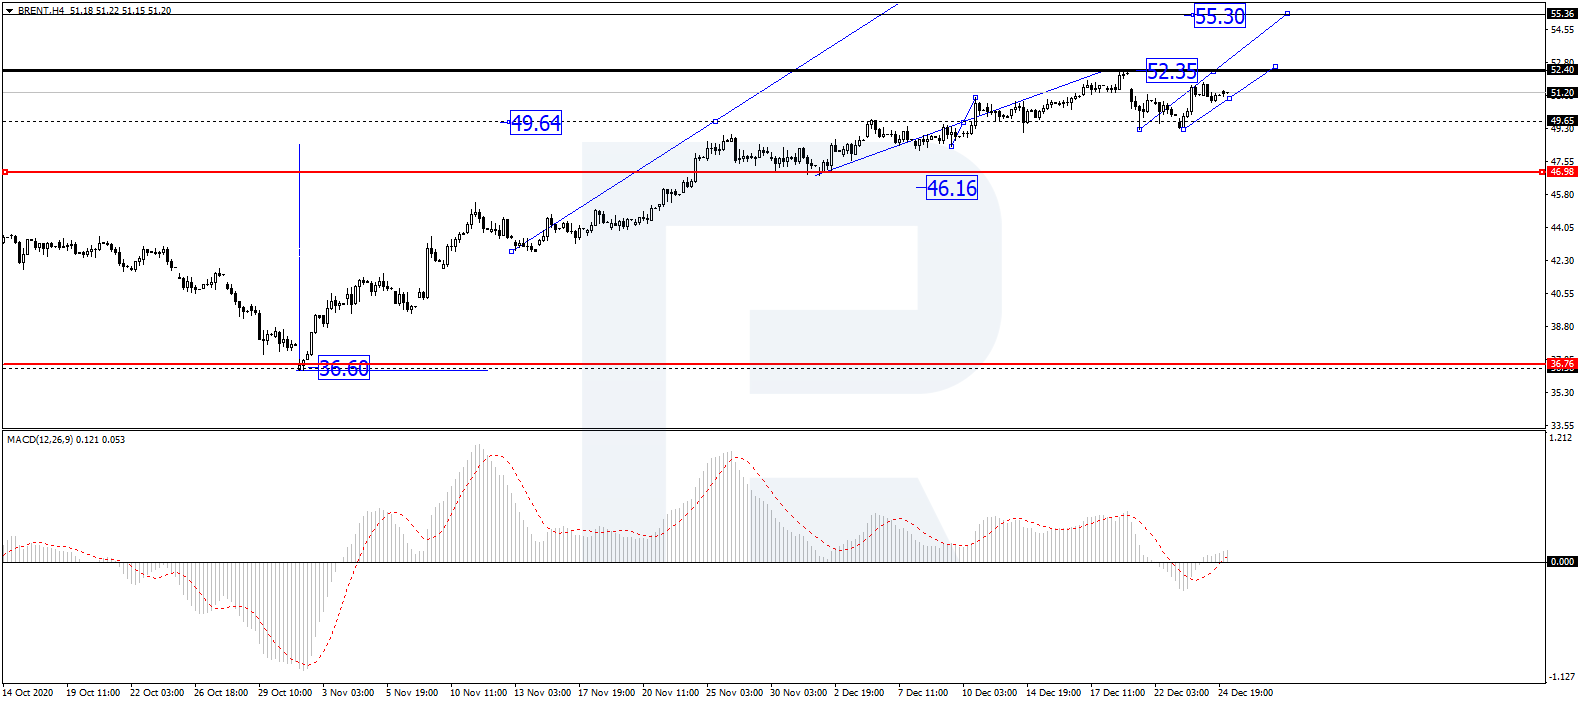
In the H4 chart, after finishing the ascending wave at 52.35 along with the correction towards 49.65, Brent is growing to break 51.11. Possibly, the asset may form another ascending wave to break 52.35 and then continue trading upwards with the short-term target at 55.30. From the technical point of view, this scenario is confirmed by MACD Oscillator: after leaving the histogram area, its signal line has broken 0 to the upside. Later, the line is expected to continue moving to the upside.

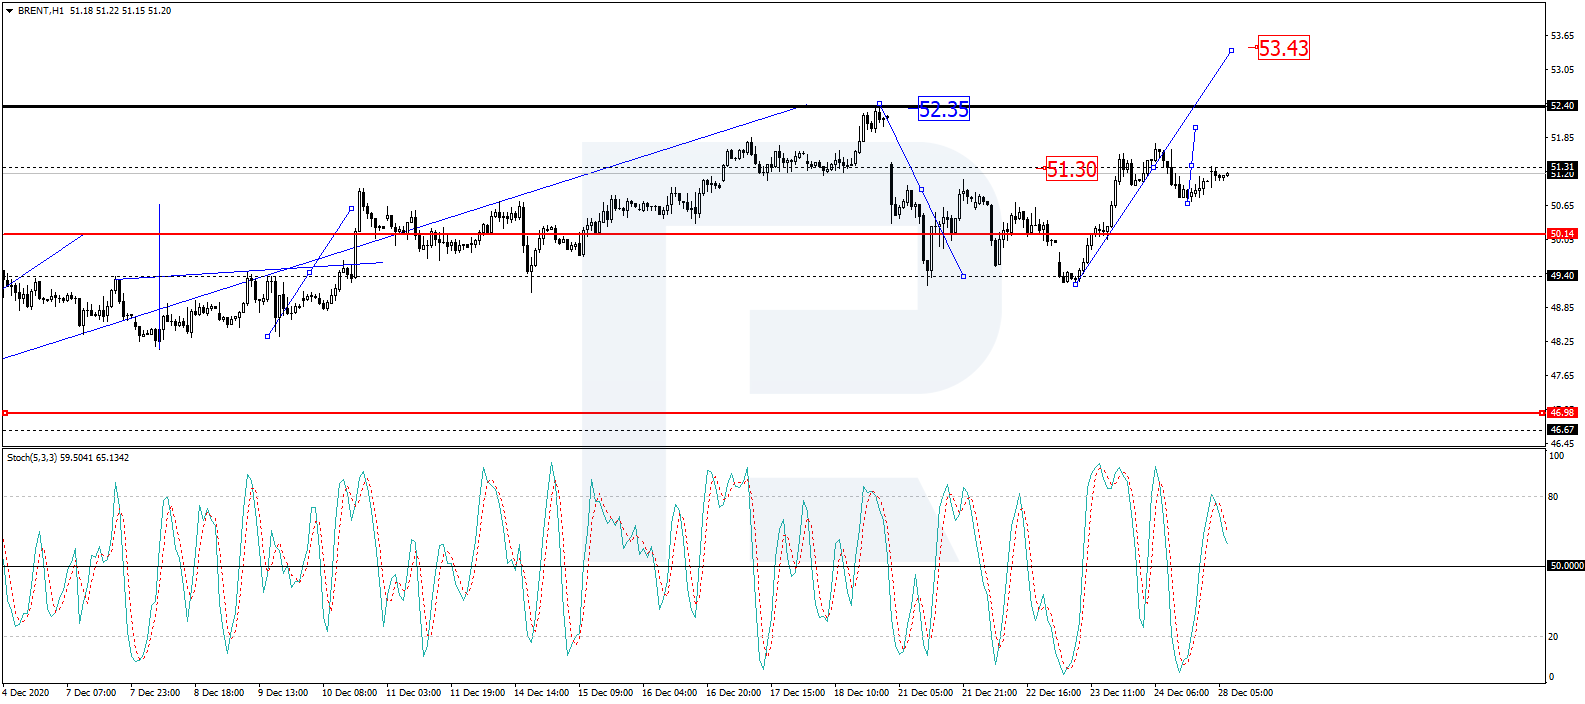
As we can see in the H1 chart, after completing the ascending wave at 51.30, Brent is consolidating below this level. If later the price breaks this range to the downside, the market may start a new correction to reach 50.10; if to the upside – resume trading upwards to break 52.50 and then continue growing with the target at 55.30. From the technical point of view, this idea is confirmed by Stochastic Oscillator: after breaking 50 to the upside, its signal line continues moving towards 80. After that, the line is expected to rebound from 80 and resume falling to return to 50. Later, there might be another rebound from 50 to the upside, which may lead to further growth towards 80 or even higher.

Disclaimer

Any forecasts contained herein are based on the author’s particular opinion. This analysis may not be treated as trading advice. RoboForex bears no responsibility for trading results based on trading recommendations and reviews contained herein.