
Author: Dmitriy Gurkovskiy, Chief Analyst at RoboForex
Despite falling slowly, the oil price remains quite high on Monday, December 28th. Brent is trading at $51.16 – investors are back to the market after a Christmas break and fully prepared to respond to the external background.
On one hand, a new aggressive strain of the coronavirus in the United Kingdom, Japan, and then other Asian countries, does not give much ground for optimism in the matter of the prospective demand for energies. Moreover, if this new strain is more dangerous and mobile, the world may face new closures of borders and lockdowns everywhere, in which case the global economy won’t recover anytime soon.
On the other hand, the media reports that the sector of cargo-carrying operations by sea has been extremely active during the final weeks. Of course, it might just be a local surge in activity before New Year, which will die down in January. However, everything is looking very good so far as the above-mentioned operations create an excellent demand for energies – what else does the oil need?
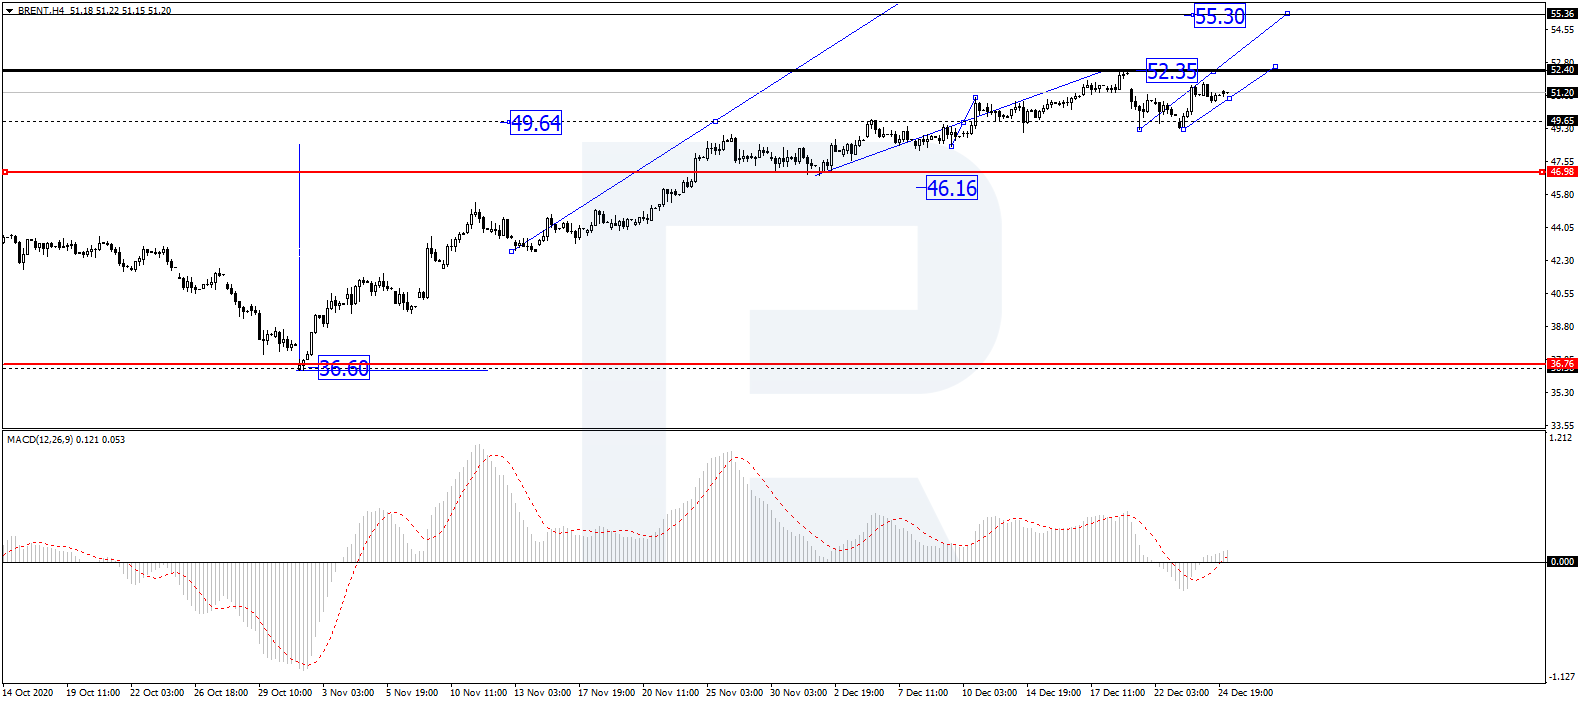
In the H4 chart, after finishing the ascending wave at 52.35 along with the correction towards 49.65, Brent is growing to break 51.11. Possibly, the asset may form another ascending wave to break 52.35 and then continue trading upwards with the short-term target at 55.30. From the technical point of view, this scenario is confirmed by MACD Oscillator: after leaving the histogram area, its signal line has broken 0 to the upside. Later, the line is expected to continue moving to the upside.
Free Reports:
 Get our Weekly Commitment of Traders Reports - See where the biggest traders (Hedge Funds and Commercial Hedgers) are positioned in the futures markets on a weekly basis.
 Download Our Metatrader 4 Indicators – Put Our Free MetaTrader 4 Custom Indicators on your charts when you join our Weekly Newsletter
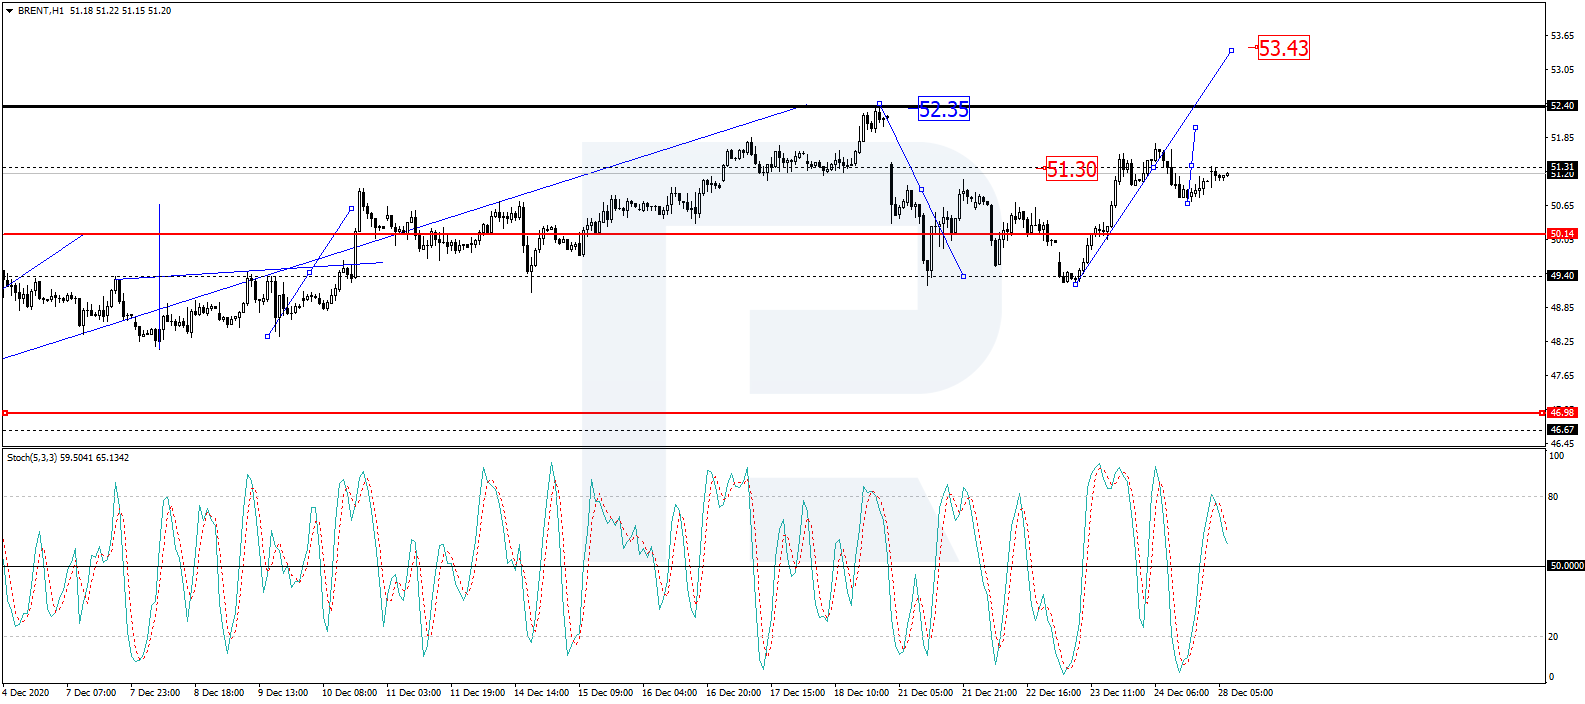
As we can see in the H1 chart, after completing the ascending wave at 51.30, Brent is consolidating below this level. If later the price breaks this range to the downside, the market may start a new correction to reach 50.10; if to the upside – resume trading upwards to break 52.50 and then continue growing with the target at 55.30. From the technical point of view, this idea is confirmed by Stochastic Oscillator: after breaking 50 to the upside, its signal line continues moving towards 80. After that, the line is expected to rebound from 80 and resume falling to return to 50. Later, there might be another rebound from 50 to the upside, which may lead to further growth towards 80 or even higher.
Disclaimer
Any forecasts contained herein are based on the author’s particular opinion. This analysis may not be treated as trading advice. RoboForex bears no responsibility for trading results based on trading recommendations and reviews contained herein.

- The US and European stock indices are rising again amid renewed investor interest in the AI industry. Jul 10, 2026
- USD/JPY Falls as Yen Recovers Weekly Losses Jul 10, 2026
- Crude oil prices surged sharply by 7% in reaction to the rapid escalation of the conflict in the Middle East Jul 9, 2026
- Middle East Tensions Weigh on Gold Jul 9, 2026
- Pound Awaits Tighter Policy from Bank of England Jul 8, 2026
- The United States carried out airstrikes on Iran after Iran’s attacked tankers in the Strait of Hormuz. The RBNZ raised the interest rate to 2.5% Jul 8, 2026
- RoboForex Brings Full-Scale Trading to Telegram Jul 7, 2026
- Your Bourse Integrates TradingView Charts and Trading Platform Library with Trade Server Jul 7, 2026
- Yen Still Under Pressure: Markets Await Action from Authorities Jul 7, 2026
- Germany’s DAX Index has updated its all‑time high. OPEC+ countries have agreed to increase production Jul 7, 2026