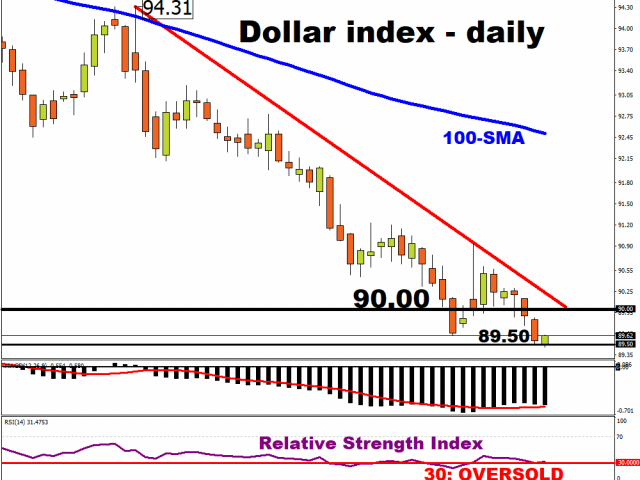
The end of the year is restful for investors. Indexes are at their highs, the dollar is at its lows

by JustForex

Despite the ongoing pandemic, the year on the stock exchanges is ending near historic highs. Bullish sentiment has lifted risky assets this year to unexpectedly high valuations on the expectation that vaccinations in 2021 will resume economic growth and boost corporate profits, amid unprecedented stimuli. The MSCI World Global Stock Index ended up growing 14% for the full year of 2020.

Banks and funds representatives see no reason to reverse. The conclusion of the Brexit agreement, the start of vaccinations and economic stimulus programs by central banks without expectations of an increase in interest rates can keep playing on the side of the bulls for a long time. The Fed, in its economic review, provided a projection in which the first rate hike could be only after 2023. Due to the more stable growth of inflation in the US compared to Europe, as well as huge cash injections into the economy, the downtrend in the dollar may continue next year.

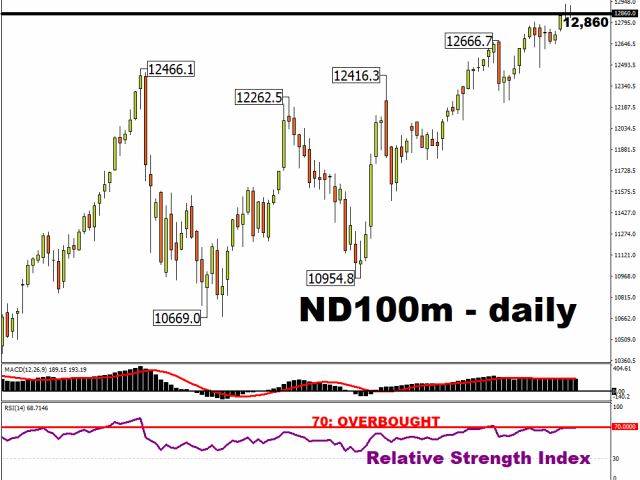
Against this background, the benchmark S&P 500 index confidently entrenched above 3700. Many analysts on Wall Street are convinced that there is nothing to prevent stocks from rising next year, and the index can rise above 4000.

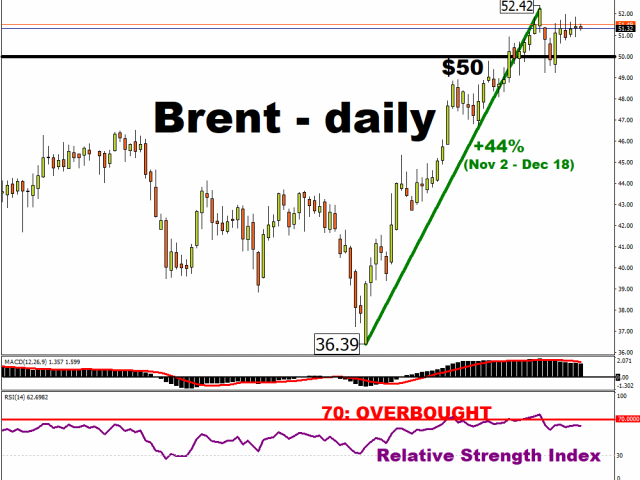
Expectations of economic growth are also observed in oil quotes. Brent oil is confidently holding above $ 50 per barrel, WTI is about $ 48. The manufacturing sector of advanced economies is gradually recovering, supporting the demand for black gold.

Major stock indexes are trading as usual and in different directions. The dollar index continues to decline.

S&P 500 (F) 3,717.62 -6.63 (-0,18%)

Dow Jones 30,409.56 +73.89 (+0.24%)

DAX 13,718.78 -42.60 (-0.31%)

FTSE 100 6,443.91 -111.91 (-1.71%)

USD Index 89.517 -0.132 (-0.15%)

Important events:
  • – 04:00 (GMT+2) Manufacturing PMI (Dec);
  • – 16:30 (GMT+2) Number of initial applications for unemployment benefits.

by JustForex


This article reflects a personal opinion and should not be interpreted as an investment advice, and/or offer, and/or a persistent request for carrying out financial transactions, and/or a guarantee, and/or a forecast of future events.

2020: A year of extraordinary uncertainty & unprecedented events

By Lukman Otunuga, Research Analyst, ForexTime

– It only felt like yesterday that the United States and China reached a ‘phase one’ trade deal and Parliament backed Boris Johnson’s plan to leave the European Union on 31st January 2020.

Such encouraging developments lifted investor confidence and raised optimism over the outlook for 2020. Unknown to all, the global economy was in store for a nasty shocker as a string of unforgettable and distressing events rocked financial markets – ultimately cementing their places in history.

2020 will be remembered for its extraordinary levels of uncertainty, unprecedented events, and periods of euphoria.

Things got messy in January when the largest economy in the world undertook a drone airstrike that killed top Iranian general Soleimani. Escalating tensions between the US and Iran fuelled fears around World War 3! Although Trump later toned down his rhetoric against Iran and even offered an olive branch, caution lingered in the air. The UK formally left the EU at 11 p.m. GMT on 31 January 2020. However, the country was given an 11-month transition period to negotiate a trade deal with the EU.

In February, caution transformed into fear as the novel coronavirus outbreak forcefully grabbed the headlines. After infecting thousands of people in China, the virus spread its poisonous tentacles across the four corners of the world. Concerns over the pandemic sabotaging global economic growth fuelled risk aversion and drained investor confidence.

When China sneezes, the world catches a cold

March was a pivotal month for the global economy as swelling coronavirus cases forced well over 100 countries to enforce either a full or partial lockdown, affecting billions of people. The extraordinary levels of uncertainty resulted in global shares suffering their worst fall since the 2008 financial crisis. In a fight against the global pandemic, the Federal Reserve cut interest rates to zero and launched a massive $700 billion quantitative easing program to shield the US economy. It did not end here. Trump later signed a historic $2.2 trillion emergency relief package into law.

It was all gloom and doom in April as the confirmed global coronavirus cases surpassed 1 million. The IMF’s gloomy warning around the global economy suffering its worst blow in almost a century added insult to injury. Central banks across the world joined the easing bandwagon in a desperate attempt to protect their economies against the negative impacts of COVID-19. In the commodities space, investors received a real shocker when Oil prices went sub-zero for the first time in history as the pandemic destroyed demand for transportation fuel. With storage capacity reaching its limit, sellers were paying buyers to take the commodity of their hands!

US oil prices turned negative for the first time in history in April amid the deepest fall in demand in 25 years

China was in the spotlight in May after imposing a draconian national security law on Hong Kong. The return of geopolitical tensions at a time where the world economy was dealing with COVID-19 blunted risk appetite. Adding to the woes was the fact the confirmed global coronavirus cases surpassed 5 million. However, some light was offered at the end of the tunnel thanks to hopes around a coronavirus vaccine.

The unprecedented fiscal and monetary policy support from governments and central banks fuelled expectations around a ‘V’ shape economic recovery in June. Such a recovery means that the economy bounces back quickly to its baseline before the crisis, with no hiccups along the way.

As vaccine hopes fuelled the risk-on rally, there was no love for the Dollar in July. Given its status as a prime destination of safety, the improving market mood made it an easy target for investors. Technology stocks were able to shine through the chaos in July, propelling the global equities higher. However, investors were later dragged back down to reality after US GDP contracted by 32.9% in Q2, it’s lowest economic growth since the government started keeping records in 1947.

Gold’s explosive momentum to all-time highs was akin to a speeding train reaching full velocity with the fundamentals keeping the engines running at maximum capacity

All that glittered was Gold in August as the precious metal made history by hitting an all-time high above $2075 an Ounce. Interestingly, news around Russia registering the first coronavirus vaccine improved market sentiment which in-turn punished the Dollar further. In the United Kingdom, data confirming that the economy nosedived into recession for the first time since the financial crisis compounded the Pounds woes. On a brighter note, Apple hit a market capitalization of $2 trillion.

The focus shifted towards the presidential race in September. Investors who were hoping for clarity on future policy were left empty-handed after the first presidential debate between Donald Trump and Democratic presidential nominee Joe Biden degenerated into a surreal shouting match. On the COVID-19 front, the number of confirmed cases across the globe surpassed 30 million.

October was pretty much defined by the US stimulus talks and whether there would be a breakthrough on a new fiscal stimulus bill before the election day.

Biden’s win changes the mood music for markets and eliminates an element of uncertainty

In November, the biggest highlight was Joe Biden’s victory in the presidential election. There was a collective sigh of relief across the world after the drug companies Pfizer and BioNTech announced that their coronavirus vaccine was 90% effective. Optimism around the vaccine bringing back normality sent the S&P 500 to all-time highs while the Dow Jones cleared 30,000 for the first time. It did not end here, Tesla’s market cap rallied above $500 billion for the first time.

Anyone expecting the final month of 2020 to be chilled ahead of Christmas and the new year were left disappointed. As the market mood improved on vaccine hopes, the Dollar tumbled to levels not seen in more than 2-1/2 years. The United Kingdom became the first country in the world to approve the Pfizer/BioNtech. In the States, Tesla joined the prestigious S&P 500 index on December 21st while after months of stalled negotiations, Congress finally passed a $900 billion COVID-19 relief bill. This was not the only breakthrough. After nine months of tense talks, the UK and EU were able to reach an agreement on a post-Brexit trade deal before the transition deadline on 31st December. The cherry on the cake was Bitcoin rallying to an all-time high above $28.5k.

There is no doubt that 2020 was a year defined by COVID-19, chaos, and uncertainty. However, 2021 may be seen as a year of hope and a return to normality as countries distribute vaccines. Will COVID-19 remain a major theme in 2021? How will Biden’s victory impact the US economy? Is this truly the end of Brexit? Will the new trading year offer as much volatility as 2020?

For now, these questions remain a mystery but 2021 could provide the answers.

Disclaimer: The content in this article comprises personal opinions and should not be construed as containing personal and/or other investment advice and/or an offer of and/or solicitation for any transactions in financial instruments and/or a guarantee and/or prediction of future performance. ForexTime (FXTM), its affiliates, agents, directors, officers or employees do not guarantee the accuracy, validity, timeliness or completeness, of any information or data made available and assume no liability as to any loss arising from any investment based on the same.


Forex-Time-LogoArticle by ForexTime

ForexTime Ltd (FXTM) is an award winning international online forex broker regulated by CySEC 185/12 www.forextime.com

Key events in first full week of 2021

By Han Tan, Market Analyst, ForexTime

Much has already been made of the year that was. 2020 was unprecedented in so many ways, which made it truly unforgettable.

And while the world will understandably be hoping for some calm and serenity as they ring in the new year, investors will have to remain vigilant because 2021 is set to kick off on an eventful note for global financial markets.

  • Monday, 4 January: OPEC+ decision on February output
  • Tuesday, 5 January: Georgia Senate runoffs
  • Wednesday, 6 January: Last chance saloon for Trump’s election challenge
  • Friday, 8 January: US December non-farm payrolls


Monday, 4 January: OPEC+ decision on February output

OPEC+ is scheduled to decide on their output levels for February 2021at the onset of the week, as they attempt to maintain a fine balance between members’ fiscal funding demands and a global outlook that remains uncertain.

Another output hike should keep Oil rangebound, while a no-change decision could lift the commodity’s prices higher.

But with Saudi Arabia Energy Minister Crown Prince Abdulaziz bin Salman stating his intent to keep speculators on their toes, Oil markets could face a tense start to the first full week of the new year.


Tuesday, 5 January: Georgia Senate runoffs

The outcome from this political contest could well set the tone for US equities for the year ahead. Should Democrats win those two Senate seats that are up for grabs, US stock benchmarks could push higher on expectations for more incoming fiscal stimulus under the Biden administration.

However, tech stocks may flounder on anticipation of more regulations and potential corporate tax hikes, as is typically associated with a Democrat in the White House.

Expect delays to the official runoff results a la November’s presidential election.


Wednesday, 6 January: Last chance saloon for Trump’s election challenge

The US Senate and the House are set to officially count the electoral votes for the next US President.

President Trump’s ardent supporters within Congress have threatened to thrown a wrench into the works so as to keep him in the White House. However, according to the Congressional Research Service, this process within Congress has never been able to overturn the presidential election outcome to date.

Such an event could blindside investors and trigger wild gyrations in global financial markets, potentially triggering a rebound in the US Dollar index.


Friday, 8 January: US December non-farm payrolls

The upcoming US jobs report could well have a major say on the US monetary and fiscal policy outlooks. Markets are expecting an NFP print of just 85,000 jobs added in December, which is a far cry from the 1.6 million jobs that were added monthly on average over the six months prior. A worse-than-expected reading would light a fire under the incoming administration to roll out even more fiscal stimulus.

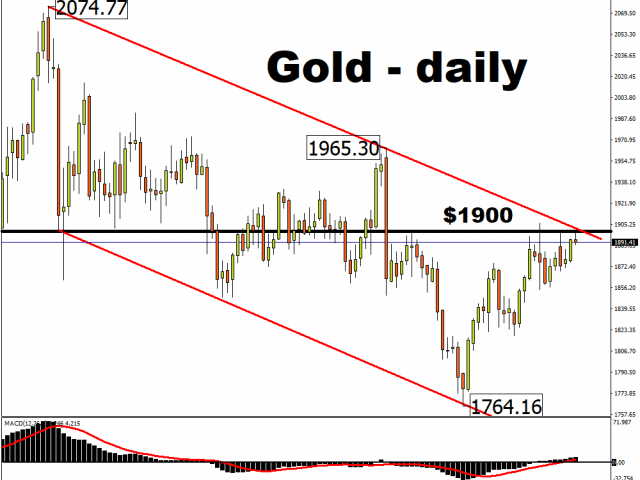
Such a narrative may help Gold prices break out of the upper bounds of its current downtrend and stay above the psychologically-important $1900 level.


Disclaimer: The content in this article comprises personal opinions and should not be construed as containing personal and/or other investment advice and/or an offer of and/or solicitation for any transactions in financial instruments and/or a guarantee and/or prediction of future performance. ForexTime (FXTM), its affiliates, agents, directors, officers or employees do not guarantee the accuracy, validity, timeliness or completeness, of any information or data made available and assume no liability as to any loss arising from any investment based on the same.


Forex-Time-LogoArticle by ForexTime

ForexTime Ltd (FXTM) is an award winning international online forex broker regulated by CySEC 185/12 www.forextime.com

Pfizer vaccine final results: it’s highly protective – but how long for?

By Anne Moore, University College Cork 

– The Pfizer/BioNTech vaccine for COVID-19 has reached the end of clinical trials and is now being rolled out in multiple countries. Regulatory bodies in the UK, Canada and the US have granted temporary or emergency use authorisation for the vaccine to be given to the public.

This is a landmark moment. Building a biological barrier against the virus is now a possibility. A highly effective vaccine, used in combination with current physical barriers, raises hope that bringing an end to the pandemic is achievable.

And after the tantalising interim results released by Pfizer last month, we can now see the full peer-reviewed results of its phase 3 trial. Here’s what they tell us.

Safety and efficacy confirmed

Approximately 37,000 people were included in the trial’s safety analysis. Half received two doses of the vaccine, the other half a saline placebo injection.

Importantly, the vaccine was tested in people at higher risk from COVID-19. Just over 40% of the participants were over 55 years old, about one-third were overweight and another third were obese. Individuals with pre-existing conditions that increase vulnerability – such as diabetes, pulmonary disease and HIV – were also included.

However, the vaccine was tested in some groups more than others. The majority (83%) of participants were white, and most of the trial (77%) occurred in the USA (with additional participants in Argentina, Brazil and South Africa). As is common, pregnant women were excluded, and will likely be excluded from vaccination programmes too until we understand whether these vaccines are safe to use during pregnancy.

Nevertheless, the safety profile of the vaccine is good – across different ages, ethnicities, both sexes and in individuals with pre-existing diseases.

Some participants reported side-effects after being immunised, such as headaches, fatigue or pain at the injection site. Most of these reactions were mild to moderate, and they resolved themselves within three days. No further reactions were reported afterwards for at least two months after the second immunisation.

Analysis of over 36,000 individuals was used to calculate the vaccine’s efficacy (the percentage of people it protected from the disease under controlled conditions). Nine vaccinated participants became infected with the virus, compared with 169 individuals injected with the placebo. This equates to 95% efficacy. Most importantly, protection was high across different groups, regardless of age, ethnicity or underlying health conditions.

Some participants became infected in between taking the first and second doses, highlighting the need to get the second dose (efficacy after just the first dose was only 52%). If you take both doses, it’s very likely you’ll be protected from COVID-19, at the very least in the short term.

But still a lot find out

Overall, this trial provided confidence in the vaccine’s efficacy and robustly documented its safety. However, this doesn’t mean the study shows what will happen in the real world. We cannot presume that the experiences of 19,000 vaccinated individuals will extrapolate to millions of people.

It’s impossible to detect less common side-effects, for example. This is why very close monitoring of the vaccine now needs to happen as it rolls out, and authorities will need to rapidly respond if people have unexpected reactions to it. Decisive action has already been seen in the UK in response to previously unseen side-effects in people with a significant history of allergic reactions.

Similarly, it’s possible that the efficacy of the vaccine in the real world – what we call its effectiveness – may also decrease as it is used in more diverse populations and over longer time periods.

And there are still key questions that need to be answered – particularly around the length of protection the vaccine will offer. It’s almost certain that the immune response initially generated will wane over time. We don’t yet know the lowest amount of immunity that needs to be retained to protect against infection, nor what type of immunity provides this protection.

If vaccine-induced immune responses – such as antibodies or T cells – can wane to very low levels but still prevent infection, then this vaccine will protect people for a long time. But if immune responses must be constantly kept high for protection, it won’t.

At present, we only have two methods to find out which is the case. The first is to continue monitoring the effects of the vaccine in the clinical trial participants. But to get a robust answer, there will have to continue to be people in the unvaccinated, placebo arm of the study, which poses an ethical question. How do you balance the need to retain a placebo cohort with the rights of all participants to be able to access a successful vaccine? The trial protocol suggests that follow-up should last for 24 months after vaccination.

This balance might be achieved by initially prioritising vaccination for the most vulnerable placebo participants and aiming to persuade the less vulnerable participants to remain in the trial. But if huge numbers of participants leave the trial, then the robustness of the analysis will deteriorate. We would then never know with good confidence how well this vaccine works over time.

The second method would be to expose people to SARS-CoV-2 under controlled conditions and see what happens (these experiments are known as human infection studies. Such trials are being planned in the UK and should be very powerful tools for finding out the levels and types of immunity needed to protect against infection in the long term.The Conversation

About the Author:

Anne Moore, Senior Lecturer in Biochemistry and Cell Biology, University College Cork

This article is republished from The Conversation under a Creative Commons license. Read the original article.


Price Amplitude Arcs/Gann Suggest A Major Peak in Early April 2021 – Part I

By TheTechnicalTraders 

– W.D. Gann mastered price trends (angles/slope) and time in relation to predicting future price trends and peaks/troughs.  Over the years, my team and I have done some research related to W.D. Gann’s theories and have come to a simple understanding of some of these concepts.  In this article, we will review his primary theory that past price trends may help to predict future price peaks using angles/slopes and time factors.

Monthly SPY Chart Showing Key Price Trendline

After the bottom in 2009 at the peak of the Credit Crisis, a new upward price trend set up a very clear price slope by tracking the lows from 2009 through 2010.  We’ve drawn a CYAN colored line across those lows on the Monthly SPY chart (below).  As we follow this trend through the 2011 to 2020 price activity, you can see this trendline was breached in late 2011 – where this upward sloping trendline became a resistance level going forward.  In 2015, price briefly touched this CYAN trendline, and just recently, in 2020, price again touched and breached this trendline.

Our understanding of Gann’s theory is that these angles/slopes/trendlines are important in understanding where price may target future peaks or troughs.  But it is more important to understand how price reacts to these future peaks/troughs and IF price confirms the expected actions when they reach these peaks/troughs.  With price briefly breaching the CYAN trendline, we are asking ourselves “if price fails after reaching levels above this trendline, does this confirm as a major price peak or not”?

You can also see our proprietary Fibonacci Price Amplitude Arcs drawn on the chart above.  We believe these are aligned with price energy frequencies and help us to understand where and when price inflection points may occur.  It may be difficult for you to see the multiple Fibonacci Price Amplitude Arcs that align near the current price high, but there are three unique Fibonacci Price Amplitude arcs spanning this peak.

  1. The $373.92 Arc aligning from the February 18, 2020 peak
  2. The $370.30 Arc aligning from the March 23, 2020 bottom
  3. The $364.04 Arc aligning from the March 20, 2000 peak

We believe it is important to see how price reacts to the current potential peak setup after reaching the CYAN upward sloping price channel/line near these inflection points.  If price fails to establish any support above the $379~380 price level on the SPY, then a technical failure will have set up – likely prompting a moderately strong downside price trend in the near future.

Be sure to sign up for our free market trend analysis and signals now so you don’t miss our next special report!

Our understanding of Gann price trends and their future predictions is that price may attempt to target/reach levels predicted by these slopes/trends in the future. Having said that, it is critical to understand what price does when it reaches these levels and why.

In some ways, our Fibonacci Price Amplitude Arcs may be similar to Gann’s Law of Vibration concept – where price trends originate in the rotational/vibrations of price itself.  Here, price is consistently acting in a manner that portrays the underlying energy frequency/amplitude/vibration waves driving the trends.  Think of these as multiple price/time/energy waves that perpetuate price trends, peaks, troughs, and various structures in price over multiple time-frames.  Gann’s study of price was not limited to one aspect of time/price as he applied his theories across many time-frames and price elements.

Many traders already know that W.D. Gann predicted that the end of the great bull market would happen on September 3, 1929, and that a panic selling would take place afterward. He was spot on. Throughout his life, Gann authored many books and attempted to share the knowledge he gained by attempting to explain how the “Law of Vibration” was the “Master Key” to understanding all aspects of natural life and mathematics. You can learn more about Gann and his work at http://time-price-research-astrofin.blogspot.com/p/wd-gann.html.

Weekly SPY Chart Showing Key Price Trendline

The following Weekly chart of the SPY highlighting the key upward sloping trend line suggests that what happens with price at this current critical price level will likely determine the future trends and outcome for investors.  We have not applied any time factoring onto this chart yet, we are simply applying trend slope analysis to this chart and suggesting this critical breach of the upward sloping price channel (CYAN line) is aligned with W.D. Gann’s theories and may serve as a very timely warning about future price trends and corrections for skilled traders.  If price fails to rally above the CYAN level and/or sets up a broader market top over the next few weeks and months, this trendline setup may become very relevant.

In the second part of this research article, we will apply Gann Price/Time cycles to our research to show you exactly where and how the April 2021 price peak may setup.  The possibility that our Fibonacci Price Amplitude Arcs align with W.D. Gann’s Law of Vibration theory and may work together to help us unlock major price inflection points is simply incredible.  For our research team, it suggests that we are on the cusp of being able to see more accurate and timely data for our members and to be able to prepare for and trade some of the biggest trends that setup.

Are you ready for this major potential peak in the markets?  Do you know how to trade the next 60 to 90+ days to protect your assets and find profits from the best assets to own?  Learn how our BAN, Best Asset Now, technology can help you find and execute better trades.  Visit www.TheTechnicalTraders.com to learn more.

Enjoy the rest of this short week!

Chris Vermeulen
Chief Market Strategist
www.TheTechnicalTraders.com

Ichimoku Cloud Analysis 30.12.2020 (USDJPY, EURUSD, AUDUSD)

Article By RoboForex.com

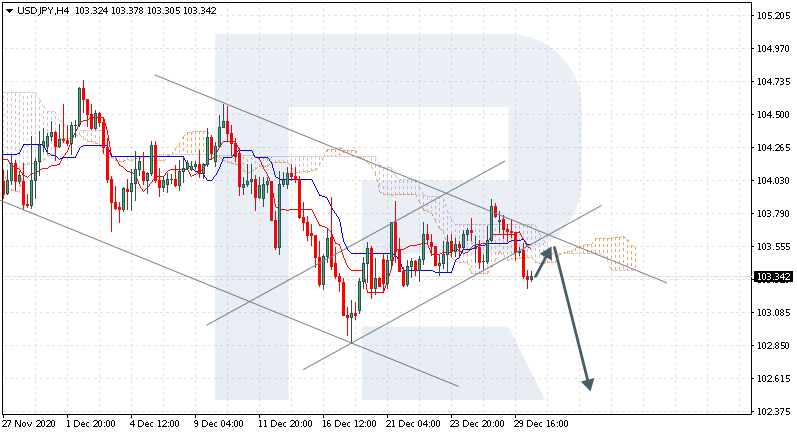
USDJPY, “US Dollar vs Japanese Yen”

USDJPY is trading at 103.34; the instrument is moving below Ichimoku Cloud, thus indicating a descending tendency. The markets could indicate that the price may test the cloud’s upside border at 103.55 and then resume moving downwards to reach 102.45. Another signal in favor of further downtrend will be a rebound from the rising channel’s downside border. However, the bearish scenario may no longer be valid if the price breaks the cloud’s upside border and fixes above 103.95. In this case, the pair may continue growing towards 104.75.

USDJPY
Risk Warning: the result of previous trading operations do not guarantee the same results in the future

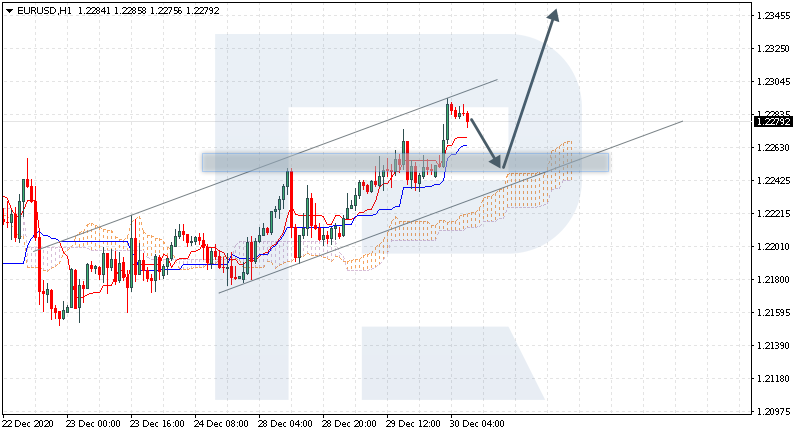
EURUSD, “Euro vs US Dollar”

EURUSD is trading at 1.2279; the instrument is moving above Ichimoku Cloud, thus indicating an ascending tendency. The markets could indicate that the price may test the cloud’s upside border at 1.2255 and then resume moving upwards to reach 1.2345. Another signal in favor of further uptrend will be a rebound from the rising channel’s downside border. However, the bullish scenario may be canceled if the price breaks the cloud’s downside border and fixes below 1.2205. In this case, the pair may continue falling towards 1.2115.

EURUSD
Risk Warning: the result of previous trading operations do not guarantee the same results in the future

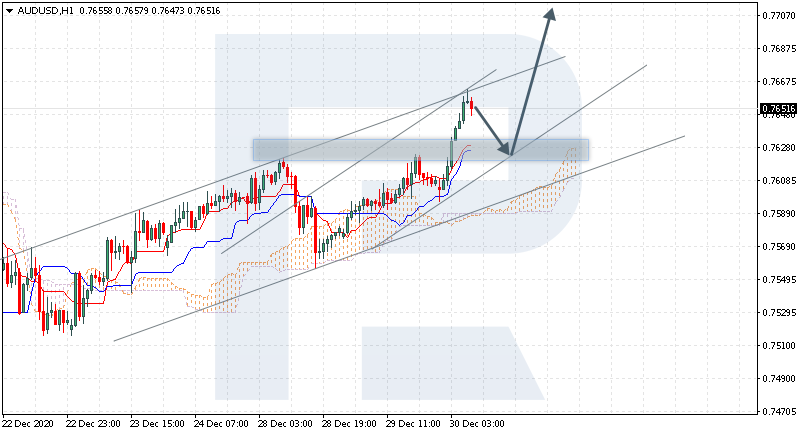
AUDUSD, “Australian Dollar vs US Dollar”

AUDUSD is trading at 0.7651; the instrument is moving above Ichimoku Cloud, thus indicating an ascending tendency. The markets could indicate that the price may test Tenkan-Sen and Kijun-Sen at 0.7625 and then resume moving upwards to reach 0.7705. Another signal in favor of further uptrend will be a rebound from the rising channel’s downside border. However, the bullish scenario may no longer be valid if the price breaks the cloud’s downside border and fixes below 0.7575. In this case, the pair may continue falling towards 0.7485.

AUDUSD

Article By RoboForex.com

Attention!
Forecasts presented in this section only reflect the author’s private opinion and should not be considered as guidance for trading. RoboForex LP bears no responsibility for trading results based on trading recommendations described in these analytical reviews.

Japanese Candlesticks Analysis 30.12.2020 (USDCAD, AUDUSD, USDCHF)

Article By RoboForex.com

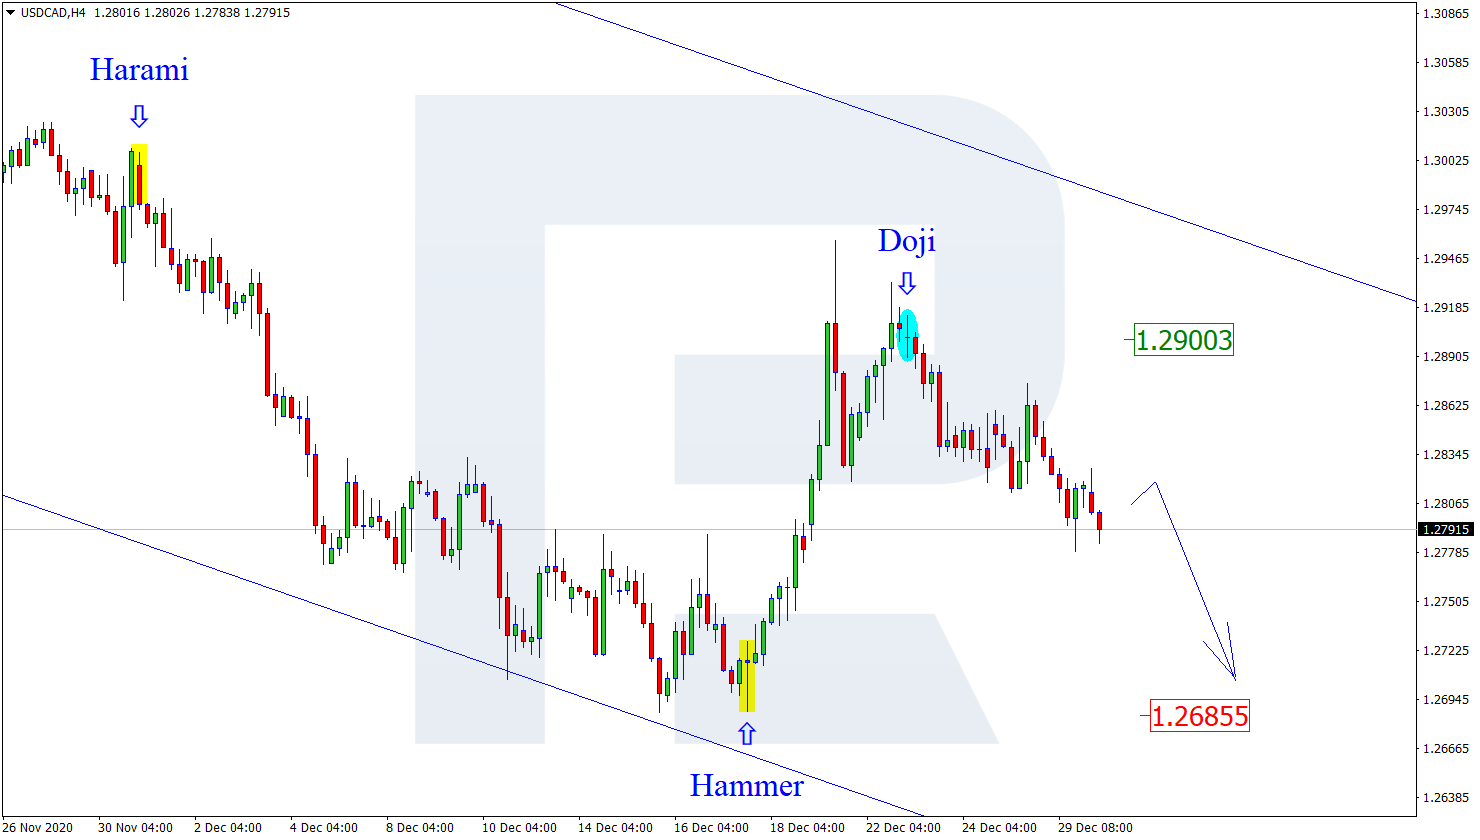
USDCAD, “US Dollar vs Canadian Dollar”

As we can see in the H4 chart, the descending tendency continues. Right now, after forming several reversal patterns, such as Doji, not far from the resistance level, USDCAD is reversing in the form of another descending impulse and may later continue falling within the descending channel. in this case, the downside target will be at 1.2685. However, an alternative scenario implies that the price may start a new pullback to reach 1.2900 before resuming its decline.

USDCAD
Risk Warning: the result of previous trading operations do not guarantee the same results in the future

AUDUSD, “Australian Dollar vs US Dollar”

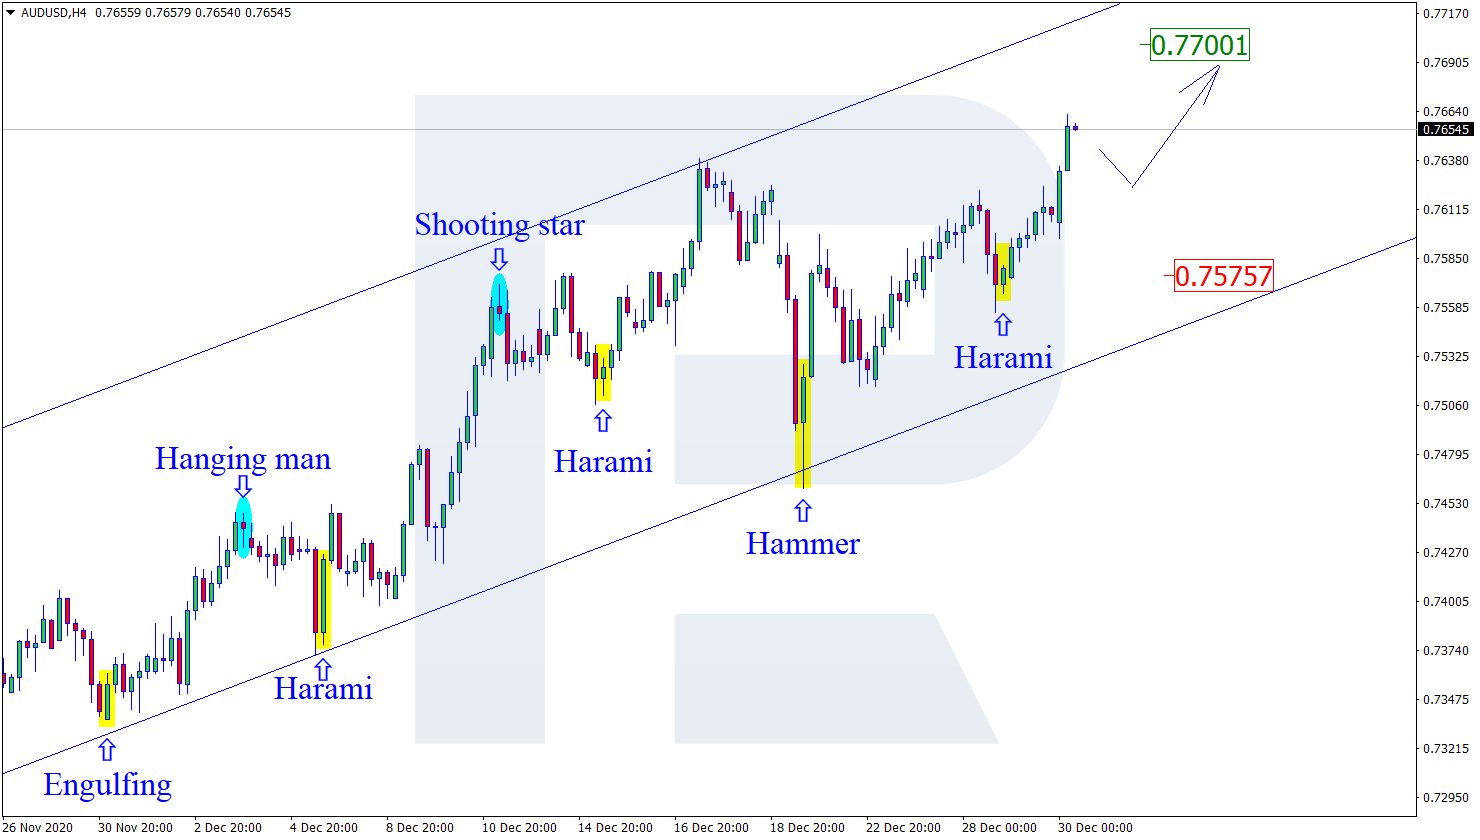
As we can see in the H4 chart, AUDUSD continues growing within the rising channel. Right now, after forming several reversal patterns, such as Harami, not far from the support area, the pair may reverse and then resume growing to reach the next resistance area at 0.7700. At the same time, an opposite scenario says that the price may correct towards 0.7575 before resuming the ascending tendency.

AUDUSD
Risk Warning: the result of previous trading operations do not guarantee the same results in the future

USDCHF, “US Dollar vs Swiss Franc”

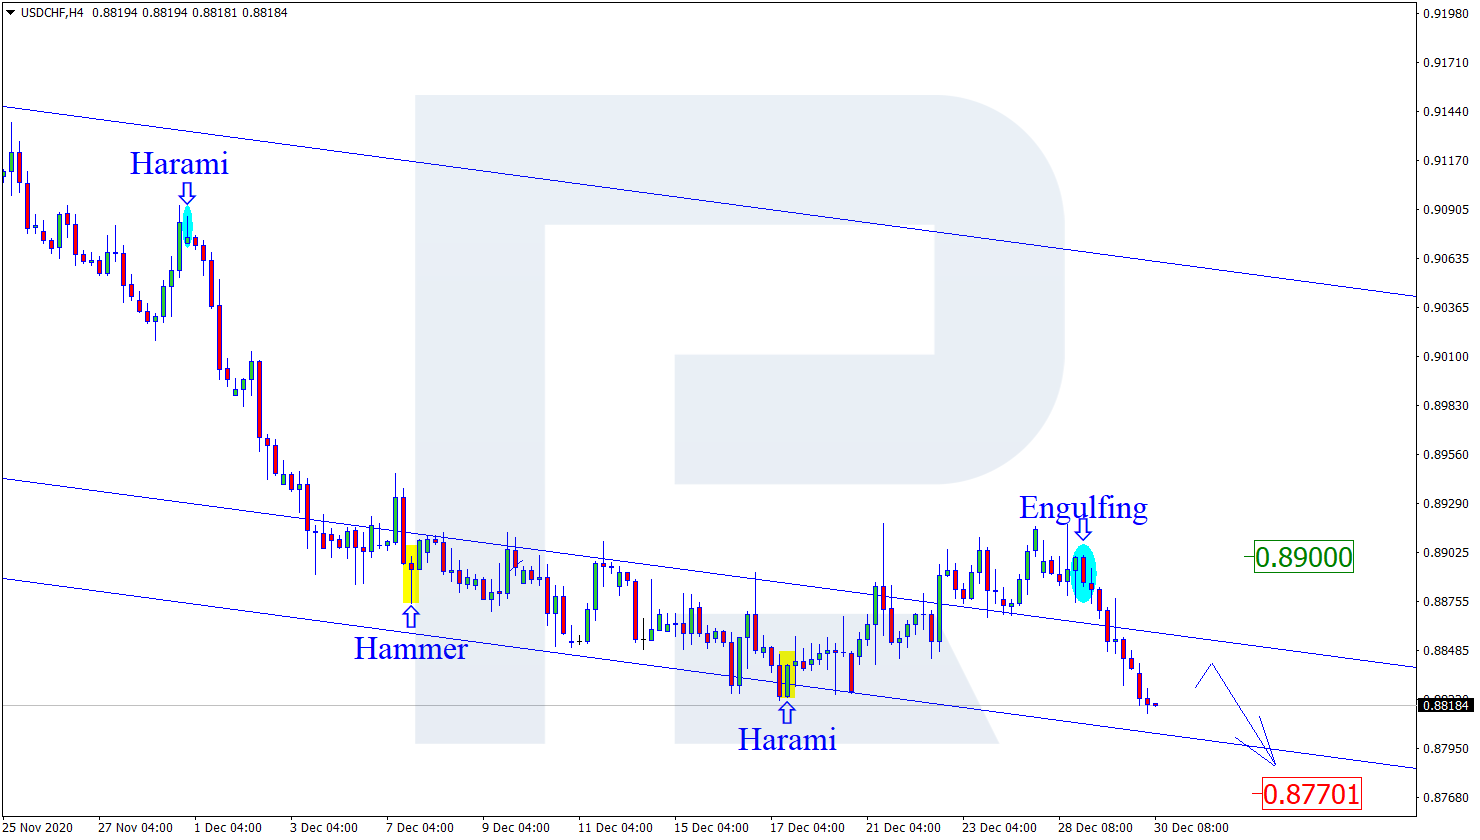
As we can see in the H4 chart, the downtrend continues. At the moment, after forming several reversal patterns, such as Engulfing, not far from the resistance area, USDCHF is reversing and may continue the descending tendency. In this case, the downside target may be the next support area at 0.8770. Still, there might be an alternative scenario, according to which the asset may grow to return to 0.8900 before testing the support area.

USDCHF

Article By RoboForex.com

Attention!
Forecasts presented in this section only reflect the author’s private opinion and should not be considered as guidance for trading. RoboForex LP bears no responsibility for trading results based on trading recommendations described in these analytical reviews.

The dollar continues to decline amid rising shares. The British Conservative Party has supported the Brexit agreement

by JustForex

Stock markets continue to grow amid approval of the Covid-19 vaccine developed by AstraZeneca and the University of Oxford. This move will help the UK to increase vaccinations from Monday next week. Another positive news is the support for British Prime Minister Boris Johnson from the Conservative Party. On Tuesday, party officials said that the deal “upholds UK sovereignty” and requested the House of Commons to vote in favor of it.

Apparently, the year is not ending as badly as it could. The global stock index MSCI AC World showed an increase of 14% over the past month, and the overall growth after falling in March was almost 68%. Markets are now focused on economic recovery, and soft monetary policy is supporting the bulls.

Things may not be that simple in the foreign exchange market. The euro continues to fluctuate near annual highs. The sterling is in no rush to refresh the tops of the month following the EU-UK deal. The euro is also bouncing off its records. Traders continue to assess the consequences of the withdrawal, and not everything is cloudless here. European logistics companies are canceling freight contracts for fear of returning empty after January 1.

Against this backdrop, the British FTSE 100 slowed down its growth rates, and the German DAX opened trading with a decrease. But the credit market is still calm. Major 10-year bonds are in the green zone. Britain’s Gilts added 30 basis points to 0.241%. German Bonds increased by 22 basis points to -0.554%. American Treasuries remain stable at 0.950%.

Major stock indexes are trading in different directions. The index continues to decline.

S&P 500 (F) 3,733.38 +13.38 (+0.36%)

Dow Jones 30,335.67 -68.30 (-0.22%)

DAX 13,758.70 -2.68 (-0.02%)

FTSE 100 6,620.99 +18.34 (+0.28%)

Индекс USD 89.767 -0.151 (-0.17%)

Important events:
  • – Pending Home Sales Index (MoM) (Nov) at 18:00 (GMT+2);
  • – US crude oil stocks at 18:00 (GMT+2).

by JustForex


This article reflects a personal opinion and should not be interpreted as an investment advice, and/or offer, and/or a persistent request for carrying out financial transactions, and/or a guarantee, and/or a forecast of future events.

The Analytical Overview of the Main Currency Pairs on 2020.12.30

by JustForex

The EUR/USD currency pair

Technical indicators of the currency pair:
  • Prev Open: 1.2214
  • Prev Close: 1.2247
  • % chg. over the last day: +0.27%

EUR/USD continues to rise and has already updated the highs of the year in the Asian session. However, there has been no rapid progress in the northern direction so far. German Bonds remained on a par while US Treasuries were growing. This is a headwind for the euro bulls.

Trading recommendations
  • Support levels: 1.2151, 1.2130
  • Resistance levels: 1.2272

The main scenario for trading EUR/USD is risk-averse buying on a decline. The pair’s withdrawing from the triangle has strengthened the upward signal, but it is necessary to check if the price will fix above 1.2272. In case the day closes below, there will be a “false break-through”, which indicates a southern signal. The indicators are fully tuned for an upward movement.

Alternative scenario: if the price can fix below 1.2220, it is possible that the price will move further to 1.2130, and a break-through of the last point may signal a complete reversal.

EUR/USD
News feed for 2020.12.30:
  • – Pending Home Sales Index (MoM) (Nov) at 18:00 (GMT+2).

The GBP/USD currency pair

Technical indicators of the currency pair:
  • Prev Open: 1.3447
  • Prev Close: 1.3498
  • % chg. over the last day: +0.38%

The pound has won back some of its losses on Monday. Now everything looks like a consolidation near the highs with no hints of selling. However, the fundamental background is starting to signal an impending bearish scenario. UK Gilts decreased by 100 basis points in two days. As a result, the yield spread between the UK and the US securities has narrowed significantly.

Trading recommendations
  • Support levels: 1.3287, 1.3187
  • Resistance levels: 1.3623

The main scenario is cautious buying on a decline. Now the technical indicators are demonstrating an increase of bullish potential. The pair is trading above the moving averages. The ADX indicates a significant rise of upward pressure. But the rally from Monday’s lows looks like a pullback after the decrease. “The double top” pattern indicates the need for bulls to be vigilant.

Alternative scenario: if the pair fixes below 1.3498, the northern scenario is likely to reverse and the pair will head towards 1.3287.

GBP/USD
There is no news feed for today.

The USD/JPY currency pair

Technical indicators of the currency pair:
  • Prev Open: 103.78
  • Prev Close: 103.51
  • % chg. over the last day: -0.26%

The stock market stepped back, and the US Treasuries lost 20 basis points, so the situation immediately affected the yen. Gold and franc rose in price, which indicates that investors are leaving for defensive assets. It looks like the dollar-yen has lost its last hope for growth this year.

Trading recommendations
  • Support levels: 103.26, 102.89
  • Resistance levels: 103.90, 104.15

The main scenario is selling on growth. On Tuesday, the pair closed trading below the moving averages. At the same time, the ADX reacted to the southern movement, which indicates the strengthening of the bearish onslaught. The MACD returned to the negative zone. The price has broken through the lower border of the local channel, which indicates that there are no bulls in the pair.

An alternative scenario assumes a break-through of 103.61 from the bottom up. In this case, the pair may reach the area of 103.90 – 103.98.

USD/JPY
News feed for 2020.12.30:
  • – Pending Home Sales Index (MoM) (Nov) at 18:00 (GMT+2).

The USD/CAD currency pair

Technical indicators of the currency pair:
  • Prev Open: 1.2847
  • Prev Close: 1.2815
  • % chg. over the last day: -0.25%

Oil quotes show a slight increase again, which creates pressure on the pair. An additional bearish driver is the continued decline in the dollar index, which has no reasons for growth so far. Today, traders will be having an eye on the data on US oil inventories, which could cause fluctuations in the Canadian dollar.

Trading recommendations
  • Support levels: 1.2789, 1.2689
  • Resistance levels: 1.2954, 1.3079

The main scenario is risk-averse selling. The MACD has moved into the negative zone but is still close to zero values. The ADX still shows an increase in the potential of the southern trend. In this regard, the southern scenario remains relevant. The signal will strengthen with the break-through of 1.2789.

Alternative scenario: if the price manages to return above 1.2838, the pair may resume the upward correction.

USD/CAD
News feed for 2020.12.30:
  • – US crude oil stocks at 18:00 (GMT+2).

by JustForex


This article reflects a personal opinion and should not be interpreted as an investment advice, and/or offer, and/or a persistent request for carrying out financial transactions, and/or a guarantee, and/or a forecast of future events.

Is this the last we’ll hear of Brexit?

By Han Tan, Market Analyst, ForexTime

The UK Parliament is set to approve the historic Brexit trade deal at 2:30PM UK time today, which nullifies the threat of the UK crashing out of the European Union without a deal. While the agreement signaled relief to the markets, this may not be the last time we’ll hear about potential Brexit-induced chaos.

It’s important to note that the deal in hand, which was struck on Christmas eve, includes a “review” clause. That means that if either the UK or the EU is unhappy with how this new arrangement is working out (or not), they could renegotiate the part of the deal that’s being disputed.

This also suggests that tariffs could yet be imposed on UK-EU trade further down the line. The accord that’s set to go into effect by this Friday also lacks clarity on key issues, such as financial services, data flows, and even control over Gibraltar.

This sets us up for potentially more confrontational discussions between London and Brussels, as both try and navigate life in the post-Brexit era.

UK markets join the global party

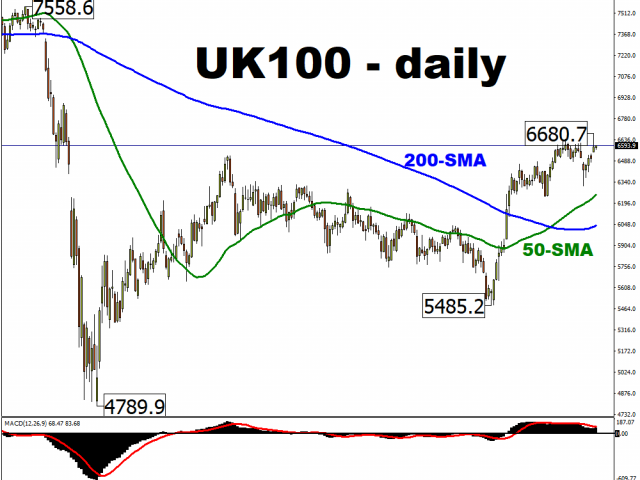
Such potentially disruptive risks further down the line didn’t stop UK equities from offering a positive reaction on its first trading day since the post-Brexit trade deal was struck on Christmas Eve. Yesterday, the FTSE 100 climbed by 1.55 percent, which was its largest single-day advance in four weeks. Still, the UK benchmark stock index remains nearly 14 percent lower from its 2020 high. At the time of writing, FTSE 100 futures are relatively steady.


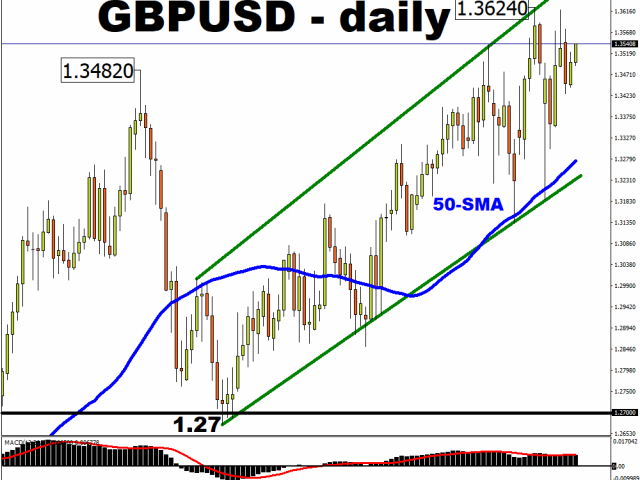
Meanwhile, the Pound is firmly within its uptrend against the US Dollar since September, with GBPUSD on course to post a new two-year high above the 1.36 line.


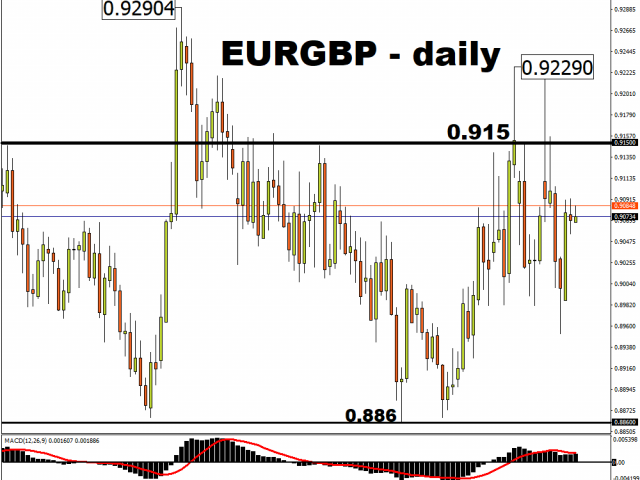
However, Sterling is having less success against the Euro in the post-Christmas sessions, with the former unwinding recent gains against the shared currency. Still, EURGBP remains in a sideways tranche that the pair has adhered to since June.


Dollar declines set to continue next year

Considering the Pound’s 11.9 percent weightage on the Dollar index (DXY), more clarity on the UK outlook could heap more downward pressure on the DXY.

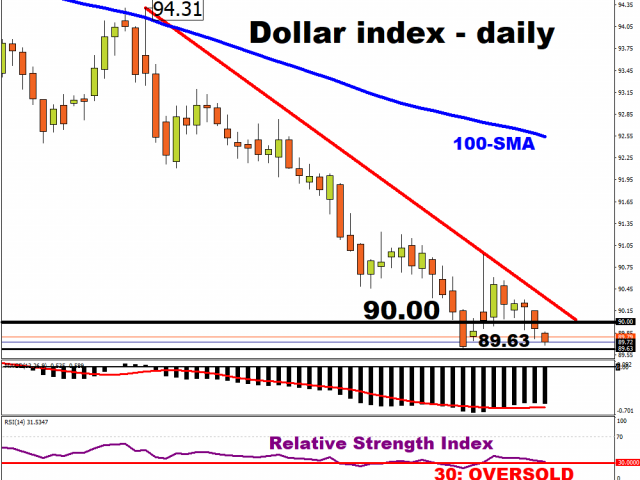
Although the DXY’s 14-day relative strength index is flirting with oversold territory once more, any near-term pullback isn’t likely to change the Greenback’s downward trajectory.

And with speculative traders ramping up their bearish bets against the Dollar to the highest levels since March 2011, according to data from the Commodity Futures Trading Commission, the DXY appears destined to extend this year’s near-7 percent decline into 2021 as well.


Disclaimer: The content in this article comprises personal opinions and should not be construed as containing personal and/or other investment advice and/or an offer of and/or solicitation for any transactions in financial instruments and/or a guarantee and/or prediction of future performance. ForexTime (FXTM), its affiliates, agents, directors, officers or employees do not guarantee the accuracy, validity, timeliness or completeness, of any information or data made available and assume no liability as to any loss arising from any investment based on the same.


Forex-Time-LogoArticle by ForexTime

ForexTime Ltd (FXTM) is an award winning international online forex broker regulated by CySEC 185/12 www.forextime.com