
Source: McAlinden Research (11/17/23)
 McAlinden Research shares thoughts on the current state of the U.S. dollar and how this may impact the market.
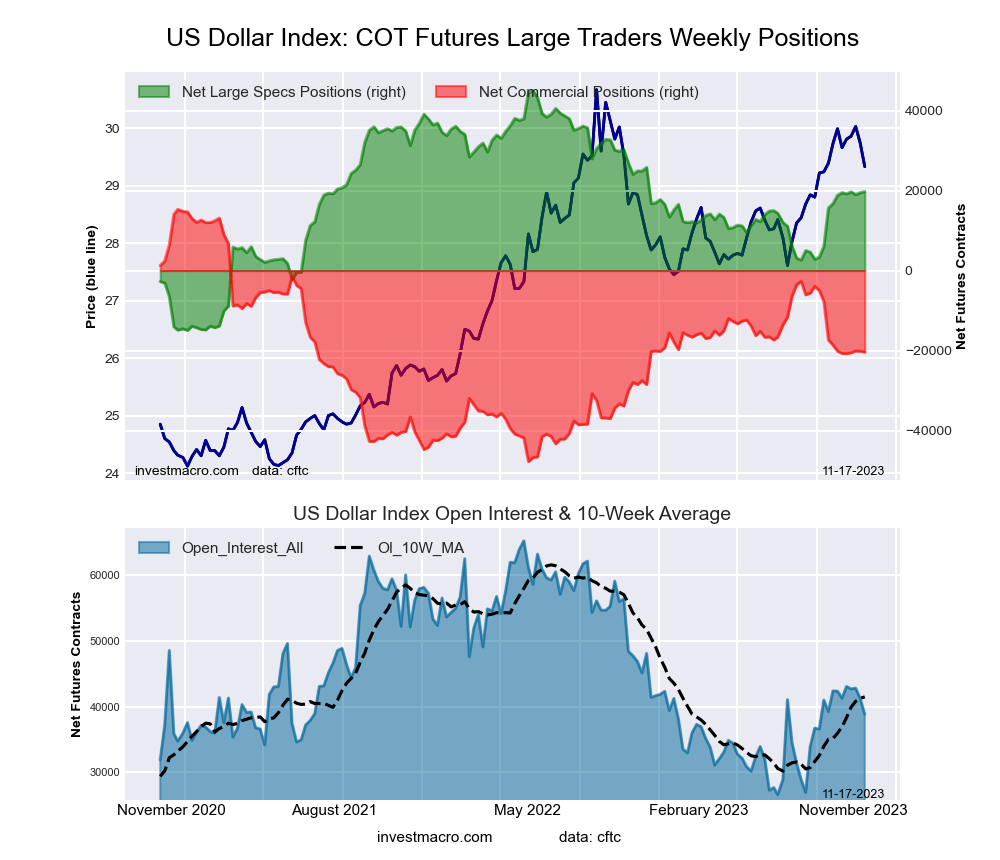
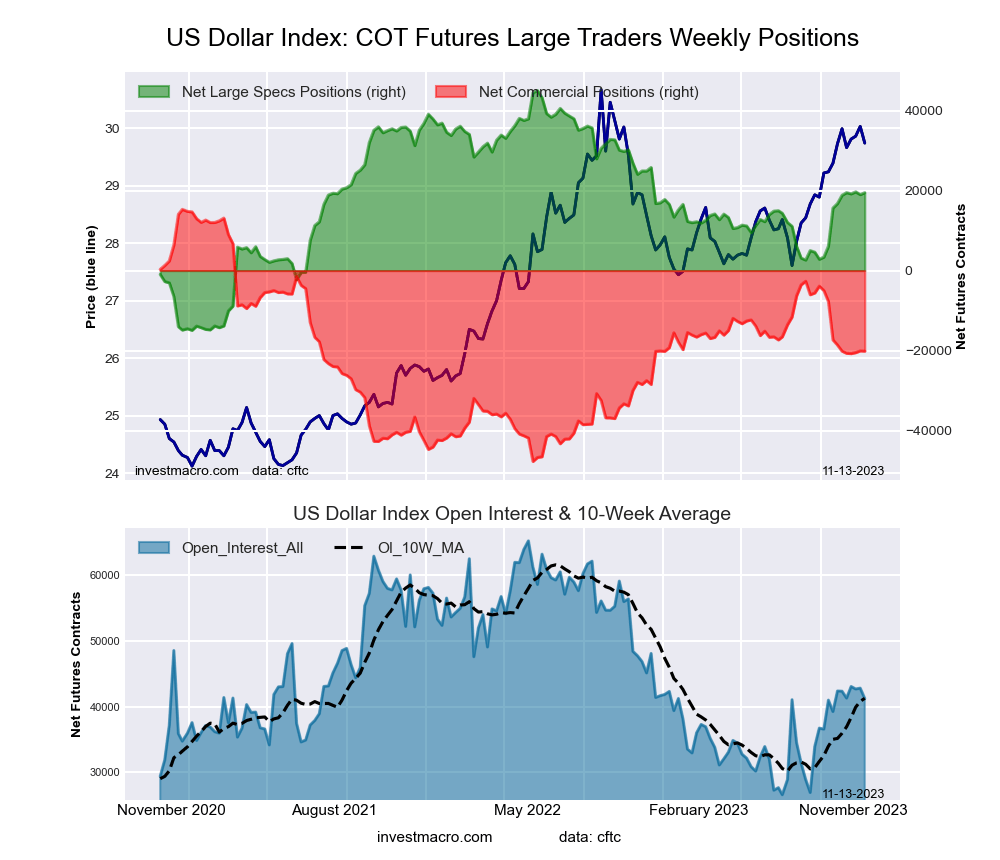
The U.S. Dollar Index (DXY) fell to a 2-month low earlier this week on consumer price inflation data that was softer than expected. A gradual pace of disinflation has taken hold and appears to indicate the Federal Reserve has wrangled inflation for the moment. The slowing pace of growth in the CPI was compounded by outright deflation in producer prices, as well as import and export price data.
These data points have increased the likelihood that the Fed has concluded its spate of rate hikes, reaching a terminal Fed Funds rate of 5.5%. If so, that would fall one hike short of what Fed policymakers projected for 2023 in September’s dot plot. Fed Funds futures contracts traded on the Chicago Mercantile Exchange (CME) indicate that traders see no further hikes going forward into 2024.
When interest rates rise in the U.S., the higher yields can attract investment capital from investors abroad who exchange assets in non-USD currencies for Dollar-denominated investments. This demand, in turn, raises the value of the Dollar compared to other currencies. In a similar way, if rates are to hold steady or even begin to fall, that can cut the appeal of the Dollar. CME’s FedWatch tool suggests a cut is actually more likely than any further hikes going forward — particularly from May 2024 and beyond.
It was all the way back in our August 2022 Viewpoint, The FX Timebomb , that MRP noted the Dollar was likely on the verge of a downturn, as the Fed was rapidly approaching what we termed “peak hawkishness;” the point at which rate hikes reached their maximum size and frequency. We wagered that, from that point on, the central bank’s rate hike regime would gradually reduce the size of rate hikes from 75bps at their largest to 50bps and then, eventually, just 25bps. Further, these hikes would become less frequent until they ceased altogether — likely the state of affairs we have now reached with just one hike in the past four FOMC meetings. The DXY hit a more than 20-year high north of 114.0 that September, prior to retreating. Though we did witness a rebound in the Dollar from lows under 100.00 earlier this year, it has not gotten anywhere near its 2022 high.
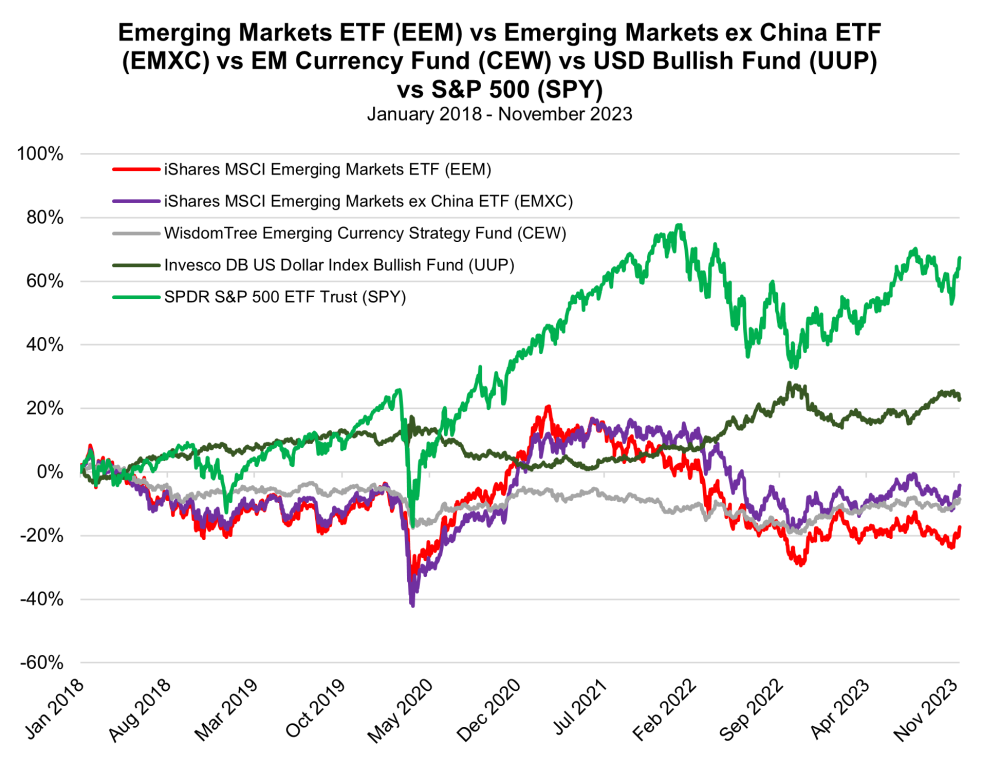
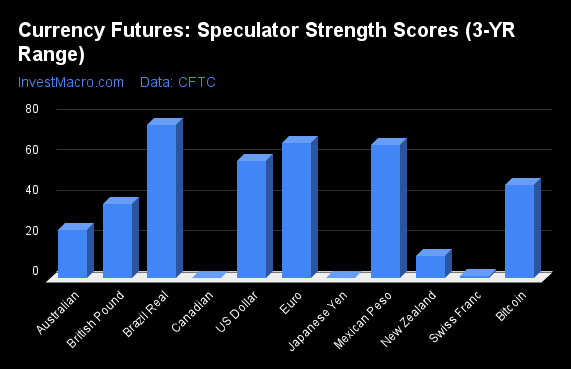
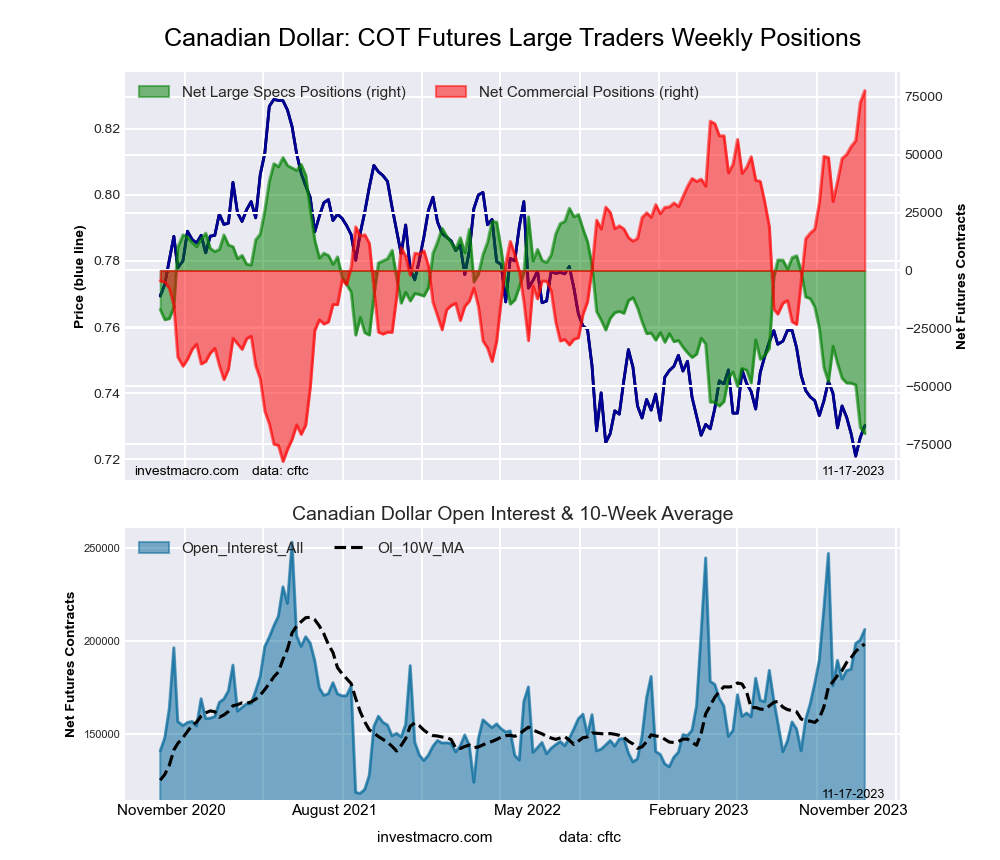
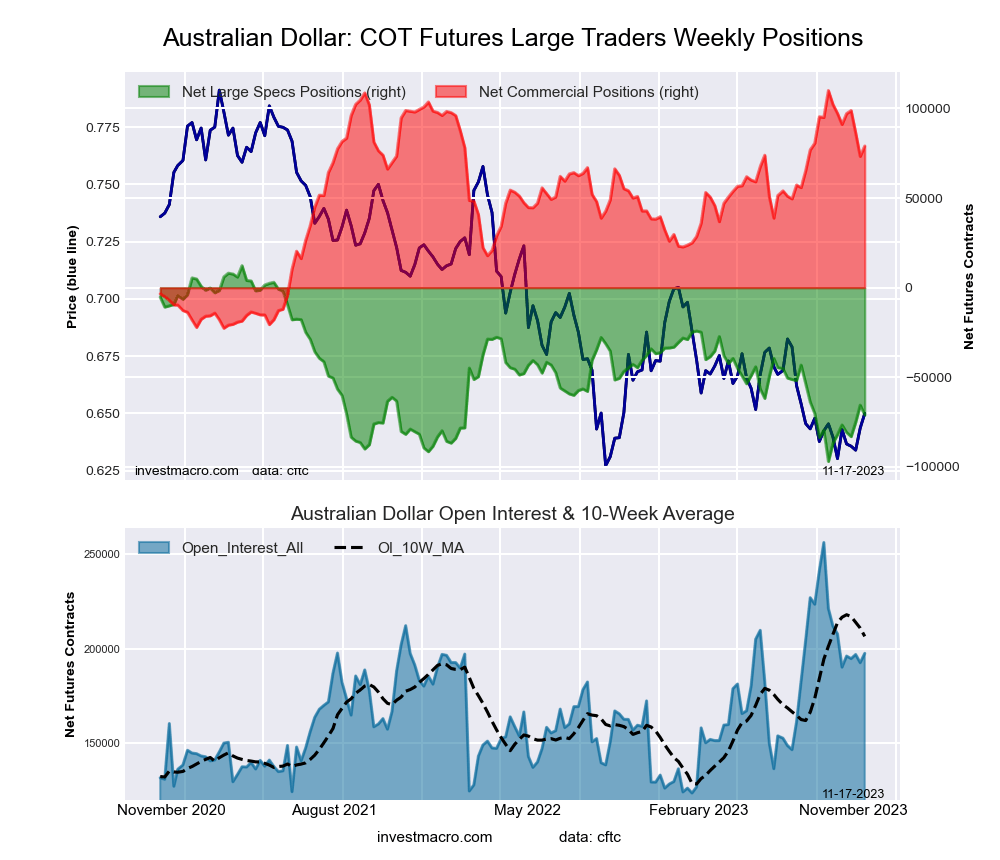
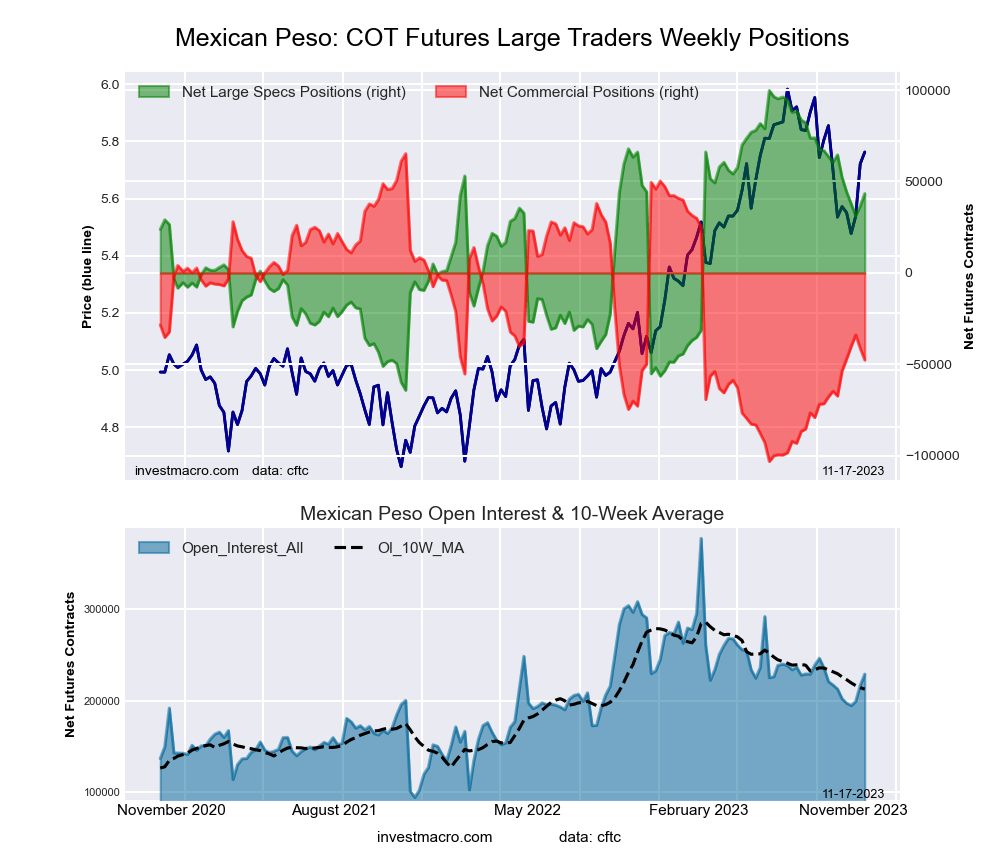
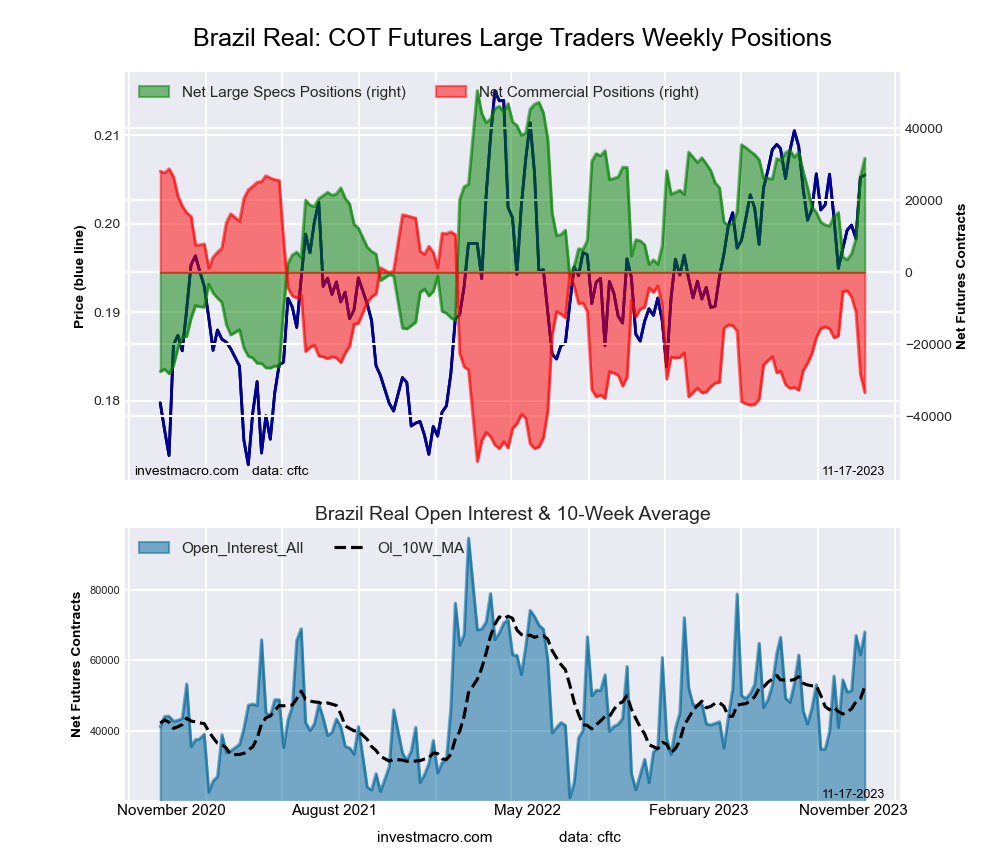
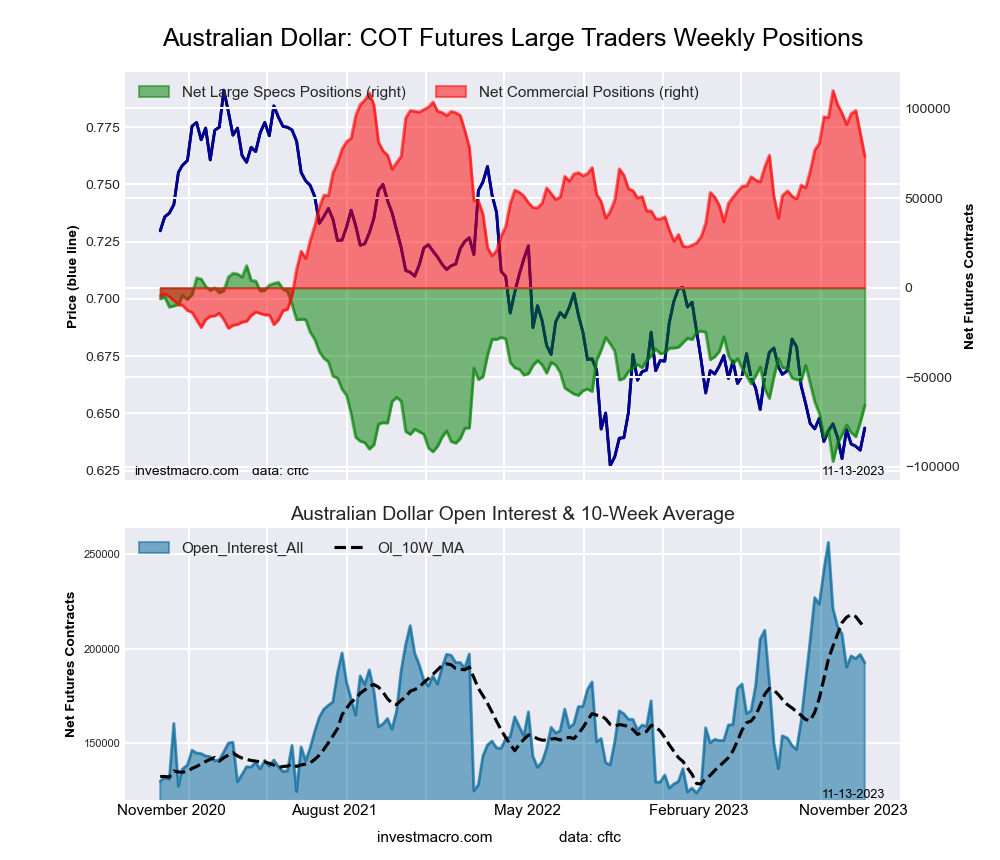
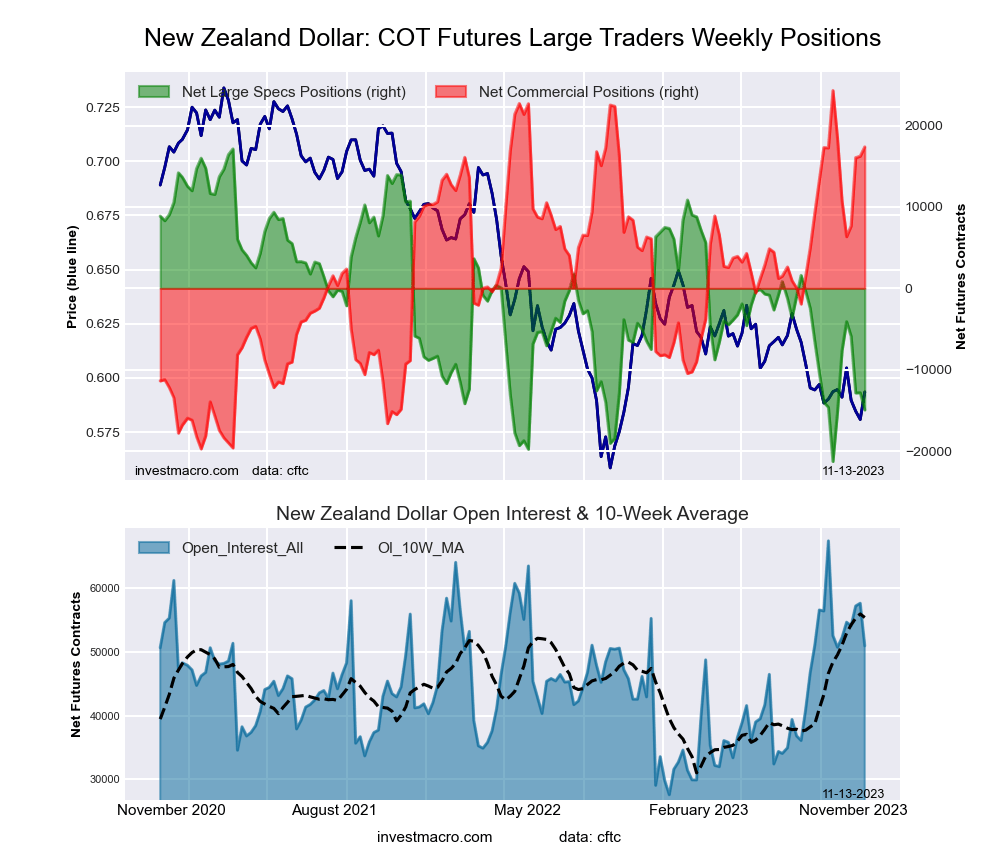
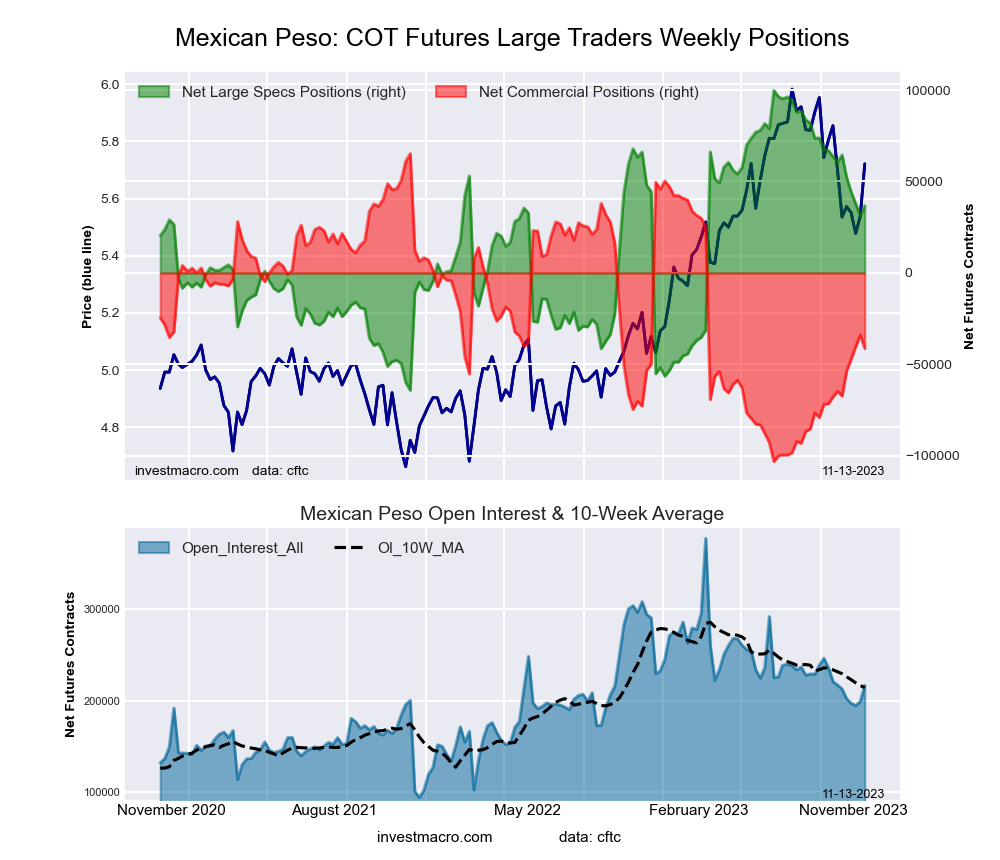
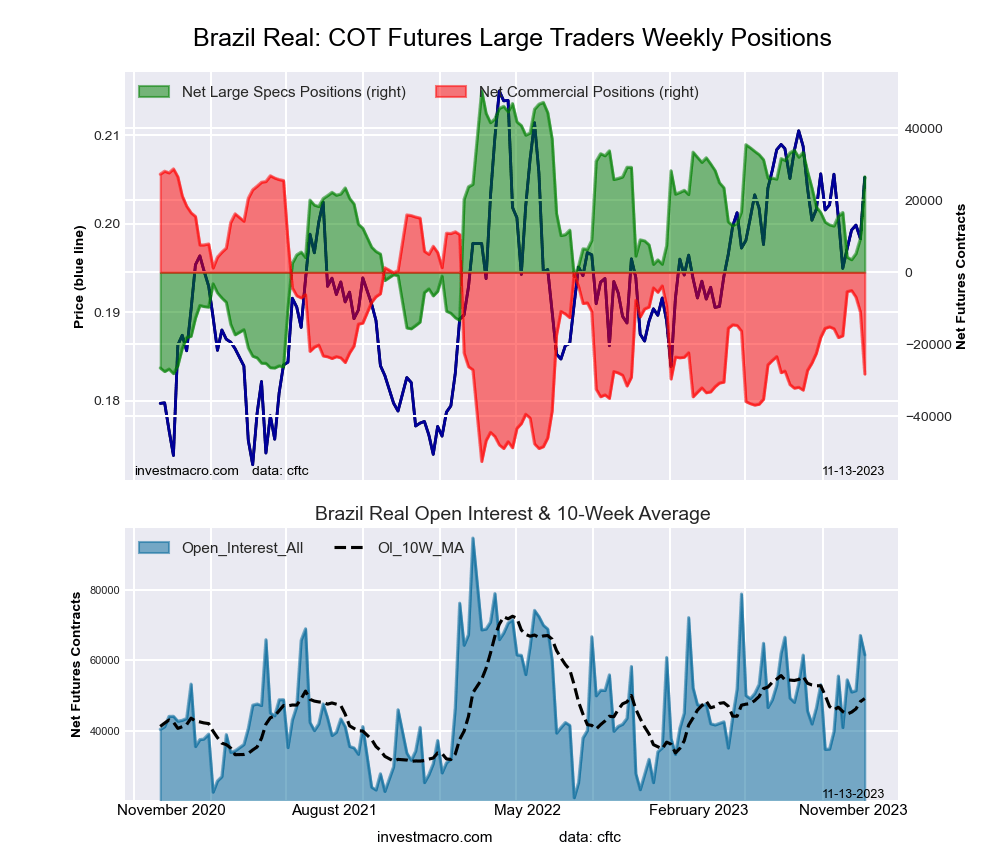
If Dollar strength is indeed set to subside further, that could provide a boon to emerging market (EM) economies. Per a 2023 IMF analysis, a 10.0% USD appreciation, linked to global financial market forces, decreases economic output in emerging economies by -1.9% after one year’s time, and this drag lingers for two and a half years. The international impact of material USD appreciation is felt disproportionately in EM economies, as growth in developed economies only experiences an immediate decline of -0.6% in the wake of 10.0% USD appreciation, and that dent dissipates in a year’s time.
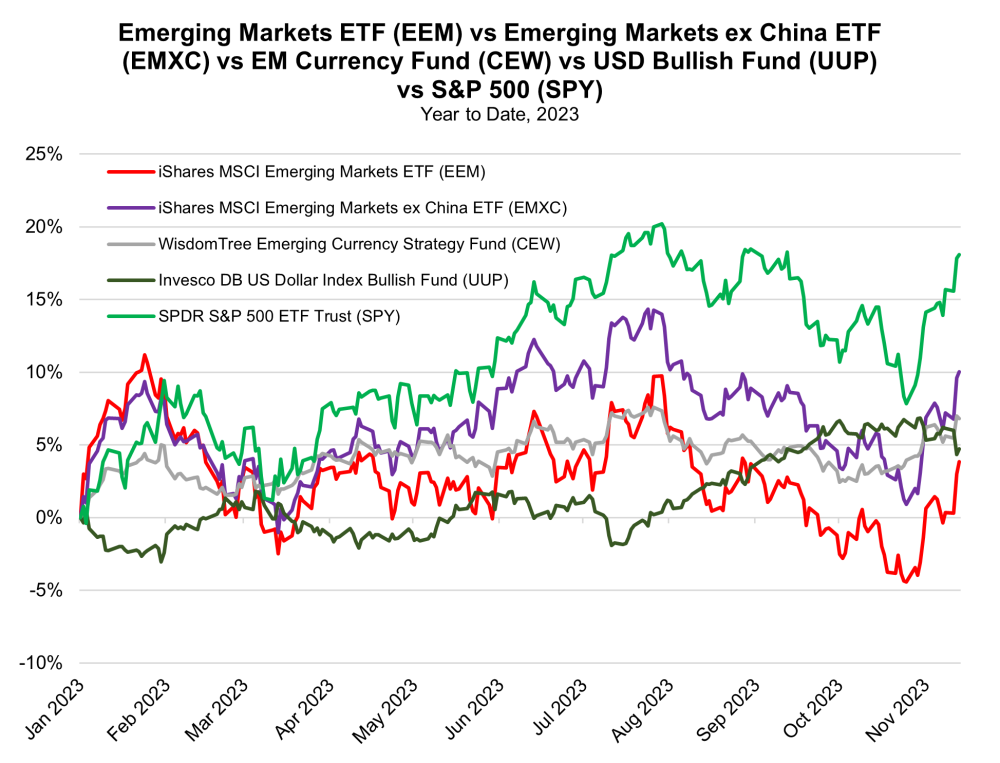
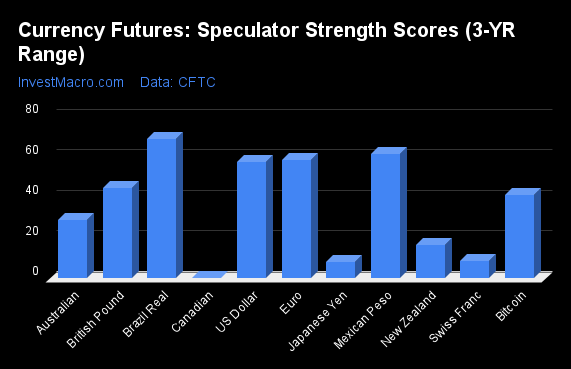
The strong USD battered nearly all international currencies — particularly those in emerging markets — but subsiding rate pressure from the Fed is bolstering expectations for non-USD currencies in the year ahead. A majority of analysts in a November Reuters poll indicated that they expect the Dollar to trade lower by year-end. The rebound in EM currencies is expected to be gradual, but several EM currencies, like the Indian Rupee, Thai Baht, and South Korean Won, were projected to recoup recent losses sustained against the US Dollar by late 2024.
Shares of many publicly traded EM firms could be bolstered by a favorable currency translation effect if the Dollar continues to soften relative to local currencies. An October 2023 outlook report from Lazard Asset Management notes that current earnings growth forecasts show EM earnings growth of 19% in 2024, nearly doubling expectations for developed markets earnings growth at just 10%. Earnings in the U.S. are only expected to expand by 12%, signifying a 7% positive earnings growth spread in favor of EM over U.S. equities.
The most significant impact of a weakening Dollar on emerging markets may be the impact on their debt loads. As of 2019, about two-thirds of external debt in EM economies was denominated in USD. By October 2022, Bank for International Settlements (BIS) data showed that non-financial dollar-denominated debt in emerging economies stood at $4.2 trillion. When the Dollar appreciates in value compared to local currencies in emerging markets, the servicing of USD-denominated debt becomes more costly on a relative basis. However, the opposite case could now take place, with EM debt loads becoming more manageable.
Investors can gain exposure to emerging markets via the iShares MSCI Emerging Markets ETF (EEM), as well as EM currencies via the WisdomTree Emerging Currency Strategy Fund (CEW). Additionally, exposure to the U.S. Dollar can be gained with either the Invesco DB U.S. Dollar Index Bullish Fund (UUP) or Invesco’s DB U.S. Dollar Index Bearish Fund (UDN).
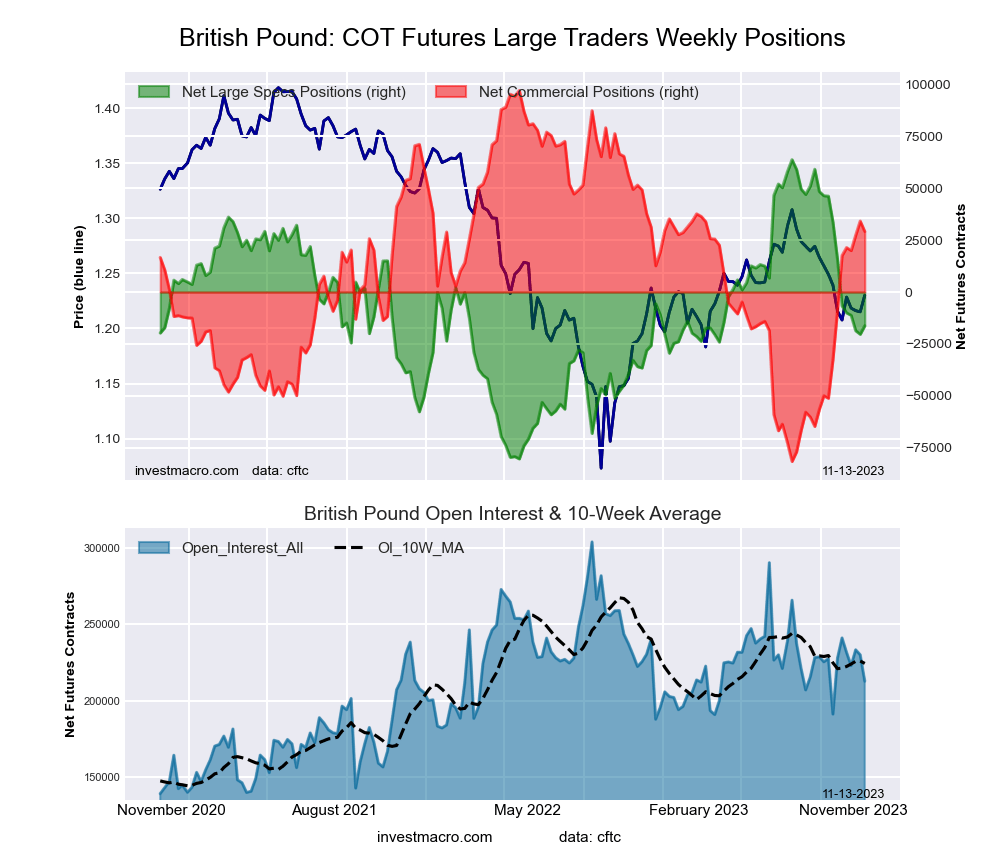
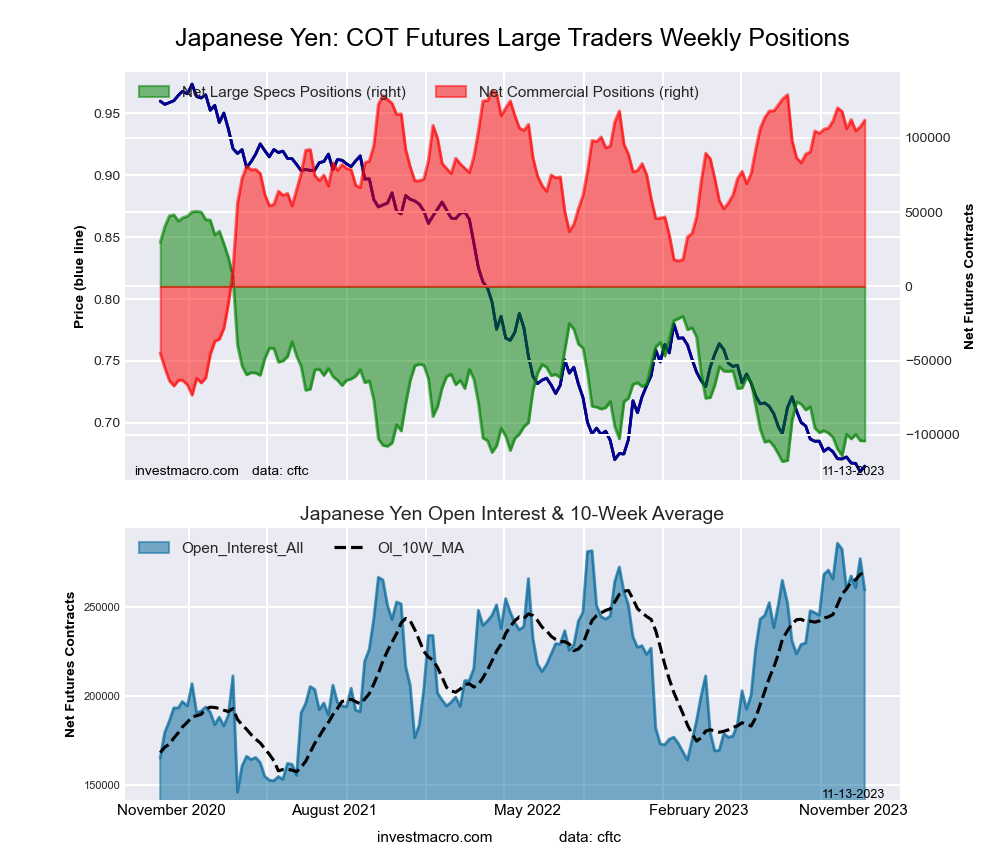
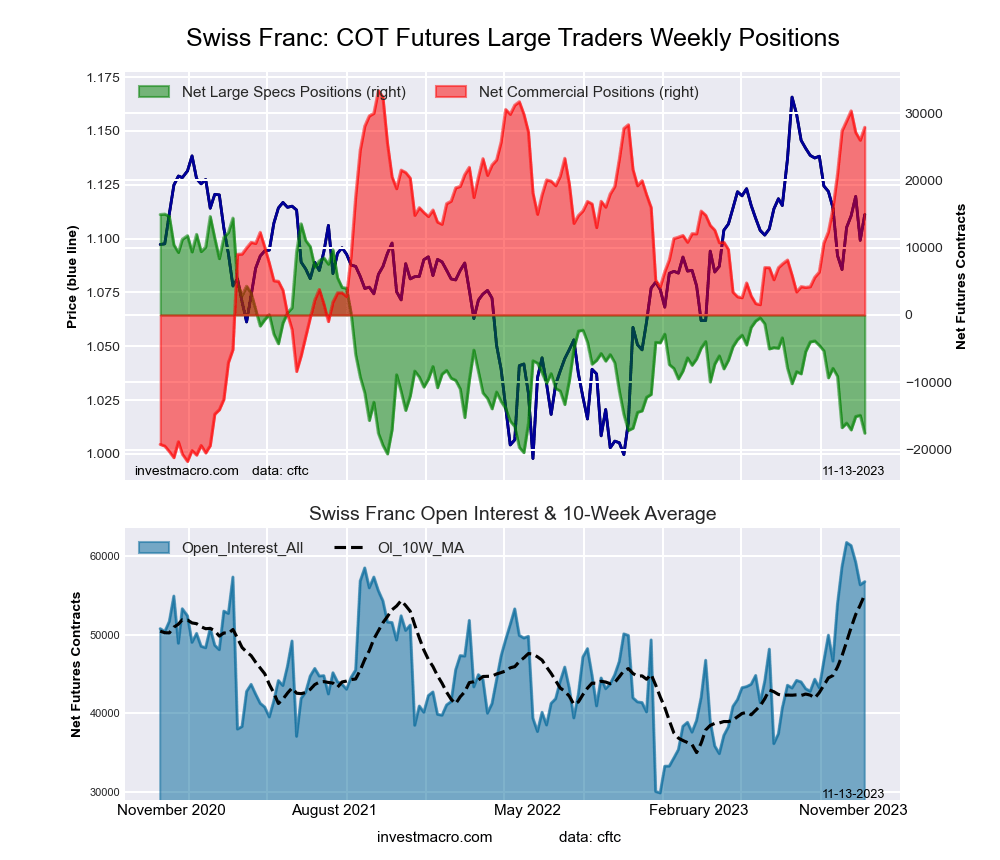
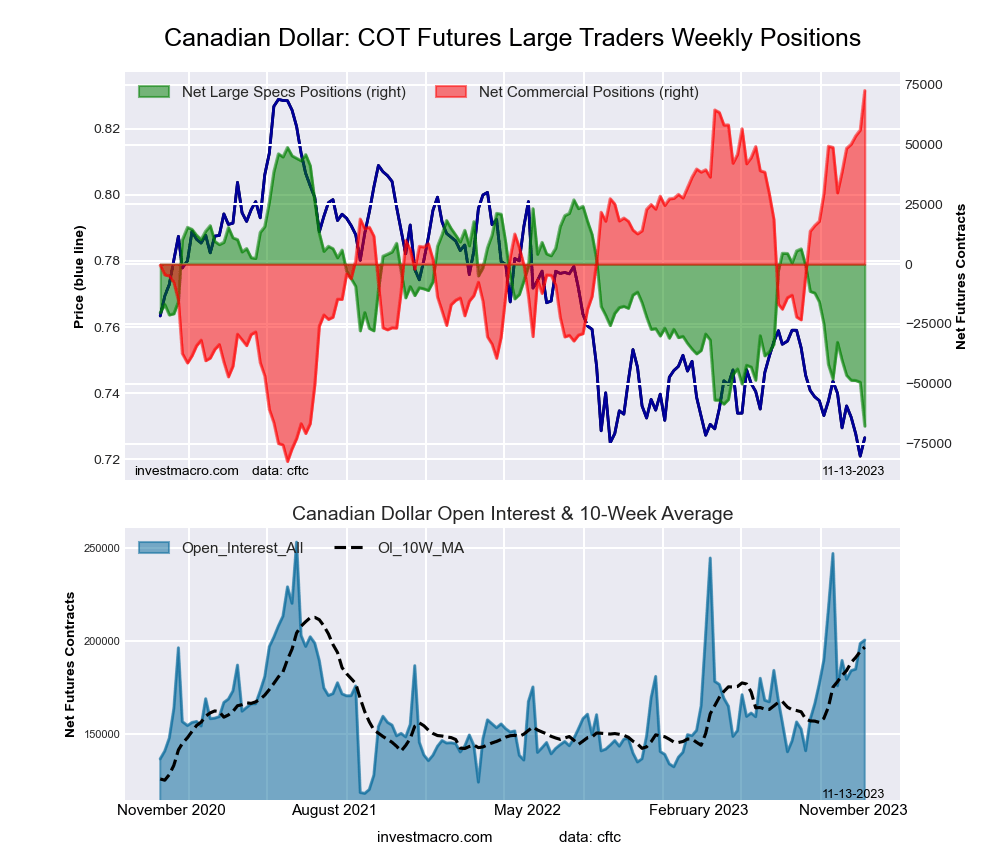
Charts
Important Disclosures:
- Statements and opinions expressed are the opinions of the author and not of Streetwise Reports or its officers. The author is wholly responsible for the validity of the statements. The author was not paid by Streetwise Reports for this article. Streetwise Reports was not paid by the author to publish or syndicate this article. Streetwise Reports requires contributing authors to disclose any shareholdings in, or economic relationships with, companies that they write about. Streetwise Reports relies upon the authors to accurately provide this information and Streetwise Reports has no means of verifying its accuracy.
- This article does not constitute investment advice. Each reader is encouraged to consult with his or her individual financial professional and any action a reader takes as a result of information presented here is his or her own responsibility. By opening this page, each reader accepts and agrees to Streetwise Reports’ terms of use and full legal disclaimer. This article is not a solicitation for investment. Streetwise Reports does not render general or specific investment advice and the information on Streetwise Reports should not be considered a recommendation to buy or sell any security. Streetwise Reports does not endorse or recommend the business, products, services or securities of any company mentioned on Streetwise Reports.
For additional disclosures, please click here.
McAlinden Research Partners Disclosures
This report has been prepared solely for informational purposes and is not an offer to buy/sell/endorse or a solicitation of an offer to buy/sell/endorse Interests or any other security or instrument or to participate in any trading or investment strategy. No representation or warranty (express or implied) is made or can be given with respect to the sequence, accuracy, completeness, or timeliness of the information in this Report. Unless otherwise noted, all information is sourced from public data.
McAlinden Research Partners is a division of Catalpa Capital Advisors, LLC (CCA), a Registered Investment Advisor. References to specific securities, asset classes and financial markets discussed herein are for illustrative purposes only and should not be interpreted as recommendations to purchase or sell such securities. CCA, MRP, employees and direct affiliates of the firm may or may not own any of the securities mentioned in the report at the time of publication.


