
Source: Michael Ballanger (12/16/25)
Michael Ballanger of GGM Advisory Inc. shares some words of wisdom and his 2026 outlook.
Originating in Greek mythology as a challenge to divine order, the term “hubris” remains a significant theme in literature and life, representing a dangerous belief in one’s own invincibility or superiority. Strictly defined, it is “excessive pride, arrogance, or overconfidence that leads to a person’s downfall, often by causing them to overstep limits, defy gods, or ignore warnings.”
Mark Twain had a different definition that we as humans know all too well. Twain once wrote, “It ain’t what you don’t know that gits ya into trouble. It’s what you know for sure that ain’t exactly so.”
I had a teacher who reminded me at a very young age that making blind assumptions without checking one’s facts is a recipe for disaster and, worse still, embarrassment. “You know what you do when you ‘ASSUME’ something? You make an “ASS” of “U” and “ME.”
In the practice of writing newsletters, one tends to get elevated to the undeserved role of “authority,” as in, “he/she is an authority on gold and silver.” Sometimes, authors of financial newsletters are assigned designations like “guru” or “pundit” or “expert” but the reality of this pastime (as opposed to profession) is that most of us are simply common folks that for some unworldly reason have the intestinal fortitude and rhinoceros-like skin to put their opinions, expert or not, out there in full view for all the world to judge and rejoice or judge and condemn. The rejoicing comes after a particularly good guess (as opposed to calculation) at the future direction and amplitude of a particular stock or commodity. The condemnation occurs when one’s stab at the future direction and amplitude of a particular stock or commodity winds up in the trash bin. Reward or punishment for well-executed speculations is either more or fewer followers, and depending on whether one is paid as a “content provider” or under the subscriber model, loss or gain of people that grew accustomed to one’s accurate (or inaccurate) guesses.
As a young boy, I used to sell papers in the wee hours of weekend mornings at Woodbine Racetrack in northwest Toronto where the industry professionals such as trainers and grooms and jockeys would all arrive as the sun was rising and pay a dime for the “Daily Racing Form” which had all the races and the horses listed along with a list of their last three heats on either the turf (grass) or mud (dirt). One section of the paper featured the section where the handicappers wrote a column with their “touts” for the day’s races, which is where the term “tout sheet” was first derived. There was “Peter’s Picks,” “The Trackman,” and “The OddsMaker” all picking winners, placers, and showers for the expressed benefit of the amateur handicapper or weekend gambler who would lay down their minimum $2 bets with absolute certainty after reading through the hieroglyphics contained in the form.
One day, I decided to keep track of all the picks made by the “expert” race appraisers, so for the next few months of the summer, I wrote down the names of all the horses and where they finished each race. At the same time, I would pick three horses to win, place, and show in the same races, all based on their “colours” which were bay, chestnut, black, brown, or gray. At the end of the season, I tallied up all the results, and to no one’s particular surprise (except mine), a 12-year-old boy picking horses based on the colour of their coats outperformed the “experts” all equipped with 30-odd years of bookmaking and handicapping under their belts.
That is eerily similar to the late 1970s when newsletter guru and former E.F. Hutton Senior Technical Analyst Joe Granville would ask chimpanzees (dressed up as Wall Street bankers) to throw darts at the stock pages of the Wall Street Journal and then compare their track records to those of the “bank trust officers” that are today’s “market strategists.”
The results were all the same. Sometimes the monkeys would be on top of the pack (usually in down markets), and sometimes they would be in the middle of the pack, but rarely did they trail the pack, once again proving that “A Random Walk down Wall Street” author Burton G. Malkiel was more than just a theorist but more of a statistician.
Over the years, I have found that investment success was more common in areas in which I was familiar, such as the junior mining space. I think the reason that my career evolved around commodities and mining was my fascination with those horses at Woodbine. You could look at two dozen horses under two dozen different jockeys, and only in the manner in which both horse and rider displayed a certain “swagger” could one recognize the importance of “presence” in the sport of kings. In a similar manner, CEO’s of successful mining and or exploration companies would emit a similar “swagger” when they entered a boardroom.
The firmness of a handshake or the directness of focus when being introduced seemed to accompany the great ones. However, at the end of the day, even the great ones (like Friedland, Beattie, or Netolitzky) would be the first to admit that really great geologists need an ample serving of good fortune in order to amass enviable track records. Luck does play a big part in any discovery because even the most sophisticated technology in geophysics or geochemistry cannot prevent Mother Nature and Lady Luck from playing a cruel trick with ruthless regularity and tempestuous timing.
Technical analysts would have us believe that all those squiggly lines on a graph are infinitely more predictive than the soggy leaves at the bottom of a teacup or a wishbone-shaped piece of driftwood in locating subsurface water. However, despite finding personal success in using the tool called “technical analysis” (“TA”) in improving returns, I learned a valuable lesson this past week. About a month ago, with gold prices approaching $4,400, I used TA to identify a series of extreme readings that, in past eras, have led to trend reversals.
As a result, on October 17, I sent out an email alert calling for a top in gold, which resulted in an outside key reversal day followed by a retest the following Monday that also failed. As a result, my call for the near-term top in gold was then and remains today as a solid one, with February gold still $213 below the top of $4,433 seen the prior Friday.
Inflated with inner peace and burgeoning with the pride one feels when a particular call goes well, I waited with the patience of a lion-hunter for another popular metal to display characteristics similar to that of gold. I lurked silently in the bushes until late November, and with all the hubris and swagger of a Secretariat or Northern Dancer approaching the starting gate, I elected to make the call that I now regret, and that call was “Sell silver.” The price was around $57.00 per ounce basis March.
During the week immediately following that call, I began to sense that there had been a kind of shift, as in “there’s been a shift in the force, Luke” from Star Wars fame, as silver spat in the face of GGMA “expertise” and drove northward through $59. On Monday, March silver gapped through $60, and by Thursday, it hit $65.
What changed?
As I sat in my office overlooking the lovely and now-frozen Scugog Swamp listening intently to Fed Chairman Jerome Powell, I decided to write the following to my subscribers:
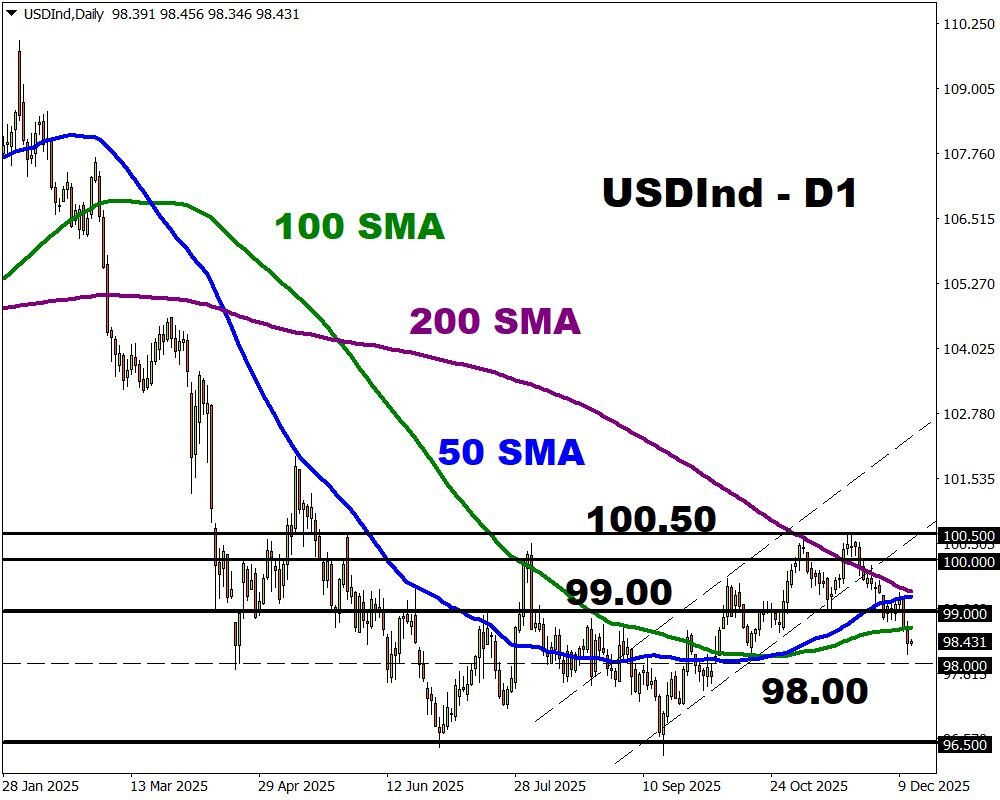
“In keeping with the Fed’s dual mandates of “price stability” and “maximum full employment,” their clandestine third mandate “protecting Wall Street” was delivered wonderfully today by Fed Chairman Jerome Powell as he walked the world through the 2:30 presser with nary a thought about inflation but ample comments about the “weakening jobs market.” Wall Street took that as a “dovish” tilt and took the DJIA to a 600-point gain and the S&P 500 to a 55-point gain. Traders also took the U.S. dollar down with the DXY down .568 to 98.632, and gold from down $30 to up $27, and silver from down $0.27 to up $1.36.
With this kind of cheerleading, the Fed has given traders an early Christmas gift, so my speculation of a weaker, 2018-style close to 2025 must be shuttered. Also, the hedges on gold and silver being used in the GGMA 2025 Trading Account have to be re-examined as the dovish Fed has now thrown the U.S. dollar overboard in favour of easier money. The Fed has also reintroduced a mild form of quantitative easing, or as the commentators called it, “soft QE.” In a scenario of Fed purchases of $40 billion of T-bills every month, we are back to a stimulative environment, which, from where I sit, is patently absurd given the S&P within a chip shot of record highs. Any time the Fed engineers a “risk on” policy move, stocks and the metals always move higher, so to be hedged against a stimulative Fed is at once dangerous and stupid.
I look for traders to now have a free rein to take stocks and the metals higher into year-end. While I will not move to add to any new long positions in the gold or silver space, I now expect February gold to re-test the high of October 19th at $4,433. Gold traders cannot ignore the breathtaking breakout in silver, so I suspect that there will be a lot of short-covering by the end of the month. I will be looking at the RSI and the HUI:US to see if we get a confirmed new high for gold. If we get one, I will open new speculative positions in the leveraged ETFs and in options.”
This week, the HUI:US broke out above the October 15 high of 693.10 and moved to a new record high of 715.70. All that is required for there to be a confirmed new “leg” of the precious metals bull is for February gold to close above $4,433. At Friday’s high, it was $4,387.80, so we are banging on the proverbial door.
I used a phrase in this Thursday’s alert that should be recalled and recited, and that is this: “It is not a sin to be wrong, but it IS a sin to STAY wrong.”
May we never forget the wisdom of that adage.
2026
Moving into 2026 is going to be a very interesting endeavour as I am now forced to begin to formulate the GGMA 2026 Forecast Issue, which seems to be getting more difficult each and every year. The newsletter I write focuses on a given theme each year, after starting off in 2020 with the idea that escalating debt levels in the West would eventually require collateralization of sovereign debt with gold reserves, and whether it was pandemics or regional bank problems, each crisis was met with monetization.
Debt has remained a dominant theme and rationale for gold and silver ownership every year since the service was founded, but in the past two years, the electrification movement and the macroeconomic outlook for copper sent me scurrying for senior and junior opportunities in the northern and southern hemispheres. I used my beloved Freeport-McMoRan Inc. (FCX:NYSE) as a proxy for not only copper but also gold, as the globe’s premier producer of the red metal is also a significant member of the gold club, thanks largely to its part-ownership of the mighty Grasberg Mine in Indonesia.
With great trepidation and fear verging upon abject guilt, I exited FCX in early July based largely on my concern that the huge gap between London Metals Exchange copper (at $4.40/lb.) was too much of a discount to CME (U.S.) copper, which had been “tariffed” into a $1.50 premium over London due solely to political posturing. A seminal event occurred in July when the Trump Administration elected to remove tariffs on imports of “raw copper,” causing a cataclysmic crash in U.S. copper prices to align perfectly with London prices. I bought back my position in July at sub-$40 and then exited again in September when copper prices had rebounded into overbought conditions.
Then the news hit of the Grasberg “mud rush” accident that caused a halt in operations in that portion of the mine complex, after which the stock cratered to just above $35. I fully expected that overvalued equity markets would weaken during the seasonally soft August-October period, but resilient equities and a stubbornly strong copper price prevented the target price of “sub-$30” from ever being achieved. So, here I sit, with 13 trading sessions left in 2025, and I am bereft of my beloved FCX as it steams northward at $47.38 after hitting $49 earlier today. Every single time I exit FCX, karma bites me in the backside, shaking its skeletal finger while shrieking “Sacrilege!”
The good news is that I have been blessed with a couple of junior copper deals that caught my attention in 2025. One is not new in that I have been an investor in Australian Campbell Smyth’s
Fitzroy Minerals Inc. (FTZ:TSX.V; FTZFF:OTCQB) since 2019, when he launched Norseman Silver into what we both thought could be a rip-roaring silver market in 2020. The company went through growing pains in 2020-2022 and then went “dark” in 2023 before finding a new team of managers and projects in U.K.-based CEO Merlin Marr-Johnson and Santiago-based COO Gilberto Schubert and after bottoming in late 2023 at $.035, the shares responded favourably to the management change and since then have not had time to even glance into the rear-view mirror.
Smyth has put together one superb team of highly-skilled professionals and is now backed by Crux Investor founder Matt Gordon as a major shareholder as well as Technical Advisor Craig Perry in their quest for copper stardom in the Atacama Region of the Chilean Andes. Searching for copper in Chile is like looking for seashells in the Bahamas in that, despite declining grade and reserves in some of the legendary state-run Codelco operations, it is the prime locale for copper discoveries. Blessed with a wonderfully hospitable mining environment, only the province of Quebec in Canada is friendlier to people with money looking to find metals while employing people, a notion that the Canadian provinces of Ontario and B.C. might consider. Smyth and friends have raised over CA$20 million since the lows of 2023 and have since come up with a brand new copper-gold-molybdenum discovery in their Caballos project that serves as a wonderful complement to their oxide copper deposit at Buen Retiro.
However, the seriously underpromoted and underemphasized component of that property is what may or may not be lurking under that massive oxide copper-bearing cap. Management has been quite “coy” about revealing anything about drilling intentions until their press release of December 2, where they reported: “Hole 43, 150 metres north of hole 42, is currently underway. Crucially, the core photographs look very similar to the style of mineralization from within the resource zone at Candelaria. These holes are the first time that Fitzroy has seen consistent sulphide mineralization of this nature, which further enhances the exploration model at this project.
Followers of this publication are quite familiar with my contention that Buen Retiro is one of those projects where management has — most appropriately — de-risked the project by drilling of the easily fundable oxide cap, where CAPEX requirements are relatively low, while carefully and very much under the cloak of darkness, valiantly trying to unlock the secrets of the deeper regions of Andean geology. All I can say is that it is exciting to be a shareholder, and we will leave it at that.
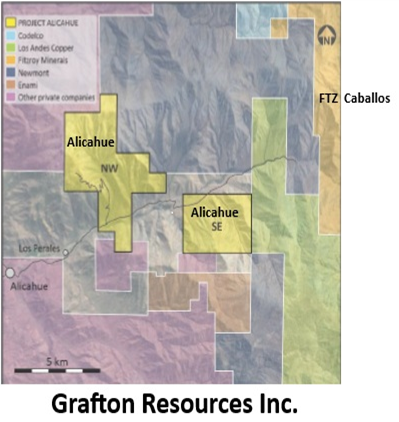
The other Chilean project is Grafton Resources Inc. (GFT:CSE; PMSXF:OTC), where essentially the same management group as Fitzroy has attempted to firewall the two main projects (Buen Retiro and Caballos) from further dilution by way of the creation of this new company.
New prospects that come across Schubert’s desk are funnelled into Grafton while the team focuses 100% on near-term production for Fitzroy, which is somewhat akin to one car driving in the middle lane of the Autobahn while the other is in the outside lane with full throttle, taking the moniker of “aggressive exploration.”
With a capital structure time-warped from the 1980s, GFT has only 25 million shares issued, $4m in the bank, and a project (Alicahue) approved for drilling in January. All that needs to be completed is an airborne MMT survey to be completed in the very early New Year, and then it is “Game on.”
Many of the people who follow me are asking questions about Getchell Gold Corp. (GTCH:CSE; GGLDF:OTCQB) and the dismal lack of performance in this latest move in the mining stocks, as evidenced by the HUI:US move to 715 this week.
As a starter, the promotions of the last few years are not exactly at new highs. Let’s start with the greatest promotion in eastern Canada since the Hibernia oil discoveries in the late 1970s —
New Found Gold Corp. (NFG:TSX.V; NFGC:NYSE.American) — a highly publicized holding of billionaire Eric Sprott, who loves to have his name on private placements in order to attract institutional accompaniment.
The stock topped in 2021 at CA$13.50 per share, only to go through a series of disappointing resource calculations and board-level resignations. The stock is now at $3.93 despite an advance in gold from $1,700 in the month it topped in 2021 to the current level of $4,329.
Those who bought shares in NFG in 2021 as a proxy for a) gold and b) Eric Sprott’s brain have been squarely left in the camp of the “Bagholder Blues.” Let us take another look at the famous gold promotions of the past few years.
How about Novo Resources Corp. (NVO:TSX.V; NSRPF:OTCQX).
This company is touted by both Eric Sprott and legendary geoscientist Quentin Hennigh.
It topped at over $8.00 in 2017 and now resides at $0.12.
I would ask you all: Is it any wonder why a company staffed with solid management and loyal shareholders, developing an economically-viable project in an infinitely-promotable jurisdiction (Nevada), cannot cop a bid from the Sprotts or Rules of this world? Why does it take years to attract the favor of really well-intentioned and seasoned influencers?
Of my subscriber base, every single one has a story of some beautifully-promoted Canadian mining stock that sounds wonderful with really wealthy people talking it up that wound up with a frying-pan forehead from an irate wife that found out what hubby did with her inheritance money from Uncle Buck. Everyone has a New Found Gold or Novo skeleton hiding in their closet so when a real company with a real story comes along and asks new investors to look at the PEA which suggest that the stock should trade north of $1.00 at $2,250 gold and probably $5.00 at $4,000 gold and is available “on offer” at CA$0.385, their first instinct is to run for the hills as this story MUST be “too good to be true.”
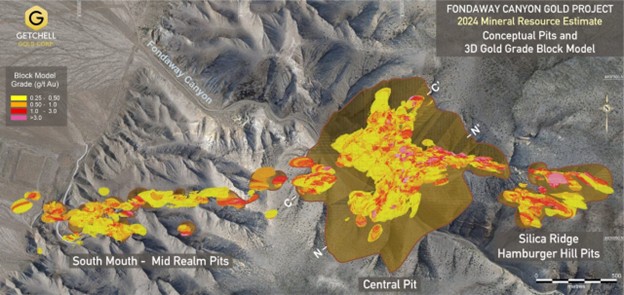
I could sit here and write another ten paragraphs, but it would be a wasted effort as I have been a loyal shareholder since 2018 and watched the company go from near-disintegration to virtual ecstasy earlier this month. Relative to other well-managed and well-sponsored juniors, GTCH/GGLDF is a takeover waiting to happen — a classic example where management is powerless to attract the value-add investor that takes a big position and then brings in his billionaire friends to take out all the weak hands. Make no mistake, CEO Mike Sieb has done a superb job finding gold and is fully capable of finding more, but finding gold and finding investors are two mutually exclusive exercises. It is one thing to find a mineralized trend, but it is many times as difficult to find a self-multiplying group of buyers of stock.
Nonetheless, Getchell Gold Corp.’s Fondaway Canyon asset is a jewel of an asset and will get bought at some price by some entity, especially at $4,400 gold that could easily be $8,400 gold in the next year, as I have been suggesting since 2020, when I first launched this letter. Chairman Robert Bass and his family own over 20% of issued capital and are staunch believers in the integrity of the project. So do I.
End of discussion.
Important Disclosures:
- As of the date of this article, officers, contractors, shareholders, and/or employees of Streetwise Reports LLC (including members of their household) own securities of Fitzroy Minerals Inc., Grafton Resources Inc., and Getchell Gold Corp.
- Michael Ballanger: I, or members of my immediate household or family, own securities of: Fitzroy Minerals Inc., Grafton Resources Inc., and Getchell Gold Corp. My company has a financial relationship with: None. My company has purchased stocks mentioned in this article for my management clients: None. I determined which companies would be included in this article based on my research and understanding of the sector.
- Statements and opinions expressed are the opinions of the author and not of Streetwise Reports, Street Smart, or their officers. The author is wholly responsible for the accuracy of the statements. Streetwise Reports was not paid by the author to publish or syndicate this article. Streetwise Reports requires contributing authors to disclose any shareholdings in, or economic relationships with, companies that they write about. Any disclosures from the author can be found below. Streetwise Reports relies upon the authors to accurately provide this information and Streetwise Reports has no means of verifying its accuracy.
- This article does not constitute investment advice and is not a solicitation for any investment. Streetwise Reports does not render general or specific investment advice and the information on Streetwise Reports should not be considered a recommendation to buy or sell any security. Each reader is encouraged to consult with his or her personal financial adviser and perform their own comprehensive investment research. By opening this page, each reader accepts and agrees to Streetwise Reports’ terms of use and full legal disclaimer. Streetwise Reports does not endorse or recommend the business, products, services or securities of any company.
For additional disclosures, please click here.
Michael Ballanger Disclosures
This letter makes no guarantee or warranty on the accuracy or completeness of the data provided. Nothing contained herein is intended or shall be deemed to be investment advice, implied or otherwise. This letter represents my views and replicates trades that I am making but nothing more than that. Always consult your registered advisor to assist you with your investments. I accept no liability for any loss arising from the use of the data contained on this letter. Options and junior mining stocks contain a high level of risk that may result in the loss of part or all invested capital and therefore are suitable for experienced and professional investors and traders only. One should be familiar with the risks involved in junior mining and options trading and we recommend consulting a financial adviser if you feel you do not understand the risks involved.


