Archive for Metals – Page 17

Palladium Speculators trim bearish bets for 2nd week as sentiment & prices improve

By InvestMacro

Here are the latest charts and statistics for the Commitment of Traders (COT) data published by the Commodities Futures Trading Commission (CFTC).

The latest COT data is updated through Tuesday May 16th and shows a quick view of how large traders (for-profit speculators and commercial entities) were positioned in the futures markets.

Weekly Speculator Changes led by Palladium & Silver

The COT metals markets speculator bets were lower this week as one out of the six metals markets we cover had higher positioning while the other five markets had lower speculator contracts.

Leading the gains for the metals this week was Palladium with a gain of 731 contracts.

The markets with declines in speculator bets for the week were Gold (-16,000 contracts), Silver (-8,545 contracts), Copper (-7,742 contracts), Steel (-524 contracts) and Platinum (-2,261 contracts) also registering lower bets on the week.

Palladium speculators trim their bearish bets for 2nd week as sentiment & prices improve

Highlighting the COT metals data this week is the improvement in bets for the Palladium speculative positions. Palladium was the only metal with a gain in speculator bets this week and has now risen for two straight weeks. Palladium has also gained in three out of the past five weeks. The current net speculator position of -4,916 contracts is the least bearish standing out of the past fourteen weeks.

The speculator positioning has been improving for Palladium as the strength index score (speculator positioning range of past three years) came out of a bearish extreme position this week for the first time since February 7th. Palladium’s strength index has improved by 16 percentage points over the past six weeks.

Fundamentally, the outlook for Palladium has taken a hit with car manufacturers looking to use Platinum instead of Palladium for parts, especially in electric cars. Despite the pullback from manufacturers, recent reports have shown the both Platinum and Palladium supply will be in deficits this year, possibly putting a floor under prices.

Palladium prices have bounced off of a major support level at $1,400 in recent weeks and closed this week above $1,520. Palladium raced as high as $3,425 in March of 2022 before dropping sharply into a downtrend that has extended into this year. Palladium bulls hope that the recent drop to $1,333 in March marks a new bottom as it coincides with the 2020 pandemic low-point as well.


Data Snapshot of Commodity Market Traders | Columns Legend
May-16-2023OIOI-IndexSpec-NetSpec-IndexCom-NetCOM-IndexSmalls-NetSmalls-Index
Gold521,83246179,81456-211,5574231,74360
Silver140,1392623,81552-37,0674913,25240
Copper210,41551-32,607028,695983,91243
Palladium12,76193-4,916205,38882-47213
Platinum73,4108325,82375-30,405314,58230


Strength Scores led by Platinum & Steel

COT Strength Scores (a normalized measure of Speculator positions over a 3-Year range, from 0 to 100 where above 80 is Extreme-Bullish and below 20 is Extreme-Bearish) showed that Platinum (75 percent) and Steel (60 percent) lead the metals markets this week. Copper (0 percent) comes in as the next highest in the weekly strength scores.

On the downside, Palladium (20 percent) comes in at the lowest strength level currently and is in Extreme-Bearish territory (below 20 percent). The next lowest strength score was Silver (52 percent).

Strength Statistics:
Gold (56.2 percent) vs Gold previous week (63.3 percent)
Silver (52.2 percent) vs Silver previous week (64.4 percent)
Copper (0.0 percent) vs Copper previous week (6.9 percent)
Platinum (75.2 percent) vs Platinum previous week (80.4 percent)
Palladium (20.1 percent) vs Palladium previous week (13.4 percent)
Steel (60.4 percent) vs Palladium previous week (61.9 percent)

Platinum & Palladium top the 6-Week Strength Trends

COT Strength Score Trends (or move index, calculates the 6-week changes in strength scores) showed that Platinum (24 percent) and Palladium (16 percent) lead the past six weeks trends for metals. Gold (-7 percent) is the next highest positive mover in the latest trends data.

Steel (-1 percent) leads the downside trend scores currently with Copper (-26 percent) as the next market with lower trend scores.

Move Statistics:
Gold (-6.8 percent) vs Gold previous week (6.2 percent)
Silver (3.6 percent) vs Silver previous week (27.1 percent)
Copper (-26.3 percent) vs Copper previous week (-20.7 percent)
Platinum (24.0 percent) vs Platinum previous week (40.9 percent)
Palladium (16.0 percent) vs Palladium previous week (10.3 percent)
Steel (-0.8 percent) vs Steel previous week (3.9 percent)


Individual Markets:

Gold Comex Futures:

Gold Futures COT ChartThe Gold Comex Futures large speculator standing this week equaled a net position of 179,814 contracts in the data reported through Tuesday. This was a weekly decrease of -16,000 contracts from the previous week which had a total of 195,814 net contracts.

This week’s current strength score (the trader positioning range over the past three years, measured from 0 to 100) shows the speculators are currently Bullish with a score of 56.2 percent. The commercials are Bearish with a score of 42.3 percent and the small traders (not shown in chart) are Bullish with a score of 59.6 percent.

Gold Futures StatisticsSPECULATORSCOMMERCIALSSMALL TRADERS
– Percent of Open Interest Longs:48.926.510.5
– Percent of Open Interest Shorts:14.567.04.4
– Net Position:179,814-211,55731,743
– Gross Longs:255,250138,32254,852
– Gross Shorts:75,436349,87923,109
– Long to Short Ratio:3.4 to 10.4 to 12.4 to 1
NET POSITION TREND:
– Strength Index Score (3 Year Range Pct):56.242.359.6
– Strength Index Reading (3 Year Range):BullishBearishBullish
NET POSITION MOVEMENT INDEX:
– 6-Week Change in Strength Index:-6.82.621.9


Silver Comex Futures:

Silver Futures COT ChartThe Silver Comex Futures large speculator standing this week equaled a net position of 23,815 contracts in the data reported through Tuesday. This was a weekly reduction of -8,545 contracts from the previous week which had a total of 32,360 net contracts.

This week’s current strength score (the trader positioning range over the past three years, measured from 0 to 100) shows the speculators are currently Bullish with a score of 52.2 percent. The commercials are Bearish with a score of 49.0 percent and the small traders (not shown in chart) are Bearish with a score of 40.0 percent.

Silver Futures StatisticsSPECULATORSCOMMERCIALSSMALL TRADERS
– Percent of Open Interest Longs:43.130.718.3
– Percent of Open Interest Shorts:26.157.28.8
– Net Position:23,815-37,06713,252
– Gross Longs:60,44043,02625,607
– Gross Shorts:36,62580,09312,355
– Long to Short Ratio:1.7 to 10.5 to 12.1 to 1
NET POSITION TREND:
– Strength Index Score (3 Year Range Pct):52.249.040.0
– Strength Index Reading (3 Year Range):BullishBearishBearish
NET POSITION MOVEMENT INDEX:
– 6-Week Change in Strength Index:3.6-6.817.4


Copper Grade #1 Futures:

Copper Futures COT ChartThe Copper Grade #1 Futures large speculator standing this week equaled a net position of -32,607 contracts in the data reported through Tuesday. This was a weekly decrease of -7,742 contracts from the previous week which had a total of -24,865 net contracts.

This week’s current strength score (the trader positioning range over the past three years, measured from 0 to 100) shows the speculators are currently Bearish-Extreme with a score of 0.0 percent. The commercials are Bullish-Extreme with a score of 97.8 percent and the small traders (not shown in chart) are Bearish with a score of 43.2 percent.

Copper Futures StatisticsSPECULATORSCOMMERCIALSSMALL TRADERS
– Percent of Open Interest Longs:28.447.59.1
– Percent of Open Interest Shorts:43.933.97.3
– Net Position:-32,60728,6953,912
– Gross Longs:59,693100,02319,241
– Gross Shorts:92,30071,32815,329
– Long to Short Ratio:0.6 to 11.4 to 11.3 to 1
NET POSITION TREND:
– Strength Index Score (3 Year Range Pct):0.097.843.2
– Strength Index Reading (3 Year Range):Bearish-ExtremeBullish-ExtremeBearish
NET POSITION MOVEMENT INDEX:
– 6-Week Change in Strength Index:-26.328.5-24.9


Platinum Futures:

Platinum Futures COT ChartThe Platinum Futures large speculator standing this week equaled a net position of 25,823 contracts in the data reported through Tuesday. This was a weekly fall of -2,261 contracts from the previous week which had a total of 28,084 net contracts.

This week’s current strength score (the trader positioning range over the past three years, measured from 0 to 100) shows the speculators are currently Bullish with a score of 75.2 percent. The commercials are Bearish with a score of 30.6 percent and the small traders (not shown in chart) are Bearish with a score of 29.5 percent.

Platinum Futures StatisticsSPECULATORSCOMMERCIALSSMALL TRADERS
– Percent of Open Interest Longs:54.428.99.9
– Percent of Open Interest Shorts:19.370.33.7
– Net Position:25,823-30,4054,582
– Gross Longs:39,96221,2287,282
– Gross Shorts:14,13951,6332,700
– Long to Short Ratio:2.8 to 10.4 to 12.7 to 1
NET POSITION TREND:
– Strength Index Score (3 Year Range Pct):75.230.629.5
– Strength Index Reading (3 Year Range):BullishBearishBearish
NET POSITION MOVEMENT INDEX:
– 6-Week Change in Strength Index:24.0-23.210.7


Palladium Futures:

Palladium Futures COT ChartThe Palladium Futures large speculator standing this week equaled a net position of -4,916 contracts in the data reported through Tuesday. This was a weekly advance of 731 contracts from the previous week which had a total of -5,647 net contracts.

This week’s current strength score (the trader positioning range over the past three years, measured from 0 to 100) shows the speculators are currently Bearish with a score of 20.1 percent. The commercials are Bullish-Extreme with a score of 82.4 percent and the small traders (not shown in chart) are Bearish-Extreme with a score of 13.3 percent.

Palladium Futures StatisticsSPECULATORSCOMMERCIALSSMALL TRADERS
– Percent of Open Interest Longs:14.061.98.9
– Percent of Open Interest Shorts:52.519.712.6
– Net Position:-4,9165,388-472
– Gross Longs:1,7827,9001,136
– Gross Shorts:6,6982,5121,608
– Long to Short Ratio:0.3 to 13.1 to 10.7 to 1
NET POSITION TREND:
– Strength Index Score (3 Year Range Pct):20.182.413.3
– Strength Index Reading (3 Year Range):BearishBullish-ExtremeBearish-Extreme
NET POSITION MOVEMENT INDEX:
– 6-Week Change in Strength Index:16.0-13.6-6.4


Steel Futures Futures:

Steel Futures COT ChartThe Steel Futures large speculator standing this week equaled a net position of -4,420 contracts in the data reported through Tuesday. This was a weekly decrease of -524 contracts from the previous week which had a total of -3,896 net contracts.

This week’s current strength score (the trader positioning range over the past three years, measured from 0 to 100) shows the speculators are currently Bullish with a score of 60.4 percent. The commercials are Bearish with a score of 40.1 percent and the small traders (not shown in chart) are Bearish-Extreme with a score of 8.6 percent.

Steel Futures StatisticsSPECULATORSCOMMERCIALSSMALL TRADERS
– Percent of Open Interest Longs:10.878.70.7
– Percent of Open Interest Shorts:26.862.41.0
– Net Position:-4,4204,502-82
– Gross Longs:2,99721,755185
– Gross Shorts:7,41717,253267
– Long to Short Ratio:0.4 to 11.3 to 10.7 to 1
NET POSITION TREND:
– Strength Index Score (3 Year Range Pct):60.440.18.6
– Strength Index Reading (3 Year Range):BullishBearishBearish-Extreme
NET POSITION MOVEMENT INDEX:
– 6-Week Change in Strength Index:-0.81.6-34.2


Article By InvestMacroReceive our weekly COT Newsletter

*COT Report: The COT data, released weekly to the public each Friday, is updated through the most recent Tuesday (data is 3 days old) and shows a quick view of how large speculators or non-commercials (for-profit traders) were positioned in the futures markets.

The CFTC categorizes trader positions according to commercial hedgers (traders who use futures contracts for hedging as part of the business), non-commercials (large traders who speculate to realize trading profits) and nonreportable traders (usually small traders/speculators) as well as their open interest (contracts open in the market at time of reporting). See CFTC criteria here.

Week Ahead: 4 Reasons To Closely Watch Gold

By ForexTime 

Gold prices could see some heightened volatility over the coming week due to US debt limit negotiations, the Fed minutes and key US economic data.

The past few days have certainly been rough for the precious metal with prices heading for their biggest weekly drop since February.

Before we take a deep dive into what factors may influence gold in the week ahead, here is a list of key economic reports and events to keep a close eye on:

Monday, May 22

  • CNY: China loan prime rates
  • EUR: Eurozone consumer confidence
  • USD: Fed speeches

Tuesday, May 23

  • EUR: Eurozone S&P Global Eurozone Manufacturing & Services PMI
  • GBP: S&P Global/ CIPS UK Manufacturing PMI
  • USD: US new home sales, Dallas Fed President Lorie Logan speech

Wednesday, May 24

  • NZD: Reserve Bank of New Zealand rate decision
  • EUR: Germany May IFO business climate
  • GBP: UK April CPI, Bank of England Governor Andrew Bailey speech
  • USD: Fed minutes

Thursday, May 25

  • EUR: Germany Q1 GDP (final)
  • USD: US initial jobless claims, Q1 GDP Annualised QoQ (second)

Friday, May 26

  • AUD: Australia April retail sales
  • JPY: Japan May Tokyo CPI
  • USD: US April PCE report, University of Michigan consumer sentiment   

Now, here are 4 reasons why we’re keeping a close eye on Gold:

  1. US Debt limit negotiations

The US Debt limit saga remains a hot topic that continues to influence global market sentiment.

To be clear, markets are not expecting the United States to default with traders pricing a less than 10% chance of it happening. Recent reports suggest that US President Joe Biden and top congressional Republican Kevin McCarthy are edging closer to a deal, with hopes rising over an agreement in principle by this weekend.

  • Gold prices could tumble further if there is a breakthrough in negotiations with the jump in risk appetite and potential boost to the dollar dragging prices towards the $1900 level.
  • Any hiccups in debt ceiling talks or further delays that shrink the window to strike a deal could send investors rushing back towards gold safe embrace. A wave of risk aversion and dollar weakness could push prices back above the psychological $2000 level.

Click here for more information about the US debt ceiling crisis.

  1. Fed minutes and speeches

The minutes from the latest Federal Reserve policy meeting and speeches from Fed officials could offer more clues about the central bank’s next move.

After raising interest rates by 25 basis points in May, the Federal Reserve signalled a potential pause. The minutes could offer more insight into the thinking of policymakers and how united they were around the idea of 5.25% being the peak level of rates. Should the minutes strike an overall dovish note, this may reinforce expectations around the Fed being done with rate hikes with the next move being a cut. However, a divide between participants could leave room for future hikes, especially if economic data warrants. It may also be wise to watch out for speeches from Fed officials in the first half of the week.

  • Gold bulls could fight back if the Fed minutes come across as dovish, with cautious Fed officials supporting any upside gains.
  • Any whiff of hawks or mention of additional hikes in the minutes may drag gold prices, with hawkish speeches from Fed officials rubbing salt into the wound.
  1. US April PCE report

The Fed’s preferred inflation gauge, the Core Personal Consumption Expenditure will be closely scrutinized by investors, especially after the central bank stressed that incoming data would influence monetary policy decisions.

Markets expect the April PCE report to show headline prices accelerated 0.3% month-over-month after March’s 0.1% increase while the core PCE deflator is forecast to rise 0.3%, same as March. The core personal consumption expenditures price index for projected to rise 4.5% year-over-year in April, down from the 4.6% seen in March.

Ultimately, more signs of cooling inflationary pressures could strengthen the argument around the Fed cutting interest rates late into the year. Traders are currently pricing in a 95% probability of a 25-basis point cut by the November Fed meeting, according to Fed funds futures.

  1. Gold breaches key support

After securing a solid daily close below the $1970 level, bears have the freedom to run rampant in the week ahead.

Sustained weakness below this level could open a path back towards $1945 and $1900, respectively. If bulls are able to fight back and claw prices back above the psychological $2000 level, gold could test $2032 and $2045. Although the technicals favour further downside, the fundamentals could easily throw bulls a lifeline. Watch this space.


Forex-Time-LogoArticle by ForexTime
ForexTime Ltd (FXTM) is an award winning international online forex broker regulated by CySEC 185/12 www.forextime.com

Copper Speculator bets slide to 32-week low as prices touch lowest since November

By InvestMacro

Here are the latest charts and statistics for the Commitment of Traders (COT) data published by the Commodities Futures Trading Commission (CFTC).

The latest COT data is updated through Tuesday May 9th and shows a quick view of how large traders (for-profit speculators and commercial entities) were positioned in the futures markets.

Weekly Speculator Changes led by Platinum & Palladium

The COT metals markets speculator bets were higher this week as four out of the six metals markets we cover had higher positioning while the other two markets had lower speculator contracts.

Leading the gains for the metals was Platinum (1,397 contracts) with Palladium (797 contracts), Silver (408 contracts) and Gold (247 contracts) also recording positive weeks.

The markets with declines in speculator bets for the week were Copper (-3,123 contracts) and Steel (-314 contracts).

Copper bets slide to 32-week low as prices touch lowest since November

Highlighting the COT metals data this week is the recent bearishness for the Copper speculative positions. The large speculator position in Copper futures decreased for the third straight week this week and has now dropped in five out of the past six weeks. The slide in Copper bets has taken the current net contracts standing down to a total of -24,865 contracts. This marks the most bearish level for speculators in the past 32-weeks, dating back to last September 27th.

Overall, the Copper speculator position has now been in a bearish level for eleven out of the past thirteen weeks.

Denting the sentiment for the red metal has been the weaker than expected data out of China (including imports & inflation), which is the largest importer of Copper in the world.

The Copper front-month futures price (US Comex futures) has been on downtrend since hitting a most recent high of $4.25 per pound in January. This week saw the price fall for a fourth straight week and close at approximately 3.73 per pound while also touching the lowest price since November. Overall, the Copper price is down about 25 percent from the post-2020 high of $4.6255 per pound that was reached in March of 2022.


Data Snapshot of Commodity Market Traders | Columns Legend
May-09-2023OIOI-IndexSpec-NetSpec-IndexCom-NetCOM-IndexSmalls-NetSmalls-Index
Gold518,95145195,81463-222,5153826,70147
Silver145,4453232,36064-46,1903813,83043
Copper194,24338-24,865619,732905,13351
Palladium13,295100-5,647135,96587-31823
Platinum74,1258628,08480-32,484264,40027


Strength Scores led by Platinum & Silver

COT Strength Scores (a normalized measure of Speculator positions over a 3-Year range, from 0 to 100 where above 80 is Extreme-Bullish and below 20 is Extreme-Bearish) showed that Platinum (80 percent) and Silver (64 percent) lead the metals markets this week. Steel (62 percent) comes in as the next highest in the weekly strength scores.

On the downside, Palladium (13 percent) comes in at the lowest strength level currently and is in Extreme-Bearish territory (below 20 percent).

Strength Statistics:
Gold (63.3 percent) vs Gold previous week (63.1 percent)
Silver (64.4 percent) vs Silver previous week (63.8 percent)
Copper (6.2 percent) vs Copper previous week (9.0 percent)
Platinum (80.4 percent) vs Platinum previous week (77.2 percent)
Palladium (13.4 percent) vs Palladium previous week (6.0 percent)
Steel (61.9 percent) vs Palladium previous week (62.8 percent)


Platinum & Silver top the 6-Week Strength Trends

COT Strength Score Trends (or move index, calculates the 6-week changes in strength scores) showed that Platinum (41 percent) and Silver (27 percent) lead the past six weeks trends for metals.

Copper (-21 percent) leads the downside trend scores currently.

Move Statistics:
Gold (6.2 percent) vs Gold previous week (16.3 percent)
Silver (27.1 percent) vs Silver previous week (40.7 percent)
Copper (-20.9 percent) vs Copper previous week (-8.4 percent)
Platinum (40.9 percent) vs Platinum previous week (39.6 percent)
Palladium (10.3 percent) vs Palladium previous week (5.3 percent)
Steel (3.9 percent) vs Steel previous week (3.4 percent)


Individual Markets:

Gold Comex Futures:

Gold Futures COT ChartThe Gold Comex Futures large speculator standing this week resulted in a net position of 195,814 contracts in the data reported through Tuesday. This was a weekly advance of 247 contracts from the previous week which had a total of 195,567 net contracts.

This week’s current strength score (the trader positioning range over the past three years, measured from 0 to 100) shows the speculators are currently Bullish with a score of 63.3 percent. The commercials are Bearish with a score of 38.0 percent and the small traders (not shown in chart) are Bearish with a score of 46.9 percent.

Gold Futures StatisticsSPECULATORSCOMMERCIALSSMALL TRADERS
– Percent of Open Interest Longs:51.325.210.0
– Percent of Open Interest Shorts:13.668.14.9
– Net Position:195,814-222,51526,701
– Gross Longs:266,472130,98552,012
– Gross Shorts:70,658353,50025,311
– Long to Short Ratio:3.8 to 10.4 to 12.1 to 1
NET POSITION TREND:
– Strength Index Score (3 Year Range Pct):63.338.046.9
– Strength Index Reading (3 Year Range):BullishBearishBearish
NET POSITION MOVEMENT INDEX:
– 6-Week Change in Strength Index:6.2-8.117.1


Silver Comex Futures:

Silver Futures COT ChartThe Silver Comex Futures large speculator standing this week resulted in a net position of 32,360 contracts in the data reported through Tuesday. This was a weekly advance of 408 contracts from the previous week which had a total of 31,952 net contracts.

This week’s current strength score (the trader positioning range over the past three years, measured from 0 to 100) shows the speculators are currently Bullish with a score of 64.4 percent. The commercials are Bearish with a score of 37.9 percent and the small traders (not shown in chart) are Bearish with a score of 43.3 percent.

Silver Futures StatisticsSPECULATORSCOMMERCIALSSMALL TRADERS
– Percent of Open Interest Longs:47.628.617.5
– Percent of Open Interest Shorts:25.360.48.0
– Net Position:32,360-46,19013,830
– Gross Longs:69,16641,63625,474
– Gross Shorts:36,80687,82611,644
– Long to Short Ratio:1.9 to 10.5 to 12.2 to 1
NET POSITION TREND:
– Strength Index Score (3 Year Range Pct):64.437.943.3
– Strength Index Reading (3 Year Range):BullishBearishBearish
NET POSITION MOVEMENT INDEX:
– 6-Week Change in Strength Index:27.1-29.429.8


Copper Grade #1 Futures:

Copper Futures COT ChartThe Copper Grade #1 Futures large speculator standing this week resulted in a net position of -24,865 contracts in the data reported through Tuesday. This was a weekly decrease of -3,123 contracts from the previous week which had a total of -21,742 net contracts.

This week’s current strength score (the trader positioning range over the past three years, measured from 0 to 100) shows the speculators are currently Bearish-Extreme with a score of 6.2 percent. The commercials are Bullish-Extreme with a score of 90.2 percent and the small traders (not shown in chart) are Bullish with a score of 50.9 percent.

Copper Futures StatisticsSPECULATORSCOMMERCIALSSMALL TRADERS
– Percent of Open Interest Longs:28.448.09.4
– Percent of Open Interest Shorts:41.237.86.8
– Net Position:-24,86519,7325,133
– Gross Longs:55,13193,21118,255
– Gross Shorts:79,99673,47913,122
– Long to Short Ratio:0.7 to 11.3 to 11.4 to 1
NET POSITION TREND:
– Strength Index Score (3 Year Range Pct):6.290.250.9
– Strength Index Reading (3 Year Range):Bearish-ExtremeBullish-ExtremeBullish
NET POSITION MOVEMENT INDEX:
– 6-Week Change in Strength Index:-20.920.9-8.4


Platinum Futures:

Platinum Futures COT ChartThe Platinum Futures large speculator standing this week resulted in a net position of 28,084 contracts in the data reported through Tuesday. This was a weekly gain of 1,397 contracts from the previous week which had a total of 26,687 net contracts.

This week’s current strength score (the trader positioning range over the past three years, measured from 0 to 100) shows the speculators are currently Bullish-Extreme with a score of 80.4 percent. The commercials are Bearish with a score of 26.3 percent and the small traders (not shown in chart) are Bearish with a score of 27.1 percent.

Platinum Futures StatisticsSPECULATORSCOMMERCIALSSMALL TRADERS
– Percent of Open Interest Longs:56.327.510.2
– Percent of Open Interest Shorts:18.471.44.2
– Net Position:28,084-32,4844,400
– Gross Longs:41,71220,4087,535
– Gross Shorts:13,62852,8923,135
– Long to Short Ratio:3.1 to 10.4 to 12.4 to 1
NET POSITION TREND:
– Strength Index Score (3 Year Range Pct):80.426.327.1
– Strength Index Reading (3 Year Range):Bullish-ExtremeBearishBearish
NET POSITION MOVEMENT INDEX:
– 6-Week Change in Strength Index:40.9-36.6-0.1


Palladium Futures:

Palladium Futures COT ChartThe Palladium Futures large speculator standing this week resulted in a net position of -5,647 contracts in the data reported through Tuesday. This was a weekly lift of 797 contracts from the previous week which had a total of -6,444 net contracts.

This week’s current strength score (the trader positioning range over the past three years, measured from 0 to 100) shows the speculators are currently Bearish-Extreme with a score of 13.4 percent. The commercials are Bullish-Extreme with a score of 87.2 percent and the small traders (not shown in chart) are Bearish with a score of 22.6 percent.

Palladium Futures StatisticsSPECULATORSCOMMERCIALSSMALL TRADERS
– Percent of Open Interest Longs:13.062.29.1
– Percent of Open Interest Shorts:55.517.311.5
– Net Position:-5,6475,965-318
– Gross Longs:1,7338,2691,211
– Gross Shorts:7,3802,3041,529
– Long to Short Ratio:0.2 to 13.6 to 10.8 to 1
NET POSITION TREND:
– Strength Index Score (3 Year Range Pct):13.487.222.6
– Strength Index Reading (3 Year Range):Bearish-ExtremeBullish-ExtremeBearish
NET POSITION MOVEMENT INDEX:
– 6-Week Change in Strength Index:10.3-10.36.7


Steel Futures Futures:

Steel Futures COT ChartThe Steel Futures large speculator standing this week resulted in a net position of -3,896 contracts in the data reported through Tuesday. This was a weekly decline of -314 contracts from the previous week which had a total of -3,582 net contracts.

This week’s current strength score (the trader positioning range over the past three years, measured from 0 to 100) shows the speculators are currently Bullish with a score of 61.9 percent. The commercials are Bearish with a score of 38.4 percent and the small traders (not shown in chart) are Bearish-Extreme with a score of 15.9 percent.

Steel Futures StatisticsSPECULATORSCOMMERCIALSSMALL TRADERS
– Percent of Open Interest Longs:12.277.10.8
– Percent of Open Interest Shorts:27.361.90.9
– Net Position:-3,8963,922-26
– Gross Longs:3,16119,929214
– Gross Shorts:7,05716,007240
– Long to Short Ratio:0.4 to 11.2 to 10.9 to 1
NET POSITION TREND:
– Strength Index Score (3 Year Range Pct):61.938.415.9
– Strength Index Reading (3 Year Range):BullishBearishBearish-Extreme
NET POSITION MOVEMENT INDEX:
– 6-Week Change in Strength Index:3.9-2.9-45.4


Article By InvestMacroReceive our weekly COT Newsletter

*COT Report: The COT data, released weekly to the public each Friday, is updated through the most recent Tuesday (data is 3 days old) and shows a quick view of how large speculators or non-commercials (for-profit traders) were positioned in the futures markets.

The CFTC categorizes trader positions according to commercial hedgers (traders who use futures contracts for hedging as part of the business), non-commercials (large traders who speculate to realize trading profits) and nonreportable traders (usually small traders/speculators) as well as their open interest (contracts open in the market at time of reporting). See CFTC criteria here.

Trade of the Week: The return of $2k gold?

By ForexTime 

Spot gold has been trapped within a $46 range for the most part since April 17th.

Though finding support around the upper-$1900 levels over the past two weeks, the precious metal can scarcely keep its head above the psychologically-important $2,000 line.


However, this week’s events could go a long way in determining whether we’ll see an upside or downside breakout for spot gold.


Here’s a play-by-play on 4 fundamental events over four days that could greatly influence spot gold this week:

  • Tuesday, May 2nd: Eurozone April inflation

The Eurozone’s CPI (consumer price index), which measures the changes in headline inflation, is forecasted to print at 7%.

If so, that would be an uptick from the 6.9% registered in March.

However, if the official CPI figure drops notably below that 7% mark, suggesting that headline inflation is easing, that would erode expectations for more European Central Bank rate hikes.

And such a notion should weaken the Euro while boosting the US dollar, which in turn may drag spot gold prices lower in USD terms.

Lower-than-expected Eurozone inflation = weaker Euro = stronger US dollar = lower gold


  • Wednesday, May 3rd: Federal Reserve rate decision

The US central bank is likely to raise its benchmark rates by another 25-basis points (bps).

Anything else (no hike/50-bps hike) would be a massive shock to traders and investors worldwide!

However, more importantly, markets are desperate to know whether this week’s Fed rate hike is the final one of a series that began over a year ago.

Confirmation from Fed Chair Jerome Powell that US rates would’ve reached its peak this week could see gold prices resurfacing above the $2k mark.

After all, gold is a zero-yielding asset (investors don’t get paid for holding on to gold) and shudders at the thought of US interest rates moving even higher than expected.

Furthermore, if markets get the sense that Fed rate CUTS are growing likelier in the latter part of 2023, that could give gold further impetus to launch another attempt at a fresh record high!

Fed rate hikes are over/Fed rate cuts later in 2023 = weaker US dollar = a potential return of US$2k gold


  • Thursday, May 4th: European Central Bank rate decision

The ECB is widely expected to hike its own benchmark rates by another 25-bps (same size as the Fed’s rate hike).

However, if the ECB shocks markets with a larger 50-bps hike (11.5% chance of such a shocker), or if ECB President Christine Lagarde presses home policymakers’ intentions to keep hiking rates (especially if Tuesday’s Eurozone CPI greatly exceeds market expectations), then the same formula may be called into action once more:

More hawkish ECB = stronger Euro = weaker US dollar = higher gold prices in USD terms.


  • Friday, May 5th: US jobs report

The US nonfarm payrolls headline number has to greatly defy the market-forecasted 180,000 print in order for gold to drag gold lower.

Further signs of resilient hiring momentum, despite the 475-bps (excluding this week’s expected 25-bps hike) in Fed rate hikes that were intended to destroy demand since Q1 2022, would suggest that the Fed can ill afford to pause its rate-hike cycle after this week.

Also, if April’s unemployment rate stubbornly matches the 3.5% rate set in March, as opposed to ticking higher to 3.6% as per forecasts, would likely add to expectations that the Fed has to stay hawkish (press ahead with more rate hikes).

Stronger-than-expected NFP = more incoming Fed rate hikes = stronger US dollar = weaker gold prices


Key levels for spot gold

SUPPORT:

  • Mid-$1970s: lower bound of recent trading range
  • $1959.66: early-February cycle high
  • $1934 – $1949 range: March-early April support
  • 50-day simple moving average (SMA)

Still, spot gold may not have far to fall, as long as markets refuse to abandon hopes that the Fed will have to start lowering US interest rates later this year.


RESISTANCE:

  • $2,000: psychologically-important mark
  • $2032.14: April 5th intraday high
  • $2048.36: one-year high (since March 2022)


The longer it can stay above that $2k mark, the greater the chances of a fresh record high for spot gold!


At the time of writing, Bloomberg’s model points to a 72% chance that spot gold will trade within the $1938.57 – $2031.73 range over the next one-week period.

The pivotal events due in the days ahead may also have a great influence on how gold performs in the weeks and months ahead.


Forex-Time-LogoArticle by ForexTime
ForexTime Ltd (FXTM) is an award winning international online forex broker regulated by CySEC 185/12 www.forextime.com

Metals Speculators raise Platinum bullish bets to 20-week high

By InvestMacro

Here are the latest charts and statistics for the Commitment of Traders (COT) data published by the Commodities Futures Trading Commission (CFTC).

The latest COT data is updated through Tuesday April 25th and shows a quick view of how large traders (for-profit speculators and commercial entities) were positioned in the futures markets.

Weekly Speculator Changes led by Platinum & Silver

The COT metals markets speculator bets were lower this week as two out of the six metals markets we cover had higher positioning while the other four markets had lower speculator contracts.

Leading the gains for the metals was Platinum (5,298 contracts) with Silver (4,008 contracts) also showing a positive week.

The markets with declines in speculator bets for the week were Copper (-25,976 contracts), Gold (-4,629 contracts), Steel (-785 contracts) and Palladium (-240 contracts) seeing lower bets on the week.

Speculators increase Platinum bullish bets to 20-week high

Highlighting the COT metals data this week is the rise in bullish bets for the Platinum speculative positions. The large speculator position in Platinum futures rose by over +5,000 contracts this week and are higher for the fourth time in the past five weeks as well as higher in six out of the past nine weeks.

A total of +20,091 contracts have been added to the net speculator position over the past five-week period, bringing the current standing to the most bullish level in twenty weeks, dating back to January 10th. Overall, the Platinum positioning has now been in bullish territory for thirty-two straight weeks.

The Platinum futures price recently hit its highest level in over a year with a high of $1102.00 on April 23rd. This marked the best level since March 9th of 2022 when prices reached all the way to $1197.00.

This week, however, Platinum gave back some of its gains and prices fell for the first time in the past five weeks and closed at the $1090.10 threshold. Despite this week’s decline, Platinum overall has risen by over twenty percent since it’s most recent low of $904 in February.


Data Snapshot of Commodity Market Traders | Columns Legend
Apr-25-2023OIOI-IndexSpec-NetSpec-IndexCom-NetCOM-IndexSmalls-NetSmalls-Index
Gold473,20924185,26459-211,9284226,66447
Silver149,6923730,60362-41,5234410,92027
Copper202,42244-17,042138,304808,73874
Palladium12,27088-5,877116,30990-43216
Platinum72,1257929,61784-34,316234,69931


Strength Scores led by Platinum & Silver

COT Strength Scores (a normalized measure of Speculator positions over a 3-Year range, from 0 to 100 where above 80 is Extreme-Bullish and below 20 is Extreme-Bearish) showed that Platinum (84 percent) and Silver (62 percent) lead the metals markets this week.

On the downside, Palladium (11 percent) and Copper (13 percent) come in at the lowest strength level currently and are in Extreme-Bearish territory (below 20 percent).

Strength Statistics:
Gold (58.6 percent) vs Gold previous week (60.6 percent)
Silver (61.9 percent) vs Silver previous week (56.2 percent)
Copper (13.2 percent) vs Copper previous week (36.4 percent)
Platinum (83.9 percent) vs Platinum previous week (71.7 percent)
Palladium (11.3 percent) vs Palladium previous week (13.5 percent)
Steel (57.0 percent) vs Palladium previous week (59.3 percent)


Silver & Platinum top the 6-Week Strength Trends

COT Strength Score Trends (or move index, calculates the 6-week changes in strength scores) showed that Silver (45 percent) and Platinum (44 percent) lead the past six weeks trends for metals.

Copper (-3 percent) leads the downside trend scores currently with Steel (-2 percent) as the next market with lower trend scores.

Move Statistics:
Gold (19.8 percent) vs Gold previous week (40.2 percent)
Silver (45.4 percent) vs Silver previous week (49.1 percent)
Copper (-2.6 percent) vs Copper previous week (14.9 percent)
Platinum (44.0 percent) vs Platinum previous week (44.3 percent)
Palladium (5.5 percent) vs Palladium previous week (13.5 percent)
Steel (-2.2 percent) vs Steel previous week (-1.2 percent)


Individual Markets:

Gold Comex Futures:

Gold Futures COT ChartThe Gold Comex Futures large speculator standing this week equaled a net position of 185,264 contracts in the data reported through Tuesday. This was a weekly fall of -4,629 contracts from the previous week which had a total of 189,893 net contracts.

This week’s current strength score (the trader positioning range over the past three years, measured from 0 to 100) shows the speculators are currently Bullish with a score of 58.6 percent. The commercials are Bearish with a score of 42.1 percent and the small traders (not shown in chart) are Bearish with a score of 46.8 percent.

Gold Futures StatisticsSPECULATORSCOMMERCIALSSMALL TRADERS
– Percent of Open Interest Longs:53.526.310.8
– Percent of Open Interest Shorts:14.471.15.2
– Net Position:185,264-211,92826,664
– Gross Longs:253,186124,51851,048
– Gross Shorts:67,922336,44624,384
– Long to Short Ratio:3.7 to 10.4 to 12.1 to 1
NET POSITION TREND:
– Strength Index Score (3 Year Range Pct):58.642.146.8
– Strength Index Reading (3 Year Range):BullishBearishBearish
NET POSITION MOVEMENT INDEX:
– 6-Week Change in Strength Index:19.8-21.829.0


Silver Comex Futures:

Silver Futures COT ChartThe Silver Comex Futures large speculator standing this week equaled a net position of 30,603 contracts in the data reported through Tuesday. This was a weekly lift of 4,008 contracts from the previous week which had a total of 26,595 net contracts.

This week’s current strength score (the trader positioning range over the past three years, measured from 0 to 100) shows the speculators are currently Bullish with a score of 61.9 percent. The commercials are Bearish with a score of 43.6 percent and the small traders (not shown in chart) are Bearish with a score of 27.0 percent.

Silver Futures StatisticsSPECULATORSCOMMERCIALSSMALL TRADERS
– Percent of Open Interest Longs:44.230.716.2
– Percent of Open Interest Shorts:23.758.48.9
– Net Position:30,603-41,52310,920
– Gross Longs:66,14545,90724,230
– Gross Shorts:35,54287,43013,310
– Long to Short Ratio:1.9 to 10.5 to 11.8 to 1
NET POSITION TREND:
– Strength Index Score (3 Year Range Pct):61.943.627.0
– Strength Index Reading (3 Year Range):BullishBearishBearish
NET POSITION MOVEMENT INDEX:
– 6-Week Change in Strength Index:45.4-39.12.6


Copper Grade #1 Futures:

Copper Futures COT ChartThe Copper Grade #1 Futures large speculator standing this week equaled a net position of -17,042 contracts in the data reported through Tuesday. This was a weekly fall of -25,976 contracts from the previous week which had a total of 8,934 net contracts.

This week’s current strength score (the trader positioning range over the past three years, measured from 0 to 100) shows the speculators are currently Bearish-Extreme with a score of 13.2 percent. The commercials are Bullish-Extreme with a score of 80.5 percent and the small traders (not shown in chart) are Bullish with a score of 73.6 percent.

Copper Futures StatisticsSPECULATORSCOMMERCIALSSMALL TRADERS
– Percent of Open Interest Longs:28.345.610.4
– Percent of Open Interest Shorts:36.741.56.1
– Net Position:-17,0428,3048,738
– Gross Longs:57,22492,29421,052
– Gross Shorts:74,26683,99012,314
– Long to Short Ratio:0.8 to 11.1 to 11.7 to 1
NET POSITION TREND:
– Strength Index Score (3 Year Range Pct):13.280.573.6
– Strength Index Reading (3 Year Range):Bearish-ExtremeBullish-ExtremeBullish
NET POSITION MOVEMENT INDEX:
– 6-Week Change in Strength Index:-2.61.010.7


Platinum Futures:

Platinum Futures COT ChartThe Platinum Futures large speculator standing this week equaled a net position of 29,617 contracts in the data reported through Tuesday. This was a weekly increase of 5,298 contracts from the previous week which had a total of 24,319 net contracts.

This week’s current strength score (the trader positioning range over the past three years, measured from 0 to 100) shows the speculators are currently Bullish-Extreme with a score of 83.9 percent. The commercials are Bearish with a score of 22.5 percent and the small traders (not shown in chart) are Bearish with a score of 31.1 percent.

Platinum Futures StatisticsSPECULATORSCOMMERCIALSSMALL TRADERS
– Percent of Open Interest Longs:57.225.410.5
– Percent of Open Interest Shorts:16.173.04.0
– Net Position:29,617-34,3164,699
– Gross Longs:41,24018,3027,597
– Gross Shorts:11,62352,6182,898
– Long to Short Ratio:3.5 to 10.3 to 12.6 to 1
NET POSITION TREND:
– Strength Index Score (3 Year Range Pct):83.922.531.1
– Strength Index Reading (3 Year Range):Bullish-ExtremeBearishBearish
NET POSITION MOVEMENT INDEX:
– 6-Week Change in Strength Index:44.0-41.312.6


Palladium Futures:

Palladium Futures COT ChartThe Palladium Futures large speculator standing this week equaled a net position of -5,877 contracts in the data reported through Tuesday. This was a weekly decline of -240 contracts from the previous week which had a total of -5,637 net contracts.

This week’s current strength score (the trader positioning range over the past three years, measured from 0 to 100) shows the speculators are currently Bearish-Extreme with a score of 11.3 percent. The commercials are Bullish-Extreme with a score of 90.1 percent and the small traders (not shown in chart) are Bearish-Extreme with a score of 15.7 percent.

Palladium Futures StatisticsSPECULATORSCOMMERCIALSSMALL TRADERS
– Percent of Open Interest Longs:11.668.19.4
– Percent of Open Interest Shorts:59.516.712.9
– Net Position:-5,8776,309-432
– Gross Longs:1,4288,3611,152
– Gross Shorts:7,3052,0521,584
– Long to Short Ratio:0.2 to 14.1 to 10.7 to 1
NET POSITION TREND:
– Strength Index Score (3 Year Range Pct):11.390.115.7
– Strength Index Reading (3 Year Range):Bearish-ExtremeBullish-ExtremeBearish-Extreme
NET POSITION MOVEMENT INDEX:
– 6-Week Change in Strength Index:5.5-5.75.3


Steel Futures Futures:

Steel Futures COT ChartThe Steel Futures large speculator standing this week equaled a net position of -5,564 contracts in the data reported through Tuesday. This was a weekly lowering of -785 contracts from the previous week which had a total of -4,779 net contracts.

This week’s current strength score (the trader positioning range over the past three years, measured from 0 to 100) shows the speculators are currently Bullish with a score of 57.0 percent. The commercials are Bearish with a score of 43.0 percent and the small traders (not shown in chart) are Bearish with a score of 27.8 percent.

Steel Futures StatisticsSPECULATORSCOMMERCIALSSMALL TRADERS
– Percent of Open Interest Longs:11.977.90.8
– Percent of Open Interest Shorts:30.459.70.6
– Net Position:-5,5645,49965
– Gross Longs:3,59523,482244
– Gross Shorts:9,15917,983179
– Long to Short Ratio:0.4 to 11.3 to 11.4 to 1
NET POSITION TREND:
– Strength Index Score (3 Year Range Pct):57.043.027.8
– Strength Index Reading (3 Year Range):BullishBearishBearish
NET POSITION MOVEMENT INDEX:
– 6-Week Change in Strength Index:-2.23.5-58.1


Article By InvestMacroReceive our weekly COT Newsletter

*COT Report: The COT data, released weekly to the public each Friday, is updated through the most recent Tuesday (data is 3 days old) and shows a quick view of how large speculators or non-commercials (for-profit traders) were positioned in the futures markets.

The CFTC categorizes trader positions according to commercial hedgers (traders who use futures contracts for hedging as part of the business), non-commercials (large traders who speculate to realize trading profits) and nonreportable traders (usually small traders/speculators) as well as their open interest (contracts open in the market at time of reporting). See CFTC criteria here.

Copper Speculator bets go bullish for first time since February

By InvestMacro

Here are the latest charts and statistics for the Commitment of Traders (COT) data published by the Commodities Futures Trading Commission (CFTC).

The latest COT data is updated through Tuesday April 18th and shows a quick view of how large traders (for-profit speculators and commercial entities) were positioned in the futures markets.

Weekly Speculator Changes led by Steel & Silver

The COT metals markets speculator bets were higher this week as five out of the six metals markets we cover had higher positioning while the other one market had lower speculator contracts.

Leading the gains for the metals was Copper (13,237 contracts) with Platinum (10,986 contracts), Silver (2,877 contracts), Palladium (1,436 contracts) and Steel (329 contracts) also having positive weeks.

The market with a decline in speculator bets for the week was Gold with a drop of -2,852 contracts on the week.

Copper bets go bullish for first time since February

Highlighting the COT metals data this week is the renewed bullishness for the Copper speculative positions. The large speculator position in Copper futures rose by over +13,000 contracts this week and are higher for the third time in the past five weeks.

Copper speculative bets have now gained by a total of +23,090 contracts over the past five weeks, going from a bearish net position of -14,156 contracts on March 14th to this week’s net position of +8,934 contracts. This week was the first time that net positions crossed over into bullish territory since February and Copper’s sentiment has been helped out by China’s economic reopening which uses the metal for many types of manufacturing and industry.

The Copper front-month futures price dipped this week but has been higher in the three of the past five weeks, continuing an uptrend since bottoming in July of 2022. Copper futures have gained by approximately 25 percent since that recent bottom in July and closed this week just below the $4.00 per pound major price level.


Data Snapshot of Commodity Market Traders | Columns Legend
Apr-18-2023OIOI-IndexSpec-NetSpec-IndexCom-NetCOM-IndexSmalls-NetSmalls-Index
Gold482,25428189,89361-216,4254026,53246
Silver158,3714626,59556-38,6564712,06133
Copper206,216478,93436-16,280607,34665
Palladium11,84882-5,637136,15189-51411
Platinum63,7945324,31972-28,202353,88320


Strength Scores led by Platinum & Gold

COT Strength Scores (a normalized measure of Speculator positions over a 3-Year range, from 0 to 100 where above 80 is Extreme-Bullish and below 20 is Extreme-Bearish) showed that Platinum (72 percent) and Gold (61 percent) lead the metals markets this week.  Steel (59 percent) comes in as the next highest in the weekly strength scores.

On the downside, Palladium (13 percent) comes in at the lowest strength level currently and is in Extreme-Bearish territory (below 20 percent).

Strength Statistics:
Gold (60.6 percent) vs Gold previous week (61.9 percent)
Silver (56.2 percent) vs Silver previous week (52.1 percent)
Copper (36.4 percent) vs Copper previous week (24.6 percent)
Platinum (71.7 percent) vs Platinum previous week (46.4 percent)
Palladium (13.5 percent) vs Palladium previous week (0.2 percent)
Steel (59.3 percent) vs Palladium previous week (58.4 percent)


Silver & Platinum top the 6-Week Strength Trends

COT Strength Score Trends (or move index, calculates the 6-week changes in strength scores) showed that Silver (49 percent) and Platinum (44 percent) lead the past six weeks trends for metals. Gold (40 percent) is the next highest positive mover in the latest trends data.

Steel (-1 percent) leads the downside trend scores currently.

Move Statistics:
Gold (40.2 percent) vs Gold previous week (37.0 percent)
Silver (49.1 percent) vs Silver previous week (33.9 percent)
Copper (14.9 percent) vs Copper previous week (1.6 percent)
Platinum (44.3 percent) vs Platinum previous week (18.5 percent)
Palladium (13.5 percent) vs Palladium previous week (-9.7 percent)
Steel (-1.2 percent) vs Steel previous week (-4.1 percent)


Individual Markets:

Gold Comex Futures:

Gold Futures COT ChartThe Gold Comex Futures large speculator standing this week was a net position of 189,893 contracts in the data reported through Tuesday. This was a weekly decline of -2,852 contracts from the previous week which had a total of 192,745 net contracts.

This week’s current strength score (the trader positioning range over the past three years, measured from 0 to 100) shows the speculators are currently Bullish with a score of 60.6 percent. The commercials are Bearish with a score of 40.4 percent and the small traders (not shown in chart) are Bearish with a score of 46.5 percent.

Gold Futures StatisticsSPECULATORSCOMMERCIALSSMALL TRADERS
– Percent of Open Interest Longs:53.925.610.5
– Percent of Open Interest Shorts:14.670.55.0
– Net Position:189,893-216,42526,532
– Gross Longs:260,061123,49650,647
– Gross Shorts:70,168339,92124,115
– Long to Short Ratio:3.7 to 10.4 to 12.1 to 1
NET POSITION TREND:
– Strength Index Score (3 Year Range Pct):60.640.446.5
– Strength Index Reading (3 Year Range):BullishBearishBearish
NET POSITION MOVEMENT INDEX:
– 6-Week Change in Strength Index:40.2-37.715.3


Silver Comex Futures:

Silver Futures COT ChartThe Silver Comex Futures large speculator standing this week was a net position of 26,595 contracts in the data reported through Tuesday. This was a weekly lift of 2,877 contracts from the previous week which had a total of 23,718 net contracts.

This week’s current strength score (the trader positioning range over the past three years, measured from 0 to 100) shows the speculators are currently Bullish with a score of 56.2 percent. The commercials are Bearish with a score of 47.1 percent and the small traders (not shown in chart) are Bearish with a score of 33.4 percent.

Silver Futures StatisticsSPECULATORSCOMMERCIALSSMALL TRADERS
– Percent of Open Interest Longs:39.832.816.1
– Percent of Open Interest Shorts:23.057.28.4
– Net Position:26,595-38,65612,061
– Gross Longs:62,96851,89125,438
– Gross Shorts:36,37390,54713,377
– Long to Short Ratio:1.7 to 10.6 to 11.9 to 1
NET POSITION TREND:
– Strength Index Score (3 Year Range Pct):56.247.133.4
– Strength Index Reading (3 Year Range):BullishBearishBearish
NET POSITION MOVEMENT INDEX:
– 6-Week Change in Strength Index:49.1-40.0-7.5


Copper Grade #1 Futures:

Copper Futures COT ChartThe Copper Grade #1 Futures large speculator standing this week was a net position of 8,934 contracts in the data reported through Tuesday. This was a weekly lift of 13,237 contracts from the previous week which had a total of -4,303 net contracts.

This week’s current strength score (the trader positioning range over the past three years, measured from 0 to 100) shows the speculators are currently Bearish with a score of 36.4 percent. The commercials are Bullish with a score of 59.6 percent and the small traders (not shown in chart) are Bullish with a score of 64.8 percent.

Copper Futures StatisticsSPECULATORSCOMMERCIALSSMALL TRADERS
– Percent of Open Interest Longs:32.643.29.1
– Percent of Open Interest Shorts:28.351.15.6
– Net Position:8,934-16,2807,346
– Gross Longs:67,26289,13118,851
– Gross Shorts:58,328105,41111,505
– Long to Short Ratio:1.2 to 10.8 to 11.6 to 1
NET POSITION TREND:
– Strength Index Score (3 Year Range Pct):36.459.664.8
– Strength Index Reading (3 Year Range):BearishBullishBullish
NET POSITION MOVEMENT INDEX:
– 6-Week Change in Strength Index:14.9-13.0-8.1


Platinum Futures:

Platinum Futures COT ChartThe Platinum Futures large speculator standing this week was a net position of 24,319 contracts in the data reported through Tuesday. This was a weekly boost of 10,986 contracts from the previous week which had a total of 13,333 net contracts.

This week’s current strength score (the trader positioning range over the past three years, measured from 0 to 100) shows the speculators are currently Bullish with a score of 71.7 percent. The commercials are Bearish with a score of 35.2 percent and the small traders (not shown in chart) are Bearish with a score of 20.2 percent.

Platinum Futures StatisticsSPECULATORSCOMMERCIALSSMALL TRADERS
– Percent of Open Interest Longs:54.928.411.1
– Percent of Open Interest Shorts:16.872.75.0
– Net Position:24,319-28,2023,883
– Gross Longs:35,02818,1477,076
– Gross Shorts:10,70946,3493,193
– Long to Short Ratio:3.3 to 10.4 to 12.2 to 1
NET POSITION TREND:
– Strength Index Score (3 Year Range Pct):71.735.220.2
– Strength Index Reading (3 Year Range):BullishBearishBearish
NET POSITION MOVEMENT INDEX:
– 6-Week Change in Strength Index:44.3-40.02.3


Palladium Futures:

Palladium Futures COT ChartThe Palladium Futures large speculator standing this week was a net position of -5,637 contracts in the data reported through Tuesday. This was a weekly rise of 1,436 contracts from the previous week which had a total of -7,073 net contracts.

This week’s current strength score (the trader positioning range over the past three years, measured from 0 to 100) shows the speculators are currently Bearish-Extreme with a score of 13.5 percent. The commercials are Bullish-Extreme with a score of 88.8 percent and the small traders (not shown in chart) are Bearish-Extreme with a score of 10.8 percent.

Palladium Futures StatisticsSPECULATORSCOMMERCIALSSMALL TRADERS
– Percent of Open Interest Longs:16.167.49.1
– Percent of Open Interest Shorts:63.715.513.5
– Net Position:-5,6376,151-514
– Gross Longs:1,9127,9881,084
– Gross Shorts:7,5491,8371,598
– Long to Short Ratio:0.3 to 14.3 to 10.7 to 1
NET POSITION TREND:
– Strength Index Score (3 Year Range Pct):13.588.810.8
– Strength Index Reading (3 Year Range):Bearish-ExtremeBullish-ExtremeBearish-Extreme
NET POSITION MOVEMENT INDEX:
– 6-Week Change in Strength Index:13.5-10.6-11.5


Steel Futures Futures:

Steel Futures COT ChartThe Steel Futures large speculator standing this week was a net position of -4,779 contracts in the data reported through Tuesday. This was a weekly boost of 329 contracts from the previous week which had a total of -5,108 net contracts.

This week’s current strength score (the trader positioning range over the past three years, measured from 0 to 100) shows the speculators are currently Bullish with a score of 59.3 percent. The commercials are Bearish with a score of 40.5 percent and the small traders (not shown in chart) are Bearish with a score of 38.5 percent.

Steel Futures StatisticsSPECULATORSCOMMERCIALSSMALL TRADERS
– Percent of Open Interest Longs:12.476.01.0
– Percent of Open Interest Shorts:28.660.30.5
– Net Position:-4,7794,632147
– Gross Longs:3,67122,409303
– Gross Shorts:8,45017,777156
– Long to Short Ratio:0.4 to 11.3 to 11.9 to 1
NET POSITION TREND:
– Strength Index Score (3 Year Range Pct):59.340.538.5
– Strength Index Reading (3 Year Range):BullishBearishBearish
NET POSITION MOVEMENT INDEX:
– 6-Week Change in Strength Index:-1.21.8-25.1


Article By InvestMacroReceive our weekly COT Newsletter

*COT Report: The COT data, released weekly to the public each Friday, is updated through the most recent Tuesday (data is 3 days old) and shows a quick view of how large speculators or non-commercials (for-profit traders) were positioned in the futures markets.

The CFTC categorizes trader positions according to commercial hedgers (traders who use futures contracts for hedging as part of the business), non-commercials (large traders who speculate to realize trading profits) and nonreportable traders (usually small traders/speculators) as well as their open interest (contracts open in the market at time of reporting). See CFTC criteria here.

Rage On

Source: Michael Ballanger  (4/17/23)

Michael Ballanger of GGM Advisory Inc. takes a look at the current state of the market and the gold and silver sector to tell you where he believes it is all headed. 

Cornering (a market): In finance, cornering the market consists of obtaining sufficient control of a particular stockcommodity, or other asset in an attempt to manipulate the market price. One definition of cornering the market is “having the greatest market share in a particular industry without having a monopoly.”

Anyone old enough to recall the late, great, stagflationary 70s was around to witness one of the truly great market “cornerings” of modern market history and one which was carried out in compliance with all laws and statutes set out by regulators in the 1970s.

It involved two Texas brothers, Herbert and Nelson “Bunker” Hunt, heirs to the multi-billion-dollar A.L. Hunt oil fortune, who made the determination that profligate spending by the Democrats for social programs to create “The Great Society” under Lyndon Johnston and continued by Republicans under Nixon with the Vietnam War would eventually, if not immediately, bankrupt the nation and debase the U.S. currency, which had been ongoing since 1971 with the termination of the Bretton Woods Agreement.

Silver Thursday

I was in university in the U.S. when the Dean of Finance of the Saint Louis U. business school went off on one of his legendary pre-lecture rants one morning, and it was always a “morning after” his weekly Thursday pub crawl on Friday morning at 8:00 a.m. — the first class of the day — as “The Doc” (Dr. Fred Yeager) — would fire up a Camel non-filter, sipping black coffee from a Styrofoam cup and launch into a “fire and brimstone” narrative on something the Fed or the Treasury was doing.

This time, it was a news headline of 1976 where it was first reported in the Wall Street Journal that a certain “Southern group” was amassing hundreds of thousands of ounces of silver which continued all through the late 70s until finally, after silver had charged from US$2 per ounce to over US$50 that the U.S. government decided they had had enough.

They came down with a sledgehammer-like strategy of moral suasion (urging Hunt’s creditors to withhold loans) and increased minimum maintenance margin levels, the combination of which choked off the Hunts’ ability to carry the massive trade and starting on March 27, 1980, the brokers carrying the position began a gargantuan liquidation that took silver from over US$50 to a shade above US$5 by June.

It was called “Silver Thursday.”

Despite a sincere desire to protect their wealth from the dangers of out-of-control government spending, the Hunts were trotted out as “Enemies of the State” and were relieved of hundreds of millions of dollars by a government and the infamous Wall Street “old boys club” that arbitrarily changed all of the rules and even fabricated new ones to fit their mission. Once the hammer came down, memories of the enrichment created for early players in the 70’s silver squeeze were forever etched in the collective psyches the world over, but it took until 2011 until silver once again approached US$50 per ounce in response to massively inflationary bailouts of the Wall Street banks.

With silver outperforming gold and the miners outperforming the metals . . .  I get a perfect set-up for a continuation move into summer of 2023 with new highs on the horizon.

Those very bankers, fearing the negative connotations of the spirited silver run being linked to outrageous Congressional favoritism over banks versus the public taxpayer, organized a brilliant wee-hours raid on the silver market when all of the Western traders were asleep and the “Sunday Night Massacre” of April 4, 2013, ushered in an epic crash taking the shiny metal’s price down through all support levels and into a bear market until late 2015.

While the 2011-2016 silver bear was painful, there was never any blatant evidence, such as materialized in 1979, that the government was going to intervene in the market. Instead, it took the shape and form of a classic Watergate Break-in type of crime.

No smoking guns were ever recovered from the 2013 pistol-whipping, but it smelled of government intervention with its trademark punctuality and savagery. Body bags were everywhere, and losses within the retail ranks were deep and widespread, but stocks went on to new highs day in and day out, further placating an investing public that was being trained in masterful Pavlovian fashion what happens when you invest in “high-risk assets like silver.”

So, here we are again in the midst of a strong, multi-month advance in the precious metals, with silver outperforming gold and the miners outperforming the metals, and that has been the case if I use as my starting point November 3, which was the date of the 2022 low for gold, I get a perfect set-up for a continuation move into summer of 2023 with new highs on the horizon.

If I take a second reading off the March 8 lows of five weeks ago, I get an even better technical picture with the PM miners and silver neck-and-neck and outperforming gold by a lengthy margin.

GDX and GDXJ 

VanEck Gold Miners ETF (GDX:NYSEARCA:)

I have ample exposure to gold and silver through physical ownership and by way of the junior portfolios.

But it has been almost three tears since I exited the VanEck Gold Miners ETF (GDX:NYSEARCA:) after making one of the best calls in my career on March 16, 2020, at the exact days the precious metals all bottomed.

I exited the positions in August 2020, with GDX approaching US$44 per share.

Thirty months later, we have the perfect set-up for precious metals, and up til the recent decision to cut output by the producer nations, energy was moving in the miner’s favorite direction — down.

VanEck Junior Gold Miner ETF (GDXJ:NYSEArca), 

Today’s little hiccup was all profit-taking as silver’s RSI touched 79 briefly before closing out the week back below 70. Within the complex, silver needs to cool off for a few days, during which I will be buying back my GDX position, hopefully in the US$32-33 range, into an early-week pullback.

I will also be teeing up the VanEck Junior Gold Miner ETF (GDXJ:NYSEArca), and while it may appear “late,” it really isn’t on a fundamental basis.

The miners are all dirt cheap, but once we achieve escape velocity for gold above US$2,100, I see a doubling of both Senior and Junior Gold ETFs by Q1/2024.

That should hit home pretty hard because I have avoided these ETFs for what feels like a lifetime. (Subscribers will receive notifications next week as to price and strategy.)

Stocks

I get no fewer than twenty-five emails a day from services offering to help me “Navigate the Upcoming CRASH!” followed by pictures of some bombed-out war zone or children wandering in the night.

The entire world is preoccupied to the point of obsession with this pending Armageddon that is lurking somewhere just above the tree line, but for me, I cannot buy it. There are really bad places on this earth to call “HOME,” but unless you had the bad fortune of being born there, you could always leave.

I met an ultra-sound technician today that emigrated from northeast mainland China over ten years ago with his wife and mother, who gave up a general practitioner “M.D.” license to take a secondary profession in Canada.

I asked how he liked the move, and he said it was the best decision he had ever made despite the 50-hour work weeks helping out in off hours his wife’s laundry business. He was undoubtedly the most over-qualified medical technician in the history of the North Durham Medical Centre, and I walked away after a handshake and a smile, feeling pretty happy for the chap.

Oddly enough, that is how I feel about the SPX these days.

Bob Farrell Rule #9: “When all the experts and forecasts agree — something else is going to happen.”

On the topic of consensus, what is the most heavily-debated topic in a Wall Street boardroom these days? It is “When will the Fed pivot?” Thousands of guesses and thousands of theories camouflage the least debated topic, which is “Will there be a recession?”

Bob Farrell Rule #9: “When all the experts and forecasts agree — something else is going to happen.”

No one agrees on the “Fed Pivot” thing, but they all agree that there will be a recession and a really nasty one, so the only thing to banty about should be “How Bad?”

Well, Bob Farrell was a pretty good investor with a long, battle-tested track record, and I will go with his Rule #9, which would have me take the absolute unanimity of agreement over the pending recession, which falls into the category of “foregone conclusion,” verging upon “no-brainer” verging upon “Take it to the bank” and assume that a) there will be NO recession or b) there will be a recession, but stocks go UP, not DOWN, or c) the recession is not enough to cool off inflation and the old adage that I should “Never underestimate the replacement power of equities within an inflationary spiral” rings true.

Every CNBC Guest commentator, every podcast guru, and every armchair “investment strategist” is calling for new lows, and they all can cite technical and fundamental reasons for that event to occur.

And I say, “No way.”

Stocks just went through a month that had huge volumes of “smart money” exiting the bank stocks (Uncle Warren, too!), with commentators drawing comparisons to 2008 and 2001 and all boasting from the rooftops that they were positioned with “record cash” or adequately hedged” as March not only did not whimper into April, it rumbled into April knocking tables over and stopping traffic.

It is within earshot of the February highs, just under 4,200, and just out of the M4 range for the August highs at 4,325. We have the positive buy signal of the January Barometer, giving me not a guarantee of an up year but a historical probability of one. And I’ll take that, any day, all day.

Stocks are climbing that very annoying “Wall of Worry” like 1982 and 1988 and 2009 and 2020, where prognosticators gnash and gnarl their incisors, crying in despair as margin calls swarm their inboxes.

I learned after many years and hundreds of thousands of lost dollars that stocks to whatever the hell they choose to, and there is no preordained rule that says that the number of hours you spend on “due diligence” will ensure a favorable outcome. Stocks have a personality, and they have memory muscles far more hardened than anything you or I possess, so when they go against you, learn to respect the mortal danger inherent in the wounded animal.

Stocks gave us a little “growl” in March; make damn sure you are on the right side of the “roar” in April.


Michael Ballanger Disclaimer:

This letter makes no guarantee or warranty on the accuracy or completeness of the data provided. Nothing contained herein is intended or shall be deemed to be investment advice, implied or otherwise. This letter represents my views and replicates trades that I am making but nothing more than that. Always consult your registered advisor to assist you with your investments. I accept no liability for any loss arising from the use of the data contained on this letter. Options and junior mining stocks contain a high level of risk that may result in the loss of part or all invested capital and therefore are suitable for experienced and professional investors and traders only. One should be familiar with the risks involved in junior mining and options trading and we recommend consulting a financial adviser if you feel you do not understand the risks involved.

Disclosures:

1) Michael J. Ballanger: I, or members of my immediate household or family, own securities of the following companies mentioned in this article: None. I personally am, or members of my immediate household or family are, paid by the following companies mentioned in this article: None.

2) The following companies mentioned in this article are billboard sponsors of Streetwise Reports: None. Click here for important disclosures about sponsor fees. As of the date of this article, an affiliate of Streetwise Reports has a consulting relationship with: None. Please click here for more information.

3) Statements and opinions expressed are the opinions of the author and not of Streetwise Reports or its officers. The author is wholly responsible for the validity of the statements. The author was not paid by Streetwise Reports for this article. Streetwise Reports was not paid by the author to publish or syndicate this article. Streetwise Reports requires contributing authors to disclose any shareholdings in, or economic relationships with, companies that they write about. Streetwise Reports relies upon the authors to accurately provide this information and Streetwise Reports has no means of verifying its accuracy.

4) This article does not constitute investment advice. Each reader is encouraged to consult with his or her individual financial professional and any action a reader takes as a result of information presented here is his or her own responsibility. By opening this page, each reader accepts and agrees to Streetwise Reports’ terms of use and full legal disclaimer. This article is not a solicitation for investment. Streetwise Reports does not render general or specific investment advice and the information on Streetwise Reports should not be considered a recommendation to buy or sell any security. Streetwise Reports does not endorse or recommend the business, products, services or securities of any company mentioned on Streetwise Reports.

5) From time to time, Streetwise Reports LLC and its directors, officers, employees or members of their families, as well as persons interviewed for articles and interviews on the site, may have a long or short position in securities mentioned. Directors, officers, employees or members of their immediate families are prohibited from making purchases and/or sales of those securities in the open market or otherwise from the time of the decision to publish an article until three business days after the publication of the article. The foregoing prohibition does not apply to articles that in substance only restate previously published company releases.

COT Metals Speculators raise their Silver bets for 5th week to a 10-week high

By InvestMacro

Here are the latest charts and statistics for the Commitment of Traders (COT) data published by the Commodities Futures Trading Commission (CFTC).

The latest COT data is updated through Tuesday April 11th and shows a quick view of how large traders (for-profit speculators and commercial entities) were positioned in the futures markets.

Weekly Speculator Changes led by Silver

The COT metals markets speculator bets were lower this week as just one out of the six metals markets we cover had higher positioning while the other five markets had lower speculator contracts.

Leading the gains for the metals was Silver with a rise of 2,435 contracts this week.

The markets with declines in speculator bets for the week were Gold (-2,471 contracts) with Platinum (-2,090 contracts), Copper (-1,349 contracts), Steel (-970 contracts) and Palladium (-427 contracts) also having lower bets on the week.

Silver speculator bets rise for 5th week to 10-week high

Highlighting the COT metals data this week is the continued bullishness for the Silver speculative positions. The large speculator position in Silver futures climbed this week for a fifth straight week. Silver spec bets have now jumped by a total of +31,500 contracts over the past five weeks. This recent speculator sentiment bump has taken the Silver position from a total of -1,219 contracts on March 14th to a total of +23,718 contracts this week, leveling at the most bullish standing for Silver in ten weeks.

The Silver futures price has continued to enjoy a bullish run and has now increased for five consecutive weeks. The futures price has risen by over 20 percent in these past five weeks and touched the highest level since last April before closing this week at almost $25.50.


Data Snapshot of Commodity Market Traders | Columns Legend
Apr-11-2023OIOI-IndexSpec-NetSpec-IndexCom-NetCOM-IndexSmalls-NetSmalls-Index
Gold476,56725192,74562-216,5484023,80340
Silver142,6992923,71852-36,2555012,53736
Copper209,50150-4,30325-1,217725,52053
Palladium12,29088-7,07307,491100-41817
Platinum60,1154113,33346-18,511555,17837


Strength Scores led by Gold & Steel

COT Strength Scores (a normalized measure of Speculator positions over a 3-Year range, from 0 to 100 where above 80 is Extreme-Bullish and below 20 is Extreme-Bearish) showed that Gold (62 percent) and Steel (58 percent) lead the metals markets this week.

On the downside, Palladium (0.2 percent) comes in at the lowest strength level currently and is in Extreme-Bearish territory (below 20 percent).

Strength Statistics:
Gold (61.9 percent) vs Gold previous week (63.0 percent)
Silver (52.1 percent) vs Silver previous week (48.6 percent)
Copper (24.6 percent) vs Copper previous week (25.8 percent)
Platinum (46.4 percent) vs Platinum previous week (51.2 percent)
Palladium (0.2 percent) vs Palladium previous week (4.2 percent)
Steel (58.4 percent) vs Palladium previous week (61.2 percent)


Gold & Silver top the 6-Week Strength Trends

COT Strength Score Trends (or move index, calculates the 6-week changes in strength scores) showed that Gold (37 percent) and Silver (34 percent) lead the past six weeks trends for metals. Platinum (18.5 percent) is the next highest positive mover in the latest trends data.

Palladium (-10 percent) leads the downside trend scores currently with Steel (-4 percent) as the next market with lower trend scores.

Move Statistics:
Gold (37.0 percent) vs Gold previous week (38.8 percent)
Silver (33.9 percent) vs Silver previous week (16.2 percent)
Copper (1.6 percent) vs Copper previous week (-4.5 percent)
Platinum (18.5 percent) vs Platinum previous week (28.9 percent)
Palladium (-9.7 percent) vs Palladium previous week (-13.5 percent)
Steel (-4.1 percent) vs Steel previous week (0.2 percent)


Individual Markets:

Gold Comex Futures:

Gold Futures COT ChartThe Gold Comex Futures large speculator standing this week resulted in a net position of 192,745 contracts in the data reported through Tuesday. This was a weekly decline of -2,471 contracts from the previous week which had a total of 195,216 net contracts.

This week’s current strength score (the trader positioning range over the past three years, measured from 0 to 100) shows the speculators are currently Bullish with a score of 61.9 percent. The commercials are Bearish with a score of 40.3 percent and the small traders (not shown in chart) are Bearish with a score of 39.6 percent.

Gold Futures StatisticsSPECULATORSCOMMERCIALSSMALL TRADERS
– Percent of Open Interest Longs:54.625.110.3
– Percent of Open Interest Shorts:14.170.65.3
– Net Position:192,745-216,54823,803
– Gross Longs:260,165119,71049,102
– Gross Shorts:67,420336,25825,299
– Long to Short Ratio:3.9 to 10.4 to 11.9 to 1
NET POSITION TREND:
– Strength Index Score (3 Year Range Pct):61.940.339.6
– Strength Index Reading (3 Year Range):BullishBearishBearish
NET POSITION MOVEMENT INDEX:
– 6-Week Change in Strength Index:37.0-34.412.3


Silver Comex Futures:

Silver Futures COT ChartThe Silver Comex Futures large speculator standing this week resulted in a net position of 23,718 contracts in the data reported through Tuesday. This was a weekly advance of 2,435 contracts from the previous week which had a total of 21,283 net contracts.

This week’s current strength score (the trader positioning range over the past three years, measured from 0 to 100) shows the speculators are currently Bullish with a score of 52.1 percent. The commercials are Bearish with a score of 50.0 percent and the small traders (not shown in chart) are Bearish with a score of 36.0 percent.

Silver Futures StatisticsSPECULATORSCOMMERCIALSSMALL TRADERS
– Percent of Open Interest Longs:39.033.417.7
– Percent of Open Interest Shorts:22.358.88.9
– Net Position:23,718-36,25512,537
– Gross Longs:55,58347,62925,218
– Gross Shorts:31,86583,88412,681
– Long to Short Ratio:1.7 to 10.6 to 12.0 to 1
NET POSITION TREND:
– Strength Index Score (3 Year Range Pct):52.150.036.0
– Strength Index Reading (3 Year Range):BullishBearishBearish
NET POSITION MOVEMENT INDEX:
– 6-Week Change in Strength Index:33.9-28.0-3.7


Copper Grade #1 Futures:

Copper Futures COT ChartThe Copper Grade #1 Futures large speculator standing this week resulted in a net position of -4,303 contracts in the data reported through Tuesday. This was a weekly decline of -1,349 contracts from the previous week which had a total of -2,954 net contracts.

This week’s current strength score (the trader positioning range over the past three years, measured from 0 to 100) shows the speculators are currently Bearish with a score of 24.6 percent. The commercials are Bullish with a score of 72.4 percent and the small traders (not shown in chart) are Bullish with a score of 53.3 percent.

Copper Futures StatisticsSPECULATORSCOMMERCIALSSMALL TRADERS
– Percent of Open Interest Longs:26.843.69.0
– Percent of Open Interest Shorts:28.844.26.3
– Net Position:-4,303-1,2175,520
– Gross Longs:56,06391,39918,793
– Gross Shorts:60,36692,61613,273
– Long to Short Ratio:0.9 to 11.0 to 11.4 to 1
NET POSITION TREND:
– Strength Index Score (3 Year Range Pct):24.672.453.3
– Strength Index Reading (3 Year Range):BearishBullishBullish
NET POSITION MOVEMENT INDEX:
– 6-Week Change in Strength Index:1.6-1.0-3.5


Platinum Futures:

Platinum Futures COT ChartThe Platinum Futures large speculator standing this week resulted in a net position of 13,333 contracts in the data reported through Tuesday. This was a weekly lowering of -2,090 contracts from the previous week which had a total of 15,423 net contracts.

This week’s current strength score (the trader positioning range over the past three years, measured from 0 to 100) shows the speculators are currently Bearish with a score of 46.4 percent. The commercials are Bullish with a score of 55.2 percent and the small traders (not shown in chart) are Bearish with a score of 37.4 percent.

Platinum Futures StatisticsSPECULATORSCOMMERCIALSSMALL TRADERS
– Percent of Open Interest Longs:49.234.512.6
– Percent of Open Interest Shorts:27.065.34.0
– Net Position:13,333-18,5115,178
– Gross Longs:29,57020,7687,569
– Gross Shorts:16,23739,2792,391
– Long to Short Ratio:1.8 to 10.5 to 13.2 to 1
NET POSITION TREND:
– Strength Index Score (3 Year Range Pct):46.455.237.4
– Strength Index Reading (3 Year Range):BearishBullishBearish
NET POSITION MOVEMENT INDEX:
– 6-Week Change in Strength Index:18.5-17.98.0


Palladium Futures:

Palladium Futures COT ChartThe Palladium Futures large speculator standing this week resulted in a net position of -7,073 contracts in the data reported through Tuesday. This was a weekly decline of -427 contracts from the previous week which had a total of -6,646 net contracts.

This week’s current strength score (the trader positioning range over the past three years, measured from 0 to 100) shows the speculators are currently Bearish-Extreme with a score of 0.2 percent. The commercials are Bullish-Extreme with a score of 100.0 percent and the small traders (not shown in chart) are Bearish-Extreme with a score of 16.6 percent.

Palladium Futures StatisticsSPECULATORSCOMMERCIALSSMALL TRADERS
– Percent of Open Interest Longs:11.971.710.7
– Percent of Open Interest Shorts:69.510.814.1
– Net Position:-7,0737,491-418
– Gross Longs:1,4638,8141,319
– Gross Shorts:8,5361,3231,737
– Long to Short Ratio:0.2 to 16.7 to 10.8 to 1
NET POSITION TREND:
– Strength Index Score (3 Year Range Pct):0.2100.016.6
– Strength Index Reading (3 Year Range):Bearish-ExtremeBullish-ExtremeBearish-Extreme
NET POSITION MOVEMENT INDEX:
– 6-Week Change in Strength Index:-9.78.24.2


Steel Futures Futures:

Steel Futures COT ChartThe Steel Futures large speculator standing this week resulted in a net position of -5,108 contracts in the data reported through Tuesday. This was a weekly lowering of -970 contracts from the previous week which had a total of -4,138 net contracts.

This week’s current strength score (the trader positioning range over the past three years, measured from 0 to 100) shows the speculators are currently Bullish with a score of 58.4 percent. The commercials are Bearish with a score of 41.4 percent and the small traders (not shown in chart) are Bearish with a score of 39.8 percent.

Steel Futures StatisticsSPECULATORSCOMMERCIALSSMALL TRADERS
– Percent of Open Interest Longs:12.076.41.1
– Percent of Open Interest Shorts:29.859.10.6
– Net Position:-5,1084,951157
– Gross Longs:3,42821,857317
– Gross Shorts:8,53616,906160
– Long to Short Ratio:0.4 to 11.3 to 12.0 to 1
NET POSITION TREND:
– Strength Index Score (3 Year Range Pct):58.441.439.8
– Strength Index Reading (3 Year Range):BullishBearishBearish
NET POSITION MOVEMENT INDEX:
– 6-Week Change in Strength Index:-4.14.4-10.3


Article By InvestMacroReceive our weekly COT Newsletter

*COT Report: The COT data, released weekly to the public each Friday, is updated through the most recent Tuesday (data is 3 days old) and shows a quick view of how large speculators or non-commercials (for-profit traders) were positioned in the futures markets.

The CFTC categorizes trader positions according to commercial hedgers (traders who use futures contracts for hedging as part of the business), non-commercials (large traders who speculate to realize trading profits) and nonreportable traders (usually small traders/speculators) as well as their open interest (contracts open in the market at time of reporting). See CFTC criteria here.

Gold rises as Treasury yields fall on weakening US inflation

By JustMarkets 

The US stock indices mostly rose yesterday. At the close of trading, Dow Jones (US30) was up by 1.14%, and S&P 500 (US500) increased by 1.33%. NASDAQ Technology Index (US100) jumped by 1.99%.

The US jobless claims rose to 239,000. This is the first increase in 3 weeks. Jobless claims in February fell to their lowest level since 2021, and labor force participation rose in March to its highest level in three years. This data indicates that the labor market is starting to weaken. The Producer Price Index, which shows the inflation rate between factories and factories, fell by 0.5% in the last month, indicating lower inflationary pressures in the US. Analysts believe the Federal Reserve may take a less aggressive stance on the monetary policy along with falling overall inflation. Minutes from the Fed’s March meeting showed that the Central Bank expects recent bank turmoil to trigger a “soft recession” later this year.

Today is the start of the US reporting season. JPMorgan Chase & Co (JPM), Citigroup Inc (C), and Wells Fargo & Company (WFC) will release quarterly results before trading opens.

Equity markets in Europe mostly rallied yesterday. By the end of the day, German DAX (DE30) gained 0.16%, French CAC 40 (FR40) added 1.13%, Spanish IBEX 35 (ES35) increased by 0.30%, British FTSE 100 (UK100) closed positively by 0.24%.

Inflationary pressures in Germany are starting to ease. The latest data showed that consumer prices declined from 8.7% to 7.4% year-on-year. Today the inflation data will be released by France and Spain. And if there is also a decline there, the ECB may well lower the rate hike to 0.25%.

Oil prices lost some of their upward momentum after OPEC warned that a recession could hurt the oil market. In a report released on Thursday, OPEC noted the risks of lower summer oil demand amid production cuts announced this month by oil producers. The report also indicated that oil stocks look set to increase in the coming months and that global growth is facing a number of challenges.

Gold is approaching a record high. Yesterday’s session high was $2063.15, less than $16 below the historic high of nearly $2080 set by Comex Gold in August 2020. The rise in gold prices on Thursday came after the US producer price index fell to its highest in almost three years, reinforcing the notion that inflationary pressures are easing and markets expect an end to rate hikes.

Asian markets were also rising yesterday. Japan’s Nikkei 225 (JP225) gained 0.26%, China’s FTSE China A50 (CHA50) added 0.19%, Hong Kong’s Hang Seng (HK50) increased by 0.17%, India’s NIFTY 50 (IND50) gained 0.09%, Australia’s S&P/ASX 200 (AU200) closed negative 0.27%.

China’s exports unexpectedly rose by 14.8% y/y in March, a sharp deviation from market forecasts of a 7% contraction. This also contrasts with the downward export trend over the last five months. Imports fell slightly by 1.4% but still recorded a 15.3% year-on-year increase. The export jump pushes the trade balance up, supporting China’s GDP in the first quarter.

The Monetary Authority of Singapore (MAS) was the latest in a growing list of central banks to suspend future interest rate hikes. The move also came after data showed Singapore’s economy slowed more than expected in the first quarter of 2023.

Bank of Japan Governor Kazuo Ueda said he expects the global economy to recover from a period of slowdown, which will boost domestic wages, keeping the bank’s economic outlook optimistic. Investors will be focused on the first Bank of Japan policy meeting chaired by Ueda on 27-28 April, when the board will present fresh quarterly growth and inflation forecasts for fiscal 2025.

S&P 500 (F) (US500) 4,146.22 +54.27 (+1.33%)

Dow Jones (US30)34,029.69 +383.19 (+1.14%)

DAX (DE40) 15,729.46 +25.86 (+0.16%)

FTSE 100 (UK100) 7,824.84 +39.12 (+0.50%)

USD Index 101.00 −0.50 (−0.49%)

Important events for today:
  • – Switzerland Producer Price Index (m/m) at 09:30 (GMT+3);
  • – French Consumer Price Index (m/m) at 09:45 (GMT+3);
  • – Spain Consumer Price Index (m/m) at 10:00 (GMT+3);
  • – US Retail Sales (m/m) at 15:30 (GMT+3);
  • – US Industrial Production (m/m) at 16:15 (GMT+3);
  • – US Michigan Consumer Sentiment (m/m) at 17:00 (GMT+3).

By JustMarkets


This article reflects a personal opinion and should not be interpreted as an investment advice, and/or offer, and/or a persistent request for carrying out financial transactions, and/or a guarantee, and/or a forecast of future events.

Trade Of The Week: Another Volatile Week For Gold?

By ForexTime

Gold prices shed as much as 1% on Monday morning after closing above the psychological $2000 level last week. Prices later recovered thanks to a weaker dollar and heightened geopolitical tensions over Taiwan.

Appetite for the precious metal was hit by last Friday’s goldilocks US jobs report which boosted bets around the Federal Reserve raising rates by 25 basis points in May. US payrolls increased by 236k in March, printing in line with expectations while the unemployment rate dropped to near-record lows of 3.5%. The upwardly revised payrolls figure for February of 326k was the icing on the cake, as the overall jobs report eased concerns that the world’s largest economy is heading for a recession. Given how this development may offer support to the dollar and feed Fed hike expectations, gold bulls could be caged in the short term.

Nevertheless, gold prices have been on a tear over the past few weeks as the horrible combination of banking fears and recession concerns fuelled risk aversion. After securing a weekly close above the $2000 level for the first time since August 2020, the key question is whether bulls have what it takes to push prices to the all-time high at $2075.47. While the fundamentals favour further upside, bears could be inspired by the renewed focus on inflation as the banking turmoil cools. On the technical front, the relative strength index (RSI) is signaling that prices are overbought on both the daily and weekly timeframe.

Taking a quick peek at the technical picture, gold remains bullish with the weekly close above the $2000 level signaling further upside. However, anything could be on the table given how prices are flirting close to the 70 level on its 14-week RS1.

The lowdown….

The dollar found itself under renewed selling pressure early last week after disappointing economic data fuelled recession fears and slashed Fed hike bets.

This potent combination, along with falling Treasury yields was enough to propel gold way above the psychological $2000 level on Tuesday with prices reaching their highest level since March 2022 at $2032 mid-week. Gold struggled to preserve its bullish momentum on Thursday thanks to technical forces, with a stabilizing dollar amid risk aversion dragging prices back toward $2000. The recent price action re-confirms that this psychological level remains a pivotal point for bulls and bears. Expect the pending economic reports and risk events to influence whether gold concludes the week above or below this level.

All eyes on US CPI & Fed minutes 

It will be wise to keep an eye on the US CPI report published on Wednesday.

Inflation in the United States is projected to slow 5.2% in March year-on-year compared to the 6% figure witnessed in February. If expectations match reality, this will mark the ninth consecutive decline in inflation. However, all eyes will be on the Core CPI readings which exclude more volatile items such as food and energy. Core inflation year-on-year is expected to rise 5.6% in March compared to 5.5% in the previous month. Ultimately, persistent signs of easing inflationary pressures in the world’s largest economy may fuel speculation around the Fed pausing rate hikes sooner than expected. This could boost appetite for zero-yielding gold, pushing prices back towards $2032 and beyond.

Wednesday also sees the release of the Fed meeting minutes which concluded a 25-basis point rate hike. All eyes will be on the language of the minutes and whether any fresh clues are offered on future Fed rate moves. If the minutes strike a dovish tone similar to the March meeting, this could reinforce market expectations around the Fed’s hiking cycle nearing an end.

Other than the highly anticipated US CPI report and Fed meeting, there are key speeches from Fed officials and key economic data throughout the week that could influence gold prices. On the geopolitical front, heightened tensions around the Taiwan Strait has the potential to fuel risk aversion – supporting safe-haven assets.

Is gold heading for the all-time high?

Gold remains bullish on the daily charts as there have been consistently higher highs and higher lows. However, prices seem to be flirting around overbought conditions on the RSI. The weekly close above $2000 could encourage an incline back toward $2032. Beyond this point, the next levels of interest are $2070 and $2075. Should prices slip back under $2000, gold could retest $1950 and $1900, respectively.


Forex-Time-LogoArticle by ForexTime
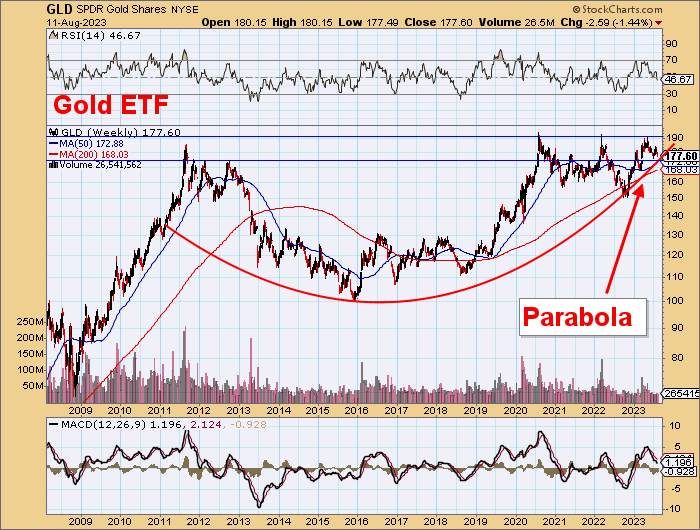
ForexTime Ltd (FXTM) is an award winning international online forex broker regulated by CySEC 185/12 www.forextime.com