Global Analyst Adrian Day reviews initial results from Altius Minerals Corp. (ALS:TSX) and takes a look at gold and gold stocks.
Altius Minerals Corp. (ALS:TSX) reported royalty revenue lower than both the previous and the year-ago quarter, as well as below estimates. Attributable revenue fell CA$2.3 million from CA$15 million in the first quarter, largely due to weak iron ore royalties, which accounted for CA$1.7 million of the decline.
Base metals revenue also fell due mostly to the timing of deliveries; potash was also down due to maintenance downtime. Given the temporary nature of these issues and higher prices, we expect both segments to recovery this quarter. These three areas were also down relative to the year-ago quarter, with iron ore revenue falling from a particularly strong $4.1 million to $1.1million.
Overall, revenue fell from over $20 million in the year-ago quarter to $12.7 million last quarter. Renewable energy saw high revenue as projects ramp up. The near-term focus continues to be the disposition of Altius’ 1.5% royalty on Anglo’s Arthur Deposit, with a pro forma value, based on the sale of Orogen’s similar 1% royalty, of CA$515 million, or just over 40% of Altius’ market cap.
Altius remains a Buy based on its NAV and potential gains from the sale of its Arthur royalty (or more).
TOP PICKS this week, in addition to above, include Nestle SA (NESN:VX; NSRGY:OTC), Franco-Nevada Corp. (FNV:TSX; FNV:NYSE), Royal Gold Inc. (RGLD:NASDAQ), and Fox River Resources Corp. (FOX:CSE).
THE U.S. DOLLAR After falling 11% in the first half, the worst first-half since 1973, the dollar is oversold; we should not expect another imminent sharp decline; markets don’t move in straight lines. However, a recovery may be slow and modest rather than any V-shaped rebound. Tariffs and other policies are making foreign investors reduce exposure to U.S. assets. When a foreigner buys, for example, U.S. stocks, bonds, or real estate, he must first convert his currency into dollars, boosting the dollar. A reduced appetite for U.S. assets, therefore, reduces demand for dollars. We are not forecasting a dollar collapse any time soon — other major currencies hardly represent fiscal rectitude — but at the margin, appetite for the Euro, British pound, yen, and commodity currencies (including the Canadian dollar, already up this year from 0.69 cents to 73) will increase, along with an increased demand for gold.
Gold Buying Trends and Stock Valuations
Central bank buying picked up in May, as gross sales declined meaningfully, the latest month for which data is available; though above multi-year levels, buying remains below the levels of 2023 and 2024. The People’s Bank of China added for the seventh straight month, after a pause last fall. Meanwhile, Chinese non-official buying, including inflows to China gold ETFs, has dwindled to almost nothingness, after surging earlier in the year. Global ETF inflows have picked up, however, the remain soft in the U.S. There were some inflows in the first three weeks of June, but then buying fell off again, with the largest ETF, GLD, seeing over $900 million in net outflows since June 24th. Commodity traders continue to be positive, but have reduced their positions all year (to little more than half of the February peak).
A record 95% of central banks expect global gold reserves to increase over the next 12 months, while none expects a decrease, this according to a survey from the World Gold Council. Over 40% of respondents expected their own reserves to increase, and none a decrease. After another strong quarter of central bank buying, gold is now the second-largest reserve asset, surpassing the Euro.
Main Drivers of Gold Remain Intact
For now, the major driver of gold buying revolves around possible changes in the global monetary regime, most notably central bank diversification in the face of dollar weaponization. Nothing that has happened this year diminishes that drive. Given this, it makes sense that U.S. demand has been weak, since concerns about monetary regime changes are more muted. But a major and long-lasting change in that regime, with the U.S. dollar losing its status as the sole reserve currency, along with less willingness to hold dollars internationally, most assuredly will have a significant impact on the U.S. economy and investor sentiment (cf. Britain in the 1950s to 1970s, when the pound fell from being worth five dollars to par, before Margaret Thatcher rescued the country).
There have been other factors supporting gold, of course, as diverse as the Trump-Powell tiff and the Middle East. But we have yet to see the macroeconomic environment, the things that traditionally drive gold, turn in gold’s favor. The U.S. has been characterized by a strong economy, low and falling inflation, high interest rates (and positive real rates), and, until this year, a relatively strong dollar. This is precisely the opposite of the environment conducive to gold. All of this is changing, if slowly, and as the narrative shifts, U.S. interest in gold will increase.
Gold Stock Sentiment Remains Weak
Add to the economic environment the fact that the S&P continues to go up month after month (as does the so-called Magnificent 7, despite some individual names stumbling), means that investors do not see the need to buy gold stocks. After a minor flurry into gold miner ETFs in late May early June, the flows reversed, with the GDX seeing $570 million of outflows in the past month, over $3.4 billion for the year to date. The dichotomy between prices and flows has never been greater.
Generalist interest is even weaker. Almost 80% of investment advisors have been zero and 1% exposure to gold in accounts they manage (and I bet for most of them, it’s close to zero than to 1%). Non-gold mutual funds have virtually no exposure. A total of 322 of the largest funds holds just 35 gold stocks. Only three funds own GLD among their top 20 positions, four own Newmont, and one owns Barrick.
Crowded Trade? Anything But
Staggeringly and unbelievably, global fund managers think that gold is the “most crowded” trade, according to a survey from Bank of America, with 58% of managers choosing gold against 22% saying the Magnificent 7, and only 1% saying the U.S. two-year Treasury. The number selecting gold (in May, the latest month) was up on April, despite the flat gold price since then. This is a reflection of managers who missed the bull move, in my view.
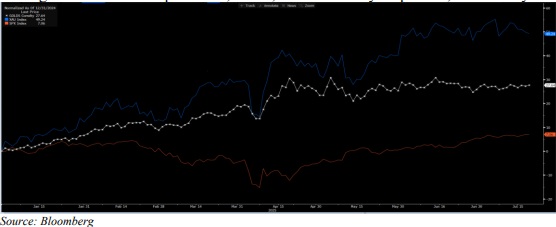
S&P investors, of course, are already lagging, with not only gold stocks but gold itself beating the S&P over the past four-, three-, two- and one-year periods, as well as year to Source: Bloomberg Date, and increasingly handsomely so (with the XAU up over 50% this year against less than 8% for the S&P, including dividends). In the graph are gold (white), the XAU (blue) and the S&P (red) year to date.
Gold Stocks Remain Undervalued, as Value Increases
Oscar Wilde berated those who know the price of everything but the value of nothing. Certainly, the 50% plus increase in the XAU indices this year has led many to instinctively think that the gold stocks are expensive. But the stocks are still extremely undervalued.
As the price of gold moves up, from the low $1,600s less than three years ago, to today $3,350, the value of the gold in the ground moves up; the price-to-NAV has therefore not increased over that period. As the price of gold has moved up far more rapidly than the cost of mining, the margins have expanded and with it corporate cash flows increased; thus the price-to-cash flow multiples have declined.
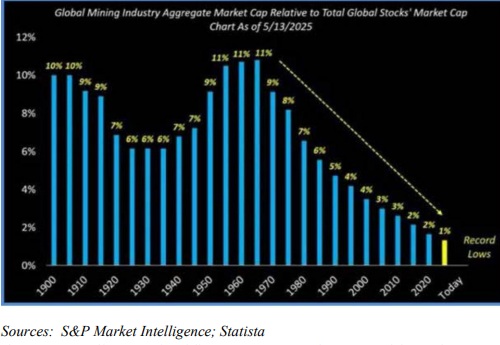
So we see the gold-standard of mining companies, Agnico Eagle Mines Ltd. (AEM:TSX; AEM:NYSE), trading in its lowest quartile of price-to-cash flow metric in 40 years; while Barrick Mining Corp. (ABX:TSX; B:NYSE), the #2 gold producer, is trading in the lowest decile of price-to-NAV in its history. Normally, when the price of the commodity goes up, we expect to see multiple expansion not contraction. Commodity prices are trading at 100-year lows relative to U.S. stocks. The same is true of mining stocks generally,
Sources: S&P Market Intelligence; Statista not only gold stocks; they are trading at significant 100-year lows, and less than 10% of their late-1960 relative valuation peaks.
Important Disclosures:
- As of the date of this article, officers and/or employees of Streetwise Reports LLC (including members of their household) own securities of Altius Minerals Corp., Franco-Nevada Corp., Fox Riv Res Corp., Agnico Eagle Mines Limited, and Barrick Mng Corp.
- Adrian Day: I, or members of my immediate household or family, own securities of: All. My company has a financial relationship with: None. My company has purchased stocks mentioned in this article for my management clients: All. I determined which companies would be included in this article based on my research and understanding of the sector.
- Statements and opinions expressed are the opinions of the author and not of Streetwise Reports, Street Smart, or their officers. The author is wholly responsible for the accuracy of the statements. Streetwise Reports was not paid by the author to publish or syndicate this article. Streetwise Reports requires contributing authors to disclose any shareholdings in, or economic relationships with, companies that they write about. Any disclosures from the author can be found below. Streetwise Reports relies upon the authors to accurately provide this information and Streetwise Reports has no means of verifying its accuracy.
- This article does not constitute investment advice and is not a solicitation for any investment. Streetwise Reports does not render general or specific investment advice and the information on Streetwise Reports should not be considered a recommendation to buy or sell any security. Each reader is encouraged to consult with his or her personal financial adviser and perform their own comprehensive investment research. By opening this page, each reader accepts and agrees to Streetwise Reports’ terms of use and full legal disclaimer. Streetwise Reports does not endorse or recommend the business, products, services or securities of any company.
For additional disclosures, please click here.
Adrian Day Disclosures
Adrian Day’s Global Analyst is distributed for $990 per year by Investment Consultants International, Ltd., P.O. Box 6644, Annapolis, MD 21401. (410) 224-8885. www.AdrianDayGlobalAnalyst.com. Publisher: Adrian Day. Owner: Investment Consultants International, Ltd. Staff may have positions in securities discussed herein. Adrian Day is also President of Global Strategic Management (GSM), a registered investment advisor, and a separate company from this service. In his capacity as GSM president, Adrian Day may be buying or selling for clients securities recommended herein concurrently, before or after recommendations herein, and may be acting for clients in a manner contrary to recommendations herein. This is not a solicitation for GSM. Views herein are the editor’s opinion and not fact. All information is believed to be correct, but its accuracy cannot be guaranteed. The owner and editor are not responsible for errors and omissions. © 2023. Adrian Day’s Global Analyst. Information and advice herein are intended purely for the subscriber’s own account. Under no circumstances may any part of a Global Analyst e-mail be copied or distributed without prior written permission of the editor. Given the nature of this service, we will pursue any violations aggressively.